R E S E A R C H
Open Access
The value of MRI for differentiating benign
from malignant sex cord-stromal tumors of
the ovary: emphasis on diffusion-weighted
MR imaging
Shu-Hui Zhao
1†, Hai-Ming Li
2†, Jin-Wei Qiang
2*, Deng-Bin Wang
1*and Hua Fan
1Abstract
Background:To investigate MRI for differentiating benign from malignant sex cord-stromal tumors of the ovary (SCSTs) emphasizing on the value of diffusion-weighted (DW) magnetic resonance (MR) imaging.
Methods:This retrospective study included 29 benign SCSTs in 28 patients and 13 malignant SCSTs in 13 patients. DW imaging as well as conventional MR imaging was performed. Signal intensity on DW imaging was assessed and apparent diffusion coefficient (ADC) value was measured. In addition, T2 signal intensity and contrast enhancement pattern were also assessed and compared between benign and malignant SCSTs.
Results:Both of the T2 hypointensity and mild enhancement were specific to benign SCSTs. The majority of
malignant SCSTs showed high signal intensity on DW imaging, whereas most benign SCSTs showed low or moderate signal intensity (p= 0.000). Fibromas were the tumors with the lowest observed ADC value (0.470 × 10⁻³mm2/s). Sclerosing stromal tumors were the tumors with the highest observed ADC value (2.291 × 10⁻³mm2/s). ADC value of solid component was significantly lower in malignant SCSTs (0.825 ± 0.129 × 10⁻³mm2/s) than in benign SCSTs (1.343 ± 0.528 × 10⁻³mm2/s) when fibromas were excluded (p= 0.024). T2, DCE and DW imaging has a limited value on the differential diagnosis of the benign and malignant SCSTs with an accuracy of 69.0%,71.4% and 78.1% respectively. Combination of T2, DCE and DW imaging permitted the distinction with an accuracy of 88.0%.
Conclusions:It is more helpful for distinction of the benign and malignant SCSTs by combining of T2, DCE and DW imaging than using each of the three sequences independently.
Keywords:Ovary, Sex cord-stromal tumor, Diffusion-weighted MR imaging
Background
Ovarian sex cord-stromal tumors (SCSTs) are a group of neoplasm arising from stromal cells and primitive sex cord, accounting for 8% of all ovarian tumors [1–3]. They can affect women of any age [4, 5]. Patients with SCSTs often present virilization syndromes or hyperestrogenic manifestations associated with steroid hormone overpro-duction [6, 7]. According to World Health Organization
(WHO) classification of the ovarian tumors (2014), SCSTs are divided into three clinicopathologic subcategories as pure stromal tumors, pure sex cord tumors and mixed sex cord-stromal tumors [3].
Morphologically, SCSTs often present as a solid mass [8–13]. On conventional MRI, some features have been found to distinguish SCSTs: Fibromas, known as the most common type of SCSTs, are characterized by very low signal intensity on T2WI and delayed mild en-hancement. Sclerosing stromal tumor shows low signal intensity in peripheral area and moderate to high signal intensity in central area on T2WI with intense en-hancement. Granulosa cell tumor is multiloculated cys-tic mass with thickened wall or mixed cyscys-tic and solid
* Correspondence:[email protected]; [email protected]
†Shu-Hui Zhao and Hai-Ming Li contributed equally to this work. 2
Department of Radiology, Jinshan Hospital, Fudan University, 1508 Longhang Road, Shanghai 201508, China
1
Department of Radiology, Xinhua Hospital affiliated to Shanghai Jiaotong University School of Medicine, 1665 Kongjiang Road, Shanghai 200092, China
mass [9,10]. Sertoli-Leydig cell tumor shows as a well--defined solid mass with numerous intratumoral cysts [1]. However, it is still a challenge for radiologists to differenti-ate benign from malignant SCSTs based on conventional MRI preoperatively [1–3]. Diffusion-weighted MR imaging has been proved to be helpful in characterizing epithelial tumors of the ovary. To our knowledge, a comprehensive study on diffusion-weighted MR imaging features specific to SCSTs have not been reported [8]. In this study, we in-vestigate diffusion-weighted imaging of 42 ovarian sex cord-stromal tumors in 41 patients (29 benign SCSTs in 28 patients and 13 malignant SCSTs in 13 patients) to differentiate benign from malignant sex cord-stromal tumors of the ovary. T2 signal intensity and contrast enhancement pattern were also assessed and compared between benign and malignant SCSTs.
Methods
Patient population
The institutional review board of our hospitals ap-proved this retrospective study, and informed consent was obtained from each patient for academic use of their clinical data. Patients with suspected ovarian tu-mors were enrolled in an ovarian tumor MRI study project from January 2010 to November 2016 at Xinhua Hospital affiliated to Shanghai Jiaotong University School of Medicine and Obstetrics & Gynecology Hos-pital of Fudan University. We found a total of 41 pa-tients with 42 primary ovarian sex cord-stromal tumors (29 benign SCSTs in 28 patients and 13 malignant SCSTs in 13 patients) (Table 1). Patients’ ages ranged from 24 to 81 years (mean, 51.6 ± 16.3 years) in the benign group and 22–70 years (mean, 41.0 ± 16.2 years) in the
malignant group, with no significant difference (p= 0.795) (Table 1). Patients presented with abdominal swelling, ir-regular menstruation cycle, postmenstrual vaginal bleed-ing, virilization or no symptom. All patients underwent surgery within 1 week after completing the MRI scan.
MR technique
MRI was performed with a 1.5 Tesla (T) MR supercon-ductor unit (Avanto, Siemens, Erlangen, Germany). A pel-vic phased-array coil was used in each case. The patients lay in the supine position and breathed normally. The scanning range was from the inferior pubic symphysis to the renal hilum and was extended beyond the dome of tumor in the cases with huge masses.
First, the unenhanced conventional sequences were obtained as follows: axial T1-weighted imaging (T1WI) spin-echo (repetition time/echo time [TR/TE], 340 ms/ 10 ms), T2-weighted imaging (T2WI) turbo spin-echo with and without fat saturation (TR/TE, 8000 ms/83 ms and 4000 ms/98 ms), and sagittal and coronal T2WI turbo spin-echo (TR/TE, 4000 ms/98 ms).
Second, axial DW imaging was obtained using echo planar imaging sequence. The scanning parameters were as follows: TR/TE, 3200 ms/87 ms; diffusion gradient b factors, 0 and 1000 s/mm2; matrix, 128 × 128; field of view, 238 mm × 280 mm; ST/IG, 5.0 mm/1.5 mm; exci-tations, 4; acquisition time, 2 min 46 s.
Finally, the contrast enhanced T1WI flash 2D with fat saturation (TR/TE, 196 ms/2.9 ms) was performed in the axial, sagittal, and coronal planes at 30s, 60s and 90s after the intravenous administration of gadopentetate dimeglumine (Gd-DTPA, 0.1 mmol/kg of body weight, Magnevist; Bayer Schering, Guangzhou, China) injected
Table 1Data of benign and malignant ovarian sex cord-stromal tumors
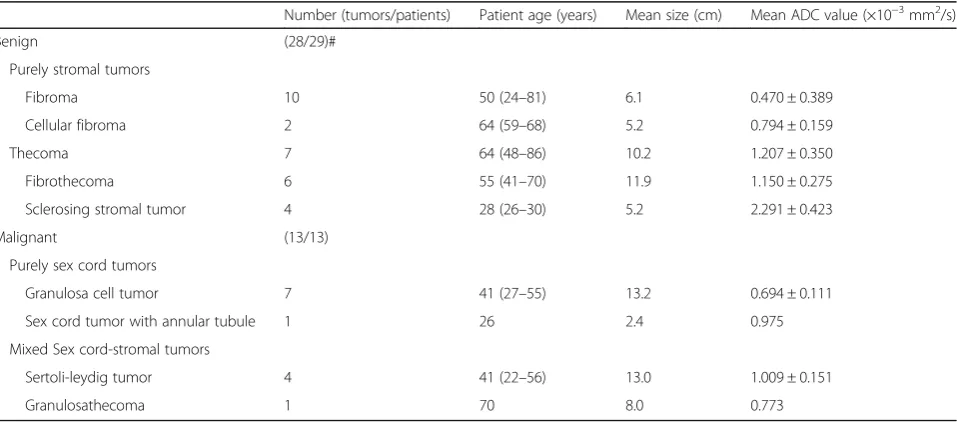
Number (tumors/patients) Patient age (years) Mean size (cm) Mean ADC value (×10−3mm2/s)
Benign (28/29)#
Purely stromal tumors
Fibroma 10 50 (24–81) 6.1 0.470 ± 0.389
Cellular fibroma 2 64 (59–68) 5.2 0.794 ± 0.159
Thecoma 7 64 (48–86) 10.2 1.207 ± 0.350
Fibrothecoma 6 55 (41–70) 11.9 1.150 ± 0.275
Sclerosing stromal tumor 4 28 (26–30) 5.2 2.291 ± 0.423
Malignant (13/13)
Purely sex cord tumors
Granulosa cell tumor 7 41 (27–55) 13.2 0.694 ± 0.111
Sex cord tumor with annular tubule 1 26 2.4 0.975
Mixed Sex cord-stromal tumors
Sertoli-leydig tumor 4 41 (22–56) 13.0 1.009 ± 0.151
Granulosathecoma 1 70 8.0 0.773
at a rate of 2–3 ml/s. The scanning parameters were as follows: 5-mm slice thickness, 1.5-mm gap, 256 × 256 matrix, 20–25 cm × 34 cm field of view, and four excitations.
Image analysis
MR images were analyzed by S.H.Z. and H.M.L., with 10 and 8 years of experience in gynecological imaging, re-spectively. Their interpretations were arrived at by consensus.
1. The signal intensity (SI) of the tumor on T2W imaging was qualitatively evaluated. It was classified as hypointensity (similar signal to the muscle), isointensity (similar signal to the myometrium) and hyperintensity (higher signal than the
myometrium).
2. The contrast enhancement of tumor was also qualitatively evaluated on images which acquired at 90s after administration of contrast medium. It was classified as and mild (similar to or weak than the muscles), moderate (between the muscles and the myometrium) and intense (similar to or stronger than the myometrium) enhancement.
3. The signal intensity (SI) of tumor on DW imaging was classified as low (lower than small intestine), moderate (similar to small intestine) or high (similar to the SI of nerve root). On ADC maps, a circular region of interest (ROI) of at least 1 cm2 was placed at targeted areas in the solid
components of tumor, by referring to conventional MR images including contrast-enhanced images. ROI should avoid areas such as hemorrhage, necro-sis, major vascular structures, and artefacts. At least three measurements were obtained and averaged. 4. The degeneration (edema, hemorrhage, and
demarcated cysts) of SCSTs was determined by analyzing unenhanced conventional MR images (T1WI, T2WI, T2FS), DW images and the contrast enhanced T1FS images.
Statistical analysis
Statistical analysis was performed using SPSS 23.0 for Mac (IBM Inc., New York, USA). Wilcoxon rank sum test was used to compare the differences of DW imaging SI between benign SCSTs and malignant SCSTs. One-way ANOVA was performed to compare the ADC values between benign SCSTs and malignant SCSTs. Wilcoxon rank sum test and chi-square test were used to compare the differences of T2 signal intensity and contrast enhancement pattern between benign SCSTs and malignant SCSTs. A p value less than 0.05 was regarded as statistically significant.
Results
Forty-two primary SCSTs were comprised of 29 benign lesions and 13 malignant lesions. The majority of malig-nant lesions were on stage I (FIGO) except for two le-sions (granulosa cell tumors) on stage II (FIGO).
T2 signal intensity of the 42 ovarian sex cord-stromal tumors are summarized in Table 2. Malignant SCSTs showed higher T2 SI than benign SCSTs (Wilcoxon rank sum test, p= 0.04). T2 hypointensity was only seen in benign SCSTs with a sensitivity of 58.6% and specificity of 92.3% in diagnosing benign SCSTs which yield an ac-curacy of 69.0% for differential diagnosis of the two groups. All of the 10 fibromas were T2 hypointensity (Figs.1and2).
Contrast enhancement pattern of the 42 ovarian sex cord-stromal tumors are summarized in Table3. Malignant SCSTs did not show more enhancement than benign SCSTs (Wilcoxon rank sum test,p> 0.05). However, mild enhancement was only seen in benign SCSTs with a sensi-tivity of 58.6% and specificity of 100% in diagnosing benign SCSTs which yield an accuracy of 71.4% for differential diagnosis of the two groups (Figs.1and2).
Fibromas were the tumors with the lowest observed ADC value (0.470 × 10⁻³mm2/s) (Table1, Figs.1 and2). Sclerosing stromal tumors were the tumors with the high-est observed ADC value (2.291 × 10⁻³ mm2/s) (Table 1, Fig.3).
DW imaging findings of the 42 ovarian sex cord-stromal tumors are summarized in Table4. The solid component showed high SI in 12 of 13 (92.3%) malignant SCSTs ver-sus in 3 of 29 (10.3%) benign SCSTs (p= 0.000) (Fig.4).
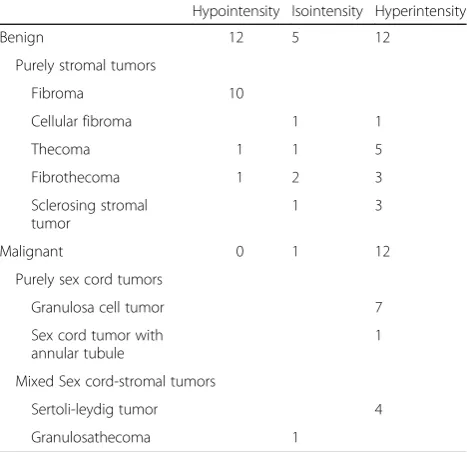
Table 2T2 signal intensity of the solid component of the 42 ovarian sex cord-stromal tumors
Hypointensity Isointensity Hyperintensity
Benign 12 5 12
Purely stromal tumors
Fibroma 10
Cellular fibroma 1 1
Thecoma 1 1 5
Fibrothecoma 1 2 3
Sclerosing stromal tumor
1 3
Malignant 0 1 12
Purely sex cord tumors
Granulosa cell tumor 7
Sex cord tumor with annular tubule
1
Mixed Sex cord-stromal tumors
Sertoli-leydig tumor 4
There was no significant difference in ADC values of solid component between the two groups when fibromas were included (p= 0.639). However, ADC value of solid component was significantly lower in malignant SCSTs (0.825 ± 0.129 × 10⁻³mm2/s) than in benign SCSTs (1.343 ± 0.528 × 10⁻³mm2/s) when fibromas were excluded (p= 0.024) (Figs.4 and5). ROC curve analysis yielded an opti-mal ADC value threshold of 0.838 × 10⁻³ mm2/s for differentiating malignant from benign tumors with a sensitivity of 61.5%, a specificity of 89.5% and an accur-acy of 78.1%.
Considering each of the three sequences of T2, DCE and DW imaging has a limited value on the differential diagnosis of the benign and malignant SCSTs with an accuracy of 69.0%,71.4% and 78.1% respectively, we de-veloped a multiparametric assessment which combined T2 with DCE and DW imaging. The assessment uses a 3-point scale based on the likelihood that the MRI find-ings correlates with the malignance of an ovarian sex cord-stromal tumor (Table 5). The assessment of the
ovarian sex cord-stromal tumors was categorized as: 1-benign; 2- high likelihood to be 1-benign; 3- high likeli-hood to be malignant. Category 1 (benign) was defined as a lesion which has typical MRI findings of T2 hypoin-tensity or mild enhancement (Figs. 1 and 2). In case DCE showed non-mild enhancement, the lesion is fur-ther assessed on DW imaging. Category 2 (high likeli-hood to be benign) was define as a lesion which has non-mild enhancement with a high ADC value(Fig. 3). When a lesion showed moderate enhancement, a lower ADC value than 0.838 × 10⁻³mm2/s uprate the lesion to category 3(high likelihood to be malignant) (Fig. 4). When a lesion showed intense enhancement, a lower ADC value than 1.000 × 10⁻³mm2/s uprate the lesion to category 3(high likelihood to be malignant).
Combination of T2, DCE and DW imaging is helpful for differential diagnosis of benign and malignant SCSTs with an accuracy of 88.0%.
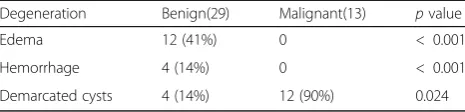
Degeneration in SCSTs demonstrated as edema, hemorrhage and demarcated cysts (Table6).
Edema and hemorrhage was only found in benign SCSTs. Edema area in lesion showed moderate signal intensity on DW imaging with a high ADC value. Hemorrhage showed high signal intensity on DW imaging with a low ADC value. Demarcated cysts were found in 14% of benign lesions ver-sus 90% of malignant lesions. Numerous mini cysts within the solid mass were only seen in malignant lesions.
Discussion
Fibromas can be distinguished from other types of SCSTs based on the specific features on conventional MR imaging. Shinagare [14] reported that fibromas are abundant in bland spindle cells and intercellular collagen which contribute to the remarkable low signal intensity on T2WI and slight enhancement by contrast agent [15–18]. In this study, we found that T2 hypointensity is more specific than mild enhancement to fibromas. So T2WI is the dominant sequence to distinguish fibromas from the the rest of SCSTs. Also, fibromas were the
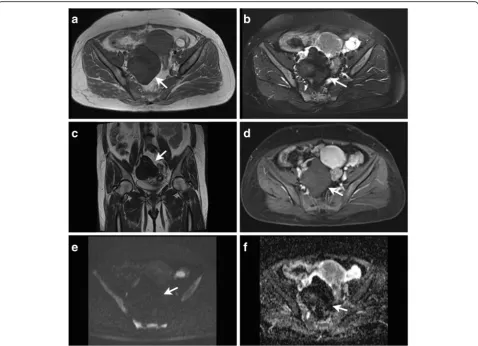
Fig. 2A 38-year-old women with a fibroma on the right ovary(arrows). Axial T1-weighted image (a) shows an oval mass of low signal intensity. T2-weighted with fat suppression image (b) shows the mass has significant low signal intensity with edema area of high signal intensity. The mass shows low signal intensity on DW imaging (c) and has a significant low ADC value of 0.181 × 10⁻³mm2/s in the non-edema area (d). T1-weighted contrast enhanced images (e) shows the mass was slightly enhanced after delay. The photomicrograph (H&E, × 400) (f) shows abundant fibrocytes
Table 3Contrast enhancement pattern of the 42 ovarian sex cord-stromal tumors
Mild Moderate Intense
Benign 17 8 4
Purely stromal tumors
Fibroma 9 1
Cellular fibroma 2
Thecoma 4 3
Fibrothecoma 4 2
Sclerosing stromal tumor 4
Malignant 0 9 4
Purely sex cord tumors
Granulosa cell tumor 7
Sex cord tumor with annular tubule 1
Mixed Sex cord-stromal tumors
Sertoli-leydig tumor 4
tumors with the lowest ADC value. Bland spindle cells and intercellular collagen lined so densely that water molecule movement is more restricted in less intercellu-lar space.
Although both T2 hypointensity and mild enhancement play a role in distinguishing benign SCSTs with a specifi-city of 100%, mild enhancement is more sensitive to be-nign SCSTs (Category 1). In case a lesion has a non-mild enhancement, the lesion should be further assessed on
DW imaging (Category 2). The ADC value threshold to uprate a lesion of Category 2 to Category 3 was 0.838 × 10⁻³mm2/s.
Sclerosing stromal tumors were the only subtype of benign SCSTs which were enhanced intensely [2, 3]. We found that sclerosing stromal tumors were the tu-mors with the highest observed ADC value (2.291 × 10⁻³ mm2/s). The explanation may be that the tumor has a characteristic microscopic pattern with pseudolo-bulation of the cellular areas separated by hypocellular areas of loose edematous connective tissue. Atram [19] reported that the edematous stromal change is a constant feature of sclerosing stromal tumors of the ovary. Sertoli-leydig tumors were the subtype of malignant SCSTs which were enhanced intensely [2, 3, 20]. The mean ADC value of sertoli-leydig tumors was 1.009 × 10⁻³ mm2/s. So when a lesion showed intensely en-hancement, we recommended a much higher ADC value threshold of 1.000 × 10⁻³ mm2/s to uprate the lesion to Category 3.
Degeneration in SCSTs is common which demonstrated as edema, hemorrhage and cyst change [14, 21]. Edema and hemorrhage were only observed in benign lesions. However, demarcated cysts were observed in benign and
Table 4DW imaging signal intensity (SI) and ADC value of benign and malignant ovarian sex cord-stromal tumors
Benign(29) Malignant(13) pvalue
SI < 0.001
Low 11 0
Moderate 15 1
High 3 12
ADC value (×10−3mm2/s)a 0.951 ± 0.625 0.825 ± 0.129 0.639
ADC value (×10−3mm2/s)b 1.343 ± 0.528 0.825 ± 0.129 0.024
a
ADC values was measured and averaged in 29 benign SCSTs and 13 malignant SCSTs respectively;
b
ADC values was measured and averaged in 19 benign SCSTs (fibromas were excluded) and 13 malignant
SCSTs respectively
malignant lesions. Kato [21] reported that up to 53% of fi-bromas demonstrated intratumoral cysts in their study.
There are some limitations in our study. First, it is a retrospective study. We just try to discuss about differenti-ation between benign and malignant sex cord-stromal tumors. We did not discuss about how to differentiate SCSTs from other pathological types of ovarian solid
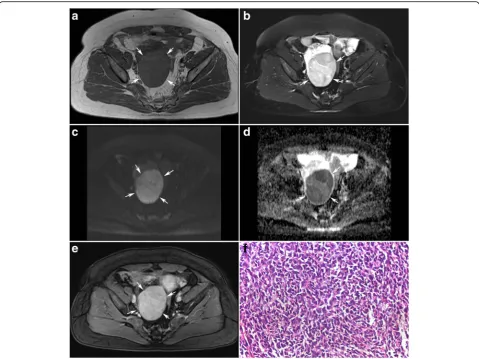
Fig. 4A 55-year women with an adult granulosa cell tumor on the right ovary(arrows). Axial T1-weighted image (a) shows a solid mass of low signal intensity. Axial T2-weighted with fat suppression images (b) show the mass has slightly high signal intensity. The solid mass shows high signal intensity on DW imaging (c) and has a low ADC value of 0.588 × 10⁻³mm2/s (d). T1-weighted contrast enhanced images (e) showed the solid mass was enhanced moderately. The photomicrograph (H&E, × 400) (f) confirmed the diagnosis of an adult granulosa cell tumor
Fig. 5Boxplot of the ADC value of sex cord-stromal tumor of the ovary. ADC value of solid component was significantly lower in malignant SCSTs (0.825 ± 0.129 × 10⁻³mm2/s) than in benign SCSTs (1.343 ± 0.528 × 10⁻³mm2/s) when fibromas were excluded
Table 5Assessment of the ovarian sex cord-stromal tumors on a 3-point scale based on combination of T2 signal intensity, contrast enhancement pattern and ADC value
T2 Enhancement ADC value
1 hypointensity – –
– mild
2 – moderate > 0.838 × 10⁻³mm2/s
intense > 1.000 × 10⁻³mm2/s
3 – moderate ≤0.838 × 10⁻³mm2/s
tumors. Prospective large sample investigation merits further study. Secondly, completely objective measure-ments of ADC value are usually difficult because sex cord-stromal tumors tumors tend to be heterogeneous masses. Thirdly, the variation in ADC between the sub-types of sex cord-stromal tumors is large.
Conclusions
T2, DCE and DW imaging has a limited value on the differ-ential diagnosis of the benign and malignant SCSTs with an accuracy of 69.0%,71.4% and 78.1% respectively. Combin-ation of T2, DCE and DW imaging is more helpful which permit the distinction with an accuracy of 88.0%.
Abbreviations
ADC:Apparent diffusion coefficient; DW: Diffusion-weighted; MR: magnetic resonance; SCST: Sex cord-stromal tumors of the ovary
Funding
Grant from National Natural Science Foundation of China (Nos. 81501439 and 81471628); Xinhua Hospital affiliated to Shanghai Jiaotong University School of Medicine (No. 14YJ1).
Availability of data and materials
We would not share the data and material used in this manuscript, because we need them for further research.
Authors’contributions
ZSH conceived of the study, and participated in its design and drafted the manuscript.
LHM participated in the data analysis/data acquisition. JWQ and DBW guaranteed the integrity of entire study. FH participated in the data acquisition. All authors read and approved the final manuscript.
Ethics approval and consent to participate
This retrospective study was approved by the institutional review board of Xinhua Hospital affiliated to Shanghai Jiaotong University School of Medicine, China. The informed consent requirement was waived. The ethics committee’s reference number was XHEC-D-2018-003.
Consent for publication Not applicable.
Competing interests
The authors declare that they have no competing interests.
Publisher’s Note
Springer Nature remains neutral with regard to jurisdictional claims in published maps and institutional affiliations.
Received: 16 January 2018 Accepted: 16 August 2018
References
1. Jung SE, Lee JM, Rha SE, Byun JY, Jung JI, Hahn ST. CT and MR imaging of ovarian tumors with emphasis on differential diagnosis. Radiographics. 2002; 22(6):1305–25.
2. Jung SE, Rha SE, Lee JM, Park SY, Oh SN, Cho KS, et al. CT and MRI findings of sex cord-stromal tumor of the ovary. Am J Roentgenol. 2005;185(1):207–15. 3. Horta M, Cunha TM. Sex cord-stromal tumors of the ovary: a comprehensive
review and update for radiologists. Diagn Interv Radiol. 2015;21(4):277–86. 4. Kawauchi S, Tsuji T, Kaku T, Kamura T, Nakano H, Tsuneyoshi M. Sclerosing
stromal tumor of the ovary: a clinicopathologic, immunohistochemical, ultrastructural, and cytogenetic analysis with special reference to its vasculature. Am J Surg Pathol. 1998;22(1):83–92.
5. Gui T, Cao D, Shen K, Yang J, Zhang Y, Yu Q, et al. A clinicopathological analysis of 40 cases of ovarian Sertoli-Leydig cell tumors. Gynecol Oncol. 2012;127(2):384–9.
6. Outwater EK, Marchetto B, Wagner BJ. Virilizing tumors of the ovary: imaging features. Ultrasound Obstet Gynecol. 2000;15(5):365–71. 7. Tanaka YO, Tsunoda H, Kitagawa Y, Ueno T, Yoshikawa H, Saida Y.
Functioning ovarian tumors: direct and indirect findings at MR imaging. Radiographics. 2004;24(Suppl 1):147–66.
8. Fujii S, Kakite S, Nishihara K, Harada T, Kigawa J, Kaminou T, et al. Diagnostic accuracy of diffusion-weighted imaging in differentiating benign from malignant ovarian lesions. J Magn Reson Imaging. 2008;28(5):1149–56. 9. Ko SF, Wan YL, Ng SH, Lee TY, Lin JW, Chen WJ, et al. Adult ovarian
granulosa cell tumors: spectrum of sonographic and CT findings with pathologic correlation. Am J Roentgenol. 1999;172(5):1227–33.
10. Kim SH, Kim SH. Granulosa cell tumor of the ovary: common findings and unusual appearances on CT and MR. J Comput Assist Tomogr. 2002;26(5): 756–61.
11. Scully RE. Sex cord tumor with annular tubules a distinctive ovarian tumor of the Peutz-Jeghers syndrome. Cancer. 1970;25(5):1107–21.
12. Young RH, Welch WR, Dickersin GR, Scully RE. Ovarian sex cord tumor with annular tubules: review of 74 cases including 27 with Peutz-Jeghers syndrome and four with adenoma malignum of the cervix. Cancer. 1982; 50(7):1384–402.
13. Moon WK, Kim SH, Kim WS, Kim IO, Yeon KM, Han MC. Ovarian sex cord tumor with annular tubules-imaging findings. Clin Radiol. 1995;50(8):581–2. 14. Shinagare AB, Meylaerts LJ, Laury AR, Mortele KJ. MRI features of ovarian
fibroma and fibrothecoma with histopathologic correlation. Am J Roentgenol. 2012;198(3):W296–303.
15. Graef MD, Kasem Z, Batch T, Tichoux C, Maubon A, Rouanet JP. Solid black lesion of the ovary in T2 weighted sequences: do they all belong to the thecomafibroma group? Radiologist. 2003;10(4):183–91.
16. Montoriol P-F, Mons A, Ines DD, Bourdel N, Tixier L, Garcier JM. Fibrous tumours of the ovary: Aetiologies and MRI features. Clin Radiol. 2013;68(12): 1276–83.
17. Troiano RN, Lazzarini KM, Scoutt LM, Lange RC, Flynn SD, Mccarthy S. Fibroma and fibrothecoma of the ovary: MR imaging finding. Radiology. 1997;204(3):795–8.
18. Chung BM, Park SB, Lee JB, Park HJ, Kim YS, Oh YJ. Magnetic resonance imaging features of ovarian fibroma, fibrothecoma, and thecoma. Abdom Imaging. 2015;40(5):1263–72.
19. Atram M, Anshu, Sharma S, Gangane N. Sclerosing stromal tumor of the ovary. Obstet Gynecol Sci. 2014;57(5):405–8.
20. Cai SQ, Zhao SH, Qiang JW, Zhang GF, Wang XZ, Wang L. Ovarian Sertoli– Leydig cell tumors: MRI findings and pathological correlation. J Ovarian Res. 2013;6(1):73.
21. Kato H, Kanematsu M, Ono H, Yano R, Furui T, Morishige K, et al. Ovarian fibromas: MR imaging findings with emphasis on intratumoral cyst formation. Eur J Radiol. 2013;82(9):e417–21.
Table 6Comparison of degeneration type and frequency between benign and malignant ovarian sex cord-stromal tumors
Degeneration Benign(29) Malignant(13) pvalue
Edema 12 (41%) 0 < 0.001
Hemorrhage 4 (14%) 0 < 0.001