34
Copyright © 2018. IJEMR. All Rights Reserved.
Volume-8, Issue-4, August 2018
International Journal of Engineering and Management Research
Page Number: 34-39
Analysis of Polycyclic Aromatic Hydrocarbons (PAHs) in Road Runoff
Water from High Traffic Area of Guwahati City, Assam, India
Dr. Yamin Hassan
Associate Professor, Department of Chemistry, Assam Down Town University, Guwahati, INDIA
Corresponding Author: [email protected]
ABSTRACT
Road runoff water samples were collected for the analysis of eight PAHs during first flush and aftermath in monsoon season of the year 2014-15 from 12 sites associated with high traffic activities round the clock . All the sites were selected for investigation to represent the high traffic activity areas of Guwahati city, Assam, India. Eight common environmental PAHs [Phenanthrene-(PHE), Benzo(K)FLUORANTHENE(-BKF), Benz(a) Pyrene-(BAP), Benzo(ghi)Pyrene-(BGHIP), Benzo(a) Anthracene/Chrysene-(BAA/CHR), Fluoranthene-(FLT), Pyrene-(PYR), Anthracene-(ANT)] were found to be distributed and the concentrartion of PAHs was determined by using HPLC technique. Polycyclic aromatic hydrocarbons (PAHs) are potentially mutagenic and carcinogenic substances occurring at various concentrations in atmosphere, soils, waters and sediments. PAHs, inherited both from natural and anthropogenic processes, are persistent organic pollutants (POP) due to their chemical stability and biodegradation resistance.
The present data indicates that the total average of PAHs over the investigated sites was ranged from 0.005 ng/l to 0.057 ng/l. On individual scale, the highest concentration were 0.057 ng/l and 0.053 ng/l for BKF and ANT. The investigation showed the carcinogenic content of PAHs (BKF) was found in all the investigated runoff water samples. The increase of road transportation, and of industrial and activities has led to a notable build up of PAH amounts in the environmental media.
Keywords-- Pyrene, Benz(a) Pyrene, High traffic activity area, Polycyclic aromatic hydrocarbons (PAHs), High performance liquid chromatography (HPLC)
I. INTRODUCTION
A good quantity of contaminates in rain water runoff has become an increasing concern in rain water utilization. Storm water runoff from urban areas is a significant source of pollution to inland water bodies such as streams, rivers and lakes [1]. Rain water utilization plays a very important role as one of the best counter measures against water shortage in urban areas.
It can overcome a shortage of water supply and in the mean while is very effective for runoff control [2,3,4]. Non potent pollution resulting from urban surface runoff was recognized as one of the major cause of quality deterioration in receiving water bodies [5,6,7]. Storm water runoff not only flows into the river but also rubbish, animal droppings, chemicals, fertilizers, oils, soil and anything that is placed in or washes into street gutters can end up in the river and polluting the environment[1].The major sources of PAH in storm water are the wear and leaching of asphalt, tire wear, drips of crankcase oil, and vehicular exhaust[8,9,10] .The most abundant PAHs in storm water are phenanthrene, anthracene, fluoranthene and pyrene [11]. Gonzalez et al. (2000) reported that these four PAHs accounted for 85% from a total 16 PAH in storm water. Several PAHs are carcinogenic and mutagenic [12], and are included in the United States Environmental Protection Agency (USEPA) and EU priority pollutants list. According to a Danish study, runoff-contaminated sediments from a stream and a retention basin were polluted with heavy metals and PAH, and the sediment and the pore water were toxic to algae [13]. Boxall and Maltby (1995) and Maltby et al. (1995) found that organic compounds were the source of the toxicity in runoff-contaminated sediment and that the fraction of three to five-ring PAHs were the major toxicants[14,15]
II.
MATERIALS AND
METHODOLOGY- ANALYSIS OF PAHS
IN ROAD RUNOFF WATER
Study Area
35
Copyright © 2018. IJEMR. All Rights Reserved.
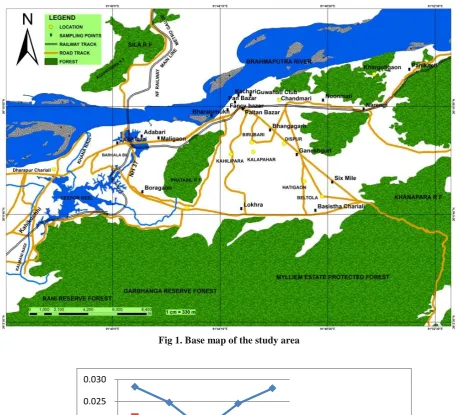
Eastern boundaries are made by a number of hill ranges, which are extensions of the Khasi Hills. The Jalukbari-Azara plain makes the Western boundary of the city. The master plan of the city also covers Amingaon and North Guwahati on the Northern side of the Brahmaputra. Structurally, this region is situated on the 50 m thick alluvium of the middle Brahmaputra valley. The city is situated on an outcrop of the stable rocky foundation of the Shillong Plateau and the floodplains of Brahmaputra confronting each other. Landforms within the city are therefore unique with dissected hills (originally part of the Shillong Plateau), plain areas and natural lakes (the beels), swamps and the mighty river Brahmaputra. Collection of samples
The water samples have been collected in pre-cleaned 2 L polyvinyl containers from 12 different locations of Guwahati on the basis of high traffic density areas during first flush and aftermath of first flush in the monsoon season of recent years. Necessary care has been taken to prevent contamination of the samples during transportation to the laboratory, storage and analysis [16,17].The geographical locations of the sampling points are given in Table 1. The base map of the study area is shown in Fig 1.
III.
MATERIALS AND REAGENTS
FOR PAH DETERMINATION IN ROAD
RUNOFF WATER
The water samples were stored at +4oC with the addition of 0.05% (w/v) sodium azide (NaN3).For preconcentration of PAHs by solid phase extrac-tion (SPE) Bakerbond C18 microcolumns (6.0 mL, 1000 mg) and Speedisk Bakerbond SPE-50 (C18) from J.T.Baker were used. Additionally single-use microfilters type Millex-HV (0.45 ìm) from Millipore were used.For conditioning of SPE columns and speedisks, removal of PAHs and separation by liquid chromatogra-phy solvents for HPLC separation (HPLC grade: water, acetonitryle, dichloromethane, methanol, ethanol, and isopropanol) from J.T. Baker were used. As a standard the mixture of 16 PAHs (naphtalene, acenaphthene, acenaphtylene, fluorene, phenanthrene, anthracene, fluoranthene, pyrene, benzo[a]anthracene,chrysene, benzo[b]fluoranthene,benzo[k]fluoranthene,benzo[a]pyr ene,dibenzo-[a,h]anthracene, benzo[g,h,i]-perylene, indeno[1,2,3-c,d]pyrene (purity 97.4-99.9%) in concentrations 10.0 mg/L of each from Ehrenstorfer (Germany) and standard of benzo[a]pyrene in concentration 100.0 mg/L ACN (purity 97.5%) from Sigma (USA) were used in experiments. All processes were done using single-use equipment and automatic pipets.
IV.
PRECONCENTRATION OF PAHS
BY SPE METHOD
The Bakerbond C18 microcolumns and Speedisks SPE-50 (C18) at the begining were eluted
(activated) by: 10.0 mL dichloromethane, 10.0 mL of isopropanol, 10.0 mL of ethanol, 10.0 mL of methanol and finally 10.0 mL of distilled and deionized water from Millipore system.The samples of water (1.0 L) were preconcentrated on Bakerbond C18 microcolumns (drinking water) or on Speedisk SPE-50 (C18) (lake or river water) with a flow rate of 2-3 mL/min. For pre concentration the SPE technique (SPE-12G from J.T. Baker) was used. The microcolumns and speedisk at the begining were eluted by: 10.0 mL of distilled water, 10.0 mL of methanol, 10.0 mL of ethanol and 10.0 mL of isopropanol. Later were eluted by: 10.0 mL of ACN and 10.0 mL of CH2Cl2 at a flow rate 2-3 mL/ min. Both fractions eluted by ACN and CH2Cl2 were collected and dried at inert gas flow at 28oC. The dried samples were resolved in 1.0 mL of CH2Cl2.For the measure of recovery of PAHs by SPE method 1.0 mL of solutions of 16 PAHs was added to 100 mL of CH2Cl2.For the measure of recovery of PAHs by SPE method 1.0 mL of solutions of 16 PAHs was added to 100 mL of distilled water.The samples were seperated by preconcentrated by microcolumns Bakerbond C-18 and by Bakerbond speedisk SPE-50(C-18) as environmental samples and were determined by RP-HPLC method.
V. ANALYTICAL CONDITIONS FOR
REVERSED-PHASE HPLC
Measurements were carried out using a HPLC system (Shimadzu LC-10 AD) with UV-visible detector. The analytical column was of 250 mm length and 4.6 mm i.d., packed with totally porous spherical RP-18 material (particle size 5µm). A guard column (10 mm long and 4.6 mm i.d.) preceded the analytical column.Acetonitrile-water mixture (70:30) was used as mobile phase at a flow rate of 1.0 ml per minute.Samples of 100 ml were injected into the column through the sample loop. A UV detector set at 254 nm for absorption was used for detection of the compounds. The data was processed with a CR 7A chromatopac data processor. Several dilutions corresponding to 0.2 to 20 ng absolute of synthetic standard mixture of individual components of phenanthrene, anthracene, fluoranthene, pyrene, benzo(a)anthracene, benzo(k)fluoranthene, and benzo(a)pyrene (supplied by Polyscience, USA) dissolved in HPLC grade acetonitrile was used for determining the retention data and for studying the linearity of the detector. The response was linear for a wide range of concentrations mentioned above. Using this method, PAH concentration of less than a nanogram in the sample could be quantified.
VI. RESULT AND DISCUSSION
36
Copyright © 2018. IJEMR. All Rights Reserved.
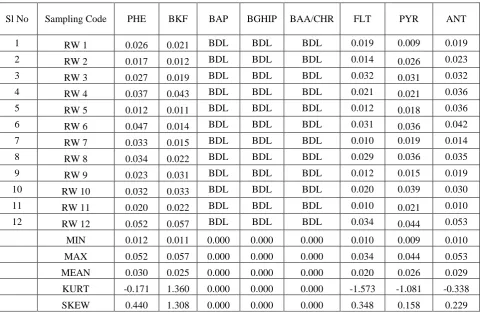
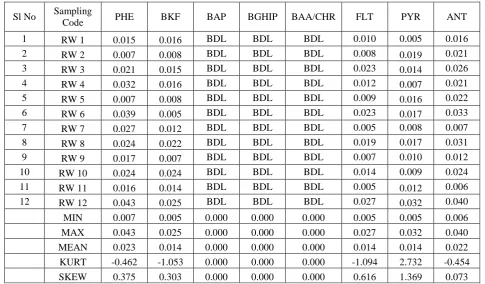
BKF are carcinogenic according to CCME(Canadian Council of Ministers of The Environment).The total concentration of eight PAHs of first flush and aftermath runoff water is presented in Table 2 and Table 3. Among the eight PAHs only five PAHs namely PHE,BKF,FLT,PYR and ANT were detected. The concentration of BAP,BGHIP and BAA/CHR are found below detectable level. During first flush the concentration of detected PAHs were found in the range 0.009 ng/l to 0.057 ng/l (Table 2) while for the run off samples collected aftermath of first flush was found in the range of 0.007 ng/l to 0.043 ng/l(Table 3).The mean concentration of five PAHs are given in Table 4. The mean concentration of all the detected five PAHs in the samples of first flush are more than the runoff water samples collected after first flush in the monsoon season as shown in Fig 2. The highest concentration were recorded for BKF(0.057 ng/l) and PHE(0.043 ng/l) as found in the Table 2 and Table 3.For all the five PAHs ,the maximum concentration was recorded for the site RW12. The site RW12 witnessed many more coke processing units, brick industries, alloy manufacturing units, cement manufacturing units in the two sides of the road may also responsible for the high concentration of PAHs in the samples of sampling point RW12. According to Mastral AM et al(1996), Lee C. W et al(1998), Khanfekr A et al(2009), Arulazhagan P et al(2010) and Fagbote, EO et al(2010),other sources for the presence of PAHs in the environment include lubricating oils, atmospheric depositions, plants, domestic heating systems, petrol and diesel engines and various industrial activities.
Statistical analysis
Normal statistics of runoff water quality parameters of road runoff water samples are presented in Table 2 and Table 3. Positive value of kurtosis was calculated for PYR for first Flush aftermath run off while for first flush run off samples it was found for BKF in 2014-15 season which show sharp distribution around the study area. Negative value of kurtosis for the remaining four PAHs
show a flat distribution around the study area. Positive value of skewness gives a distribution with a significant long right tail and negative value of skewness gives a distribution with a significant long left tail. Negative value of skewness was shown by BKF of runoff water samples collected after first flush whereas other four PAHs showed the positive values but all the five PAHs of first flush run off samples have shown positive skewness.
VII. CONCLUSION
The most abundant PAHs in the runoff water samples were PHE, BKF, FLT, PYR and ANT. Except sampling point RW12 all other sampling sites are
associated only with heavy traffic activities, so we may assume that mainly high traffic activities is responsible for the presence of detected PAHs in the study area. There was a significant difference between the mean concentrations of the first flush and aftermath of first flush runoff water samples as observed from Fig 2. This is may be due to binding of the PAHs with runoff water supported by high affinity of PAHs for organic carbon, and most PAH can therefore be found attached to particles that have settled or are suspended in the water column[12,23] . Smith et al. (2000) reported in his study that the total concentration of PAHs was highest at the beginning of the runoff, the so called first flush, and decreases with time. The identification of the sources have shown that industrial sources in association with traffic sources may contribute a significant amount of PAHs in the environment.
REFERENCES
[1] R A Allison, T A Walker, F H S Chiew, I C O’Neill, & T A McMahon. (1998). From roads to rivers - gross pollutant removal from waterways. technical report 98/6.
Cooperative Research Centre for Catchment Hydrology, 209-214.
[2] J Forster. (1999). Variability of roof runoff quality. Water Science and Technology, 39(5), 137–144.
[3] Abbasi MN, Tufail M, & Chaudhry MM. (2013). Assessment of heavy elements in suspended dust along the Murree Highway near Capital City of Pakistan. World Applied Sciences Jounal, 21(9), 1266–1275. [4] Addo MA, Darko EO, Gordon C, Nyarko BJB, & Gbadago JK. (2012). Heavy metal concentrations in road deposited dust at Ketu-south district, Ghana. International Journal of Science and Technology, 2(1), 28–39.
[5] Moore F, Forghani G, & Qishlaqi A. (2009). Assessment of heavy metal contamination in water and surface sediments of the Maharlu saline Lake, Swiran. Iranian Journal of Science and Technology, Transaction A, 33(A1), 43–55.
[6] Dasaram B, Satyanarayanam M, Sudarshan V, & Krishna AK. (2011). Assessment of soil contamination in Patancheru industrial area, Hyderabad, Andhra Pradesh, India. Research Journal of Environmental and Earth Sciences, 3(3), 214–220.
[7] Usha D & Vikram Reddy M. (2012). Assessment of trace metal Pollution of water and sediment of river Gadilam (Cuddalore, South east coast of India) receiving sugar industry effluents. Journal of Environmental Sciences, 6(3), 8–24.
37
Copyright © 2018. IJEMR. All Rights Reserved.
Table 1. The geographical coordinates of road runoff water sampling points during 2014-15 monsoon season.
Table 2. The total concentration of PAHs (ng/l) of first flush runoff water during the year 2014-15.
Sl No Sampling Code Geographical Coordinates
1 RW 1 N 26°11
/
00.9// and E 091046/26.9//
2 RW 2 N 26°08
/57.1// and E 091047/08.5//
3 RW 3 N 26°07/14.1// and E 091049/18.5//
4 RW 4 N 26°05/56.7// and E 091052/35.4//
5 RW 5 N 26°09
/53.8// and E 091046/06.5//
6 RW 6 N 26°10/43.3// and E 091045/02.8//
7 RW 7 N 226°09
/
32.9//and E 091041/47.5//
8 RW 8 N 26°09/29.9// and E 091040/52.5//
9 RW 9 N 26°11
/
05.9// and E 091045/25.4//
10 RW 10 N 26°06
/43.8// and E 091047/52.6//
11 RW 11 N 226°09
/26.5// and E 091040/25.0//
12 RW 12 N 26°02/42.2// and E 091052/04.9//
Sl No Sampling Code PHE BKF BAP BGHIP BAA/CHR FLT PYR ANT
1 RW 1 0.026 0.021 BDL BDL BDL 0.019 0.009 0.019
2 RW 2 0.017 0.012 BDL BDL BDL 0.014 0.026 0.023
3 RW 3 0.027 0.019 BDL BDL BDL 0.032 0.031 0.032
4 RW 4 0.037 0.043 BDL BDL BDL 0.021 0.021 0.036
5 RW 5 0.012 0.011 BDL BDL BDL 0.012 0.018 0.036
6 RW 6 0.047 0.014 BDL BDL BDL 0.031 0.036 0.042
7 RW 7 0.033 0.015 BDL BDL BDL 0.010 0.019 0.014
8 RW 8 0.034 0.022 BDL BDL BDL 0.029 0.036 0.035
9 RW 9 0.023 0.031 BDL BDL BDL 0.012 0.015 0.019
10 RW 10 0.032 0.033 BDL BDL BDL 0.020 0.039 0.030
11 RW 11 0.020 0.022 BDL BDL BDL 0.010 0.021 0.010
12 RW 12 0.052 0.057 BDL BDL BDL 0.034 0.044 0.053
MIN 0.012 0.011 0.000 0.000 0.000 0.010 0.009 0.010
MAX 0.052 0.057 0.000 0.000 0.000 0.034 0.044 0.053
MEAN 0.030 0.025 0.000 0.000 0.000 0.020 0.026 0.029
KURT -0.171 1.360 0.000 0.000 0.000 -1.573 -1.081 -0.338
38
Copyright © 2018. IJEMR. All Rights Reserved.
Table 3. The total concentration of PAHs(ng/l) of runoff water after first flash during the year 2014-15.
Table 4. The mean concentration of five PAHs of first flash and aftermath runoff water samples
Sl No Sampling
Code PHE BKF BAP BGHIP BAA/CHR FLT PYR ANT
1 RW 1 0.015 0.016 BDL BDL BDL 0.010 0.005 0.016 2 RW 2 0.007 0.008 BDL BDL BDL 0.008 0.019 0.021 3 RW 3 0.021 0.015 BDL BDL BDL 0.023 0.014 0.026 4 RW 4 0.032 0.016 BDL BDL BDL 0.012 0.007 0.021 5 RW 5 0.007 0.008 BDL BDL BDL 0.009 0.016 0.022
6 RW 6 0.039 0.005 BDL BDL BDL 0.023 0.017 0.033 7 RW 7 0.027 0.012 BDL BDL BDL 0.005 0.008 0.007 8 RW 8 0.024 0.022 BDL BDL BDL 0.019 0.017 0.031 9 RW 9 0.017 0.007 BDL BDL BDL 0.007 0.010 0.012 10 RW 10 0.024 0.024 BDL BDL BDL 0.014 0.009 0.024
11 RW 11 0.016 0.014 BDL BDL BDL 0.005 0.012 0.006 12 RW 12 0.043 0.025 BDL BDL BDL 0.027 0.032 0.040
MIN 0.007 0.005 0.000 0.000 0.000 0.005 0.005 0.006 MAX 0.043 0.025 0.000 0.000 0.000 0.027 0.032 0.040
MEAN 0.023 0.014 0.000 0.000 0.000 0.014 0.014 0.022 KURT -0.462 -1.053 0.000 0.000 0.000 -1.094 2.732 -0.454 SKEW 0.375 0.303 0.000 0.000 0.000 0.616 1.369 0.073
Sample PHE(ng/l) BKF(ng/l) FLT(ng/l) PYR(ng/l) ANT(ng/l)
First Flush Runoff Water Sample 0.030 0.025 0.020 0.026 0.029
39
Copyright © 2018. IJEMR. All Rights Reserved.
Fig 1. Base map of the study area
Fig 2. The comparison of mean concentration of five PAHs of runoff water samples of first flush and aftermath 0.000
0.005 0.010 0.015 0.020 0.025 0.030
First Flash Run off Water Sample