Licensed under Creative Common Page 1
http://ijecm.co.uk/
ISSN 2348 0386
DOES PROXY OF OPENNESS OR METHODOLOGY
MATTER TO HOLD ROMER’S HYPOTHESIS?
Ihtisham ul Haq
College of Economics and Trade, Hunan University, Changsha, Hunan, P. R. China [email protected]
Shujin Zhu
College of Economics and Trade,Hunan University, Changsha, Hunan, P. R. China
Muhammad Shafiq
Institute of Statistics and Mathematical Methods in Economics, Vienna University of Technology, Vienna, Austria
Alam Khan
Department of Economics, Faculty of Economics and Administration University of Malaya, Kuala Lumpur, Malaysia
Abstract
According to the Romer’s hypothesis a unidirectional inverse relation exists between trade
openness and inflation. The more opened economy resulting in less surprise inflation, in result
of increase in supply of money. In this study two models on the basis of two different indexes of
trade openness are established. The economic growth and supply of money worked as control
variables in these models. The results of ordinary least squares and generalized method of
moments (GMM) confirmed the Romer’s hypothesis for both indexes. However, Random effect model suggested new comprehensive index for Romer’s hypothesis over the traditional index.
On the other hand, Dynamic Least Square suggested that it is traditional index not the new
comprehensive index responsible to hold the Romer’s hypothesis. Thus, it cannot be claimed as
some empirical studies did that new index against traditional gives the desired results. It can be
concluded that methodology matters rather than proxy of openness.
Licensed under Creative Common Page 2
INTRODUCTION
The so-called Inflation is defined as a sustainable increase in the general price level in the economy over a period. High level of inflation is harmful to the economy, investment, and economic pace by making the economy uncompetitive. To keep inflation controlled, such monetary policies are required which maintain economic growth with price stability. Adopting discretionary or pre-specified monetary rules are considered hard issues for inflation in economics. Kydland and Prescott (1977) documented that high level of inflation is the result of discretion rather than well-defined rules. Therefore, monetary authorities should go for the monetary policy instead of discretion, even if its costs are high in short run as compare to discretionary policies.
The temporal consistency issue of monetary policy is mostly highlighted in theory, but more or less far behind in empirical studies. The main obstacle in empirical study is that certain economic variables are very complex to measure accurately. The relation between openness and inflation is one of the ways to check temporal consistency theory. The hypothesis put forward by Romer (1993) is that openness of an economy brings deflation. An unnecessary monetary expansion will cause real depreciation of currency and the economy will get “surprise” inflation. However trade openness will work as a check on this inflation. Further, he argued that negative association of inflation with openness is prevailed in more open economies.
In the developing countries significant proportion of the GDP is based on agriculture. Therefore, their imports or exports either in direct or indirect way are related to agricultural products. In trade intensity of the partner economy may persuade the domestic prices, therefore domestic producers will not only respond to domestic prices but to international as well. Some researchers like Sanyal (1996); Okun (1981); and Kalecki (1972), justified that open economies could reduce prices, because of small fluctuations in domestic farm sectors. However, Balakrishnan (1991) and Dantwala (1986) discussed domestic prices are related to the international market. Due to the open economy domestic price level will tend toward the international price either by increasing or decreasing. Thus net impact on the domestic price depends on overall effect of prices. Such factors could have important implications for inflation process in any economy. Thus more care is required to examine the influence of openness on the domestic inflationary dynamics in developing economies.
Licensed under Creative Common Page 3
European Economic Community. Their study confirmed an insignificant increase in inflation. On the other side, Kirkpatrick and Nixon (1973) alarmed that barriers to trade, especially import restrictions do not allow to get fruit of openness, especially in form of lower inflation.
Ashra (2002) described the channels of low inflation in following arguments; first, procurement of production domestically and internationally increases efficiency through low input cost. Second, it may be due to the better allocation of resources and enhanced capacity utilization. Last, enhancement in foreign direct investment may stimulate economic growth, and keeping the pressure on low price level. Evans (2007) argued that it is possible that an open economy receives inflation through raw material and manufactured imports. This positive impact of openness on inflation could be argued that monetary authorities could impose inflation, as a consumption tax, to balance the money growth. Besides this, monetary and fiscal authorities would lose control to keep check on inflation in open economy.
According to Cooke (2010) if the objective of monetary policy is only based on agents’ welfare then there is a chance to have negative association between openness and inflation. He also designed general equilibrium model for two-country case to analyze discretionary monetary policy. Furthermore, he pointed out that terms of trade depends on monopoly mark-ups, high openness degree, based on these terms monetary authorities could exploit short run Phillips curve. Thus, he concluded that high inflation may prevail even in more open economies. Also Kurihara (2013) discussed that international trade may positively influence economic growth but at the expense of inflation. Furthermore, he justified his statements by conducting an empirical study for Asia and OECD countries where trade openness was responsible for inflation.
Tauci et al. (2009) carried out panel study by for selected developing countries to examine the effect of openness on inflation. Results of their study showed that trade openness and economic growth has positive impact on inflation. Similarly, Mahmoudzadeh and Shadabi (2012) applied GMM to examine the nexus between openness and inflation for 15 selected countries of Middle East and North Africa for time period from 1996 to 2009. Their study also documented the positive association between openness and inflation.
Furthermore, time series studies conducted by Hanif and Batool (2006); Wynne and Kersting (2007); and Badinger (2009) reported significant inverse relationship between trade openness (i.e. export+imports/GDP) and inflation.
Licensed under Creative Common Page 4
Mukhtar (2010) examined the long-run relationship between openness and inflation over period 1960-2000. The cointegration technique was applied to find out long run relationship and vector error correction model was used for short-run and long-run causality. He concluded that there exist an inverse relationship between openness and inflation in Pakistan in the long-run. In the same manner Jafari et al. (2011) applied autoregressive distributed lag (ARDL) approach to test this relationship in Iran. This study pointed out a significant inverse relation between openness and inflation in the short run, while insignificant in the long-run.
Samimi et al. (2012) tested the relationship between openness and inflation by using both traditional and comprehensive Index; they came up with conclusion that the comprehensive index is better than the traditional one as the latter index is unable to hold inverse relation between inflation and openness. However, they did not apply ordinary least square (OLS) to assess this relationship as Romer (1993) did in his study. Similarly, Mahmoudzadeh and Shadabi (2012) considered trade freedom index of heritage foundation as measurement for openness and applied GMM instead of least squares method. Their result indicated a positive effect of openness on inflation.
It is worth mentioning in addition to traditional and comprehensive index and various econometric methodologies are required to test the discussed relationship. Thus, current study is aimed to consider both indices and also some econometric techniques like, ordinary least squares (OLS), generalized method of moments (GMM), panel random effects and dynamic ordinary least squares (DOLS) to investigate the relationship.
RESEARCH METHODOLOGY
Licensed under Creative Common Page 5
The model presented in equation (1) is specified for analysis, based on past literature.
𝐶𝑃𝐼 = 𝑓{𝐸𝐺, 𝑀𝑆, 𝑇𝑂} (1)
𝐶𝑃𝐼𝑖𝑡 = 𝑎1+ 𝑎2𝐸𝐺it+ 𝑎3𝑀𝑆it+ 𝑎4𝑇𝑂it+ eit (2)
i = 1,2,3, … … … , n; t = 1,2, … … . , T.
𝐶𝑃𝐼𝑖𝑡 = 𝑎1+ 𝑎2𝐸𝐺it+ 𝑎3𝑀𝑆it+ 𝑎4𝐾𝑂𝐹it+ eit (3)
i = 1,2,3, … … … , n; t = 1,2, … … . , T.
Whereas i and t denotes cross-sections and time respectively, and e is the error term.
Moreover, the two models mentioned in equation (2) and equation (3) are analyzed using OLS, GMM, DOLS and panel random effect estimation techniques. Model 1 and model 2 are differentiated on basis of traditional openness index (TO) and more comprehensive.
EMPIRICAL RESULTS AND DISCUSSION
Descriptive Statistics
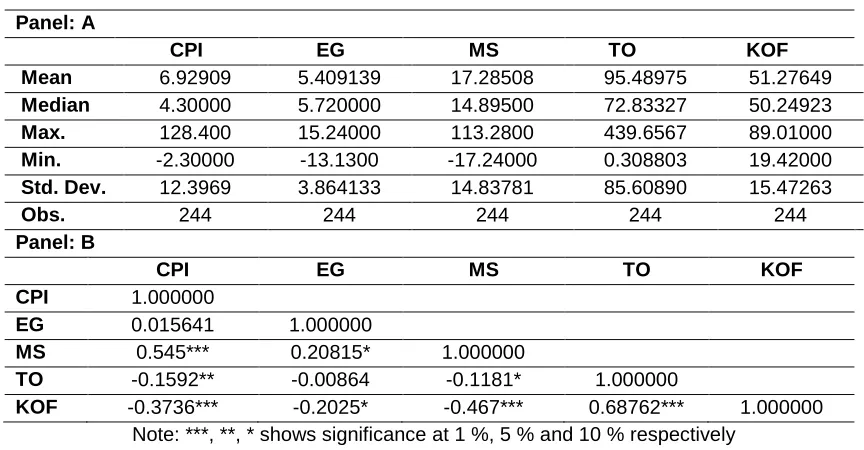
The descriptive statistics and correlation analysis are given in Panel (A) and Panel (B) of Table 1 respectively. All the variables are expressed in percentage except KOF index.
Table 1: Descriptive Statistics and Correlation Matrix Panel: A
CPI EG MS TO KOF
Mean 6.92909 5.409139 17.28508 95.48975 51.27649
Median 4.30000 5.720000 14.89500 72.83327 50.24923
Max. 128.400 15.24000 113.2800 439.6567 89.01000
Min. -2.30000 -13.1300 -17.24000 0.308803 19.42000
Std. Dev. 12.3969 3.864133 14.83781 85.60890 15.47263
Obs. 244 244 244 244 244
Panel: B
CPI EG MS TO KOF
CPI 1.000000
EG 0.015641 1.000000
MS 0.545*** 0.20815* 1.000000
TO -0.1592** -0.00864 -0.1181* 1.000000
KOF -0.3736*** -0.2025* -0.467*** 0.68762*** 1.000000
Note: ***, **, * shows significance at 1 %, 5 % and 10 % respectively
Licensed under Creative Common Page 6
85.61. Its minimum value is 0.3088 and maximum value is 439.656. The KOF index scale ranges from 1 to 100. Its minimum and maximum value is 19.420 and 89.010 respectively.
The correlation results provided in Panel (B) of Table 1, shows that economic growth and money supply growth are positively correlated with inflation, whereas trade openness and KOF index are negatively correlated with it. The correlation magnitude of money supply with inflation is high followed by KOF index and trade openness. The KOF index and trade openness is negatively correlation with economic growth and supply of money. Trade openness and KOF index are highly positive correlated with each other. The data for Brunei is from 2000 to 2010, for Myanmar it covers the period from 2000 to 2005 and for Sri Lanka it captures the period from 1998 to 2010. The rest of countries data period is from 1996 to 2010, thus making total numbers of observations equal to 244.
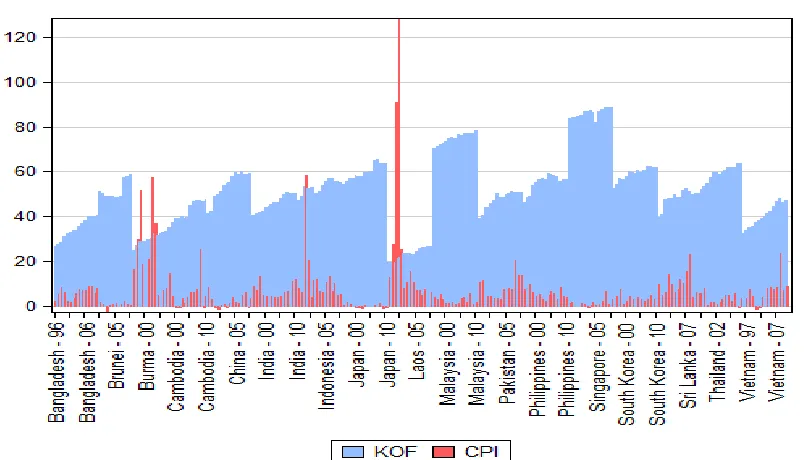
Trade Openness, KOF Index and Inflation
The traditional trade openness and KOF index is presented in Figure 1. Singapore among the selected sample of countries has more open economy followed by Malaysia. While Burma (Myanmar) has the least open economy as it trade openness is low among the sample countries. On the basis of KOF index, Burma, India, Japan, and Pakistan has more open economy as compare to rest of the world.
Figure 1: Trade openness and KOF Globalization Index
Licensed under Creative Common Page 7
the sample. However, Japan is the only exception to this criterion, Inflation remained in negative for some years in Japan.
Figure 2: Trade openness and Inflation
Inflation and KOF index relation is depicted in Figure 3. From this figure it can be simply concluded that high KOF index is inversely related to the inflation.
Licensed under Creative Common Page 8
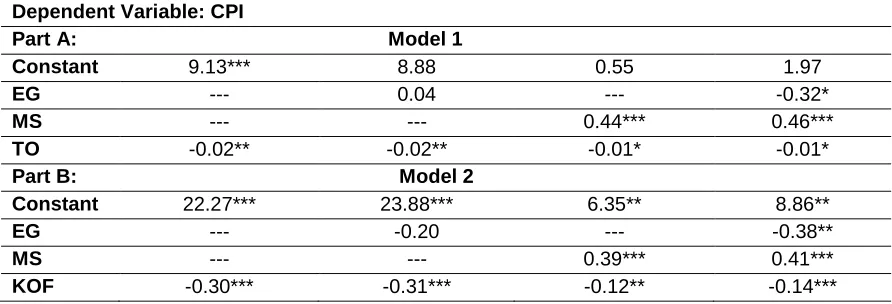
Results Estimates of OLS
The results estimates obtained from OLS for model (1) mentioned in equation (2) are presented in Part (A) of Table 2. First column shows the variable abbreviations i.e. (CPI) as inflation proxy, economic growth (EG), money supply (MS), traditional trade openness (TO), and Globalization index (KOF). In second column of the table coefficient of trade openness is negative and significant at five percent level of significance. After that, model was assessed by including control variables. First including economic growth as a control variable in the model and the results are presented in the second column. The inverse and significant relation between inflation and trade openness was observed. However, economic growth turned out insignificant factor of inflation.
Similarly, money growth is introduced as a single control variable instead of economic growth in the model and results are shown in the fourth column. The coefficient of trade openness carried the same negative sign but it is now significant at ten percent level of significance. The last column shows results based on both economic growth and money supply growth as control variables. The results showed significant negative association between inflation and trade openness. Economic growth has negative significant impact on inflation whereas money growth is highly significant with positive sign with inflation.
The OLS results for the model (2) mentioned in equation (3) in which KOF index is used as a proxy for trade openness is presented in Part (B) of Table (2). These results documented that the KOF coefficient is highly significant in the absence of any control variable with negative sign. The results remained same either economic growth or money supply or both worked as control variables. It can be seen in the second, third, fourth, and fifth column respectively in Part (B) of table (2). The economic growth and KOF index has significant negative impact on inflation whereas money supply is positively associated with inflation.
Licensed under Creative Common Page 9
Table 2: Ordinary Least Squares Estimations (OLS) Dependent Variable: CPI
Part A: Model 1
Constant 9.13*** 8.88*** 0.55 1.97
EG --- 0.04 --- -0.32*
MS --- --- 0.44*** 0.46***
TO -0.02** -0.02** -0.01* -0.01*
Part B: Model 2
Constant 22.28*** 23.88 6.35** 8.86***
EG --- -0.20 --- -0.38**
MS --- --- 0.39*** 0.41***
KOF -0.30*** -0.31*** -0.12** -0.14***
Note: ***, **, and * presents significance at 1%, 5% and 10% respectively
Results Estimates of Generalized Moment Method (GMM)
The results of GMM for both models mentioned in equations (2) and (3) are given in Table 3. These results are almost similar to the results obtained from the OLS for both models; however, the level of significance of traditional index is high in the outcome of model (1) without control variables. This can be observed from second column of Part (A) of Table 3. The coefficient of traditional trade openness is significant at 10 percent with negative sign like the results accomplished from OLS with the control variables. The results estimated through GMM for the new and comprehensive index of trade are presented in Part (B) of Table 3. These results also similar to the one obtain from the OLS for the KOF index.
Based on the OLS and GMM analysis it cannot be argued that new and comprehensive index as a proxy for openness works better than traditional proxy in holding the Romer’s hypothesis It has been observed that both proxy of trade openness carried the significant negative sign and has negative relationship with inflation.
Table 3: Generalized Method Moments Estimations Dependent Variable: CPI
Part A: Model 1
Constant 9.13*** 8.88 0.55 1.97
EG --- 0.04 --- -0.32*
MS --- --- 0.44*** 0.46***
TO -0.02** -0.02** -0.01* -0.01*
Part B: Model 2
Constant 22.27*** 23.88*** 6.35** 8.86**
EG --- -0.20 --- -0.38**
MS --- --- 0.39*** 0.41***
KOF -0.30*** -0.31*** -0.12** -0.14***
Licensed under Creative Common Page 10
Panel Random Effect Estimates
The estimated results of panel random effect are shown in Table 4. These results are different from the results obtained through the OLS and GMM. The traditional index of openness is not significant although it has the negative coefficient, irrespective of control variables.
The coefficient is negative and is highly significant when inflation is regressed only on the KOF index. In the presence of one or both control variables KOF has a significant inverse relationship with inflation. This implies that KOF supports Romer’s hypothesis over the traditional index on the basis of panel random effect estimation.
Table 4: Panel Random effects Dependent Variable: CPI
Model 1
Constant 8.27*** 10.77*** 0.77 2.80
EG --- -0.43** --- -0.38**
MS --- --- 0.42*** 0.42***
TO -0.01 -0.01 -0.01 -0.01
Model 2
Constant 21.7*** 24.79*** 6.15 9.22**
EG --- -0.42** --- -0.42**
MS --- --- 0.39*** 0.39***
KOF -0.29*** -0.30*** -0.12* -0.13*
Note: ***, **, and * presents significance at 1%, 5% and 10% respectively
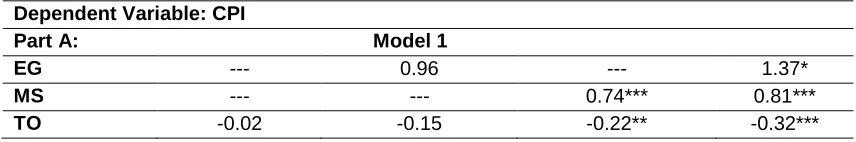
Dynamic Ordinary Least Squares Estimates (DOLSE)
The results obtained from dynamic least square are presented in Table 5. Based on DOLS estimates both traditional and KOF index are insignificant without taking control variables into account.
On the other hand in the presence of money supply as a control variable only traditional index gives significant inverse relationship. On the basis of both controlled variables again only traditional index performs well for Romer’s hypothesis. However, when all the three exploratory variables were included then KOF coefficient turned into positive although it is not statistically significant.
Table 5: Dynamic Least Square Estimates Dependent Variable: CPI
Part A: Model 1
EG --- 0.96 --- 1.37*
MS --- --- 0.74*** 0.81***
Licensed under Creative Common Page 11 Part B: Model 2
EG --- 0.23 --- -0.75
MS --- --- 0.46*** 0.75***
KOF -0.76 -0.76 -0.79 1.64
Note: ***, **, and * presents significance at 1%, 5% and 10% respectively
CONCLUSIONS
Recently some researchers argued that the comprehensive index (like KOF) as a proxy of openness works well to hold the negative association between openness and inflation. However, no one has focused on the econometric procedure that it may be methodology and not the proxy of openness that matters to have this relationship. The purpose of this study was to test whether proxy of openness or econometric methodology matters to get benefit in form of lesser inflation from the openness of the economy. This study testified Romer’s (1993) hypothesis for selected South Asia and South East Asia countries. The sample consists of 17 countries, four of which from South Asia (Bangladesh, India, Pakistan and Sri Lanka) and 13 from South-East Asia (Brunei, Cambodia, China, Indonesia, Japan, Lao, Malaysia, Myanmar, Philippines, Singapore, South Korea, Thailand and Vietnam). The countries in these two regions were selected due to the availability of data. The studied variables are economic growth, money supply growth, inflation rate and openness of the economies. Two proxies were considered to capture openness i.e. ratio of export plus imports to gross domestic product and KOF index calculated by KOF Swiss Economic Institute, Switzerland. This study covered the period from 1996 to 2010. Two models were specified (one with traditional index and other with KOF index) and four econometric techniques were applied for the analysis on basis of past literature.
The results of least squares (OLS) and GMM are almost same. It does not matter which proxy, traditional or new one, is used for openness the effect of openness on inflation is negative. The panel random effect preferred the KOF index over traditional index, whereas the DOLS suggested the superiority of the traditional over new index of openness. Thus, methodology matters more than proxy in case of the association between openness and inflation. The increase in money supply brought inflation while economic growth hindered it. It can be concluded that Romer’s hypothesis is hold in these selected Asian economies, it does not matter which proxy is used for openness in the analysis, but methodology does.
REFERENCES
Ashra, S. (2002). Inflation and openness: a case study of selected developing Economies. Indian Council of Research on International Economic Relations, Working Paper 84.
Badinger, H. (2009). Globalization, the output-inflation, tradeoff and inflation. European Economic Review, 53(8): 888-907.
Licensed under Creative Common Page 12 Balakrishnan, P. (1991). Pricing and Inflation in India. Oxford University Press, New Delhi.
Cooke, D. (2010). Openness and inflation. Journal of Money, Credit and Banking, 42 (2–3): 267–287.
Dantwala, M, L. (1986). Indian Agricultural Development since Independence. Oxford Press, New Delhi, India.
Dreher, A. (2006), Does Globalization Affect Growth? Evidence from a new Index of Globalization. Applied Economics,38(10): 1091-1110
Evans, Richard William, 2007, Is openness inflationary? Imperfect competition and monetary market power. Federal Reserve Bank of Dallas Globalization and Monetary Policy Institute. Working Paper No. 1. Granato, J., Lo, M., and Sunny, W, M.C. (2007). A note on Romer’s openness–inflation relation: the responsiveness of AS and AD to economic openness and monetary policy. Applied Economics, 39: 191–
197.
Hanif, M, N., and Batool, I (2006). Openness and inflation: a case study of Pakistan. MPRA Paper, No. 10214, University Library of Munich, Germany.
Kalecki, M. (1972). Selected Essays on the Economic Growth of the Socialist and the Mixed Economy. Cambridge University Press, London.
Kirkpatrick, C, H., and Nixon, F.I. (1973). Inflation and openness in less developed economies: a cross-country analysis: comment. Economic Development and Cultural Change, 26 (1):147–152.
Kurihara, Y. (2013). International Trade Openness and Inflation in Asia. Research in World Economy, 4(1), 70-75
Kydland, F, E., and Prescott, E, C. (1977). Rules rather than discretion: The inconsistency of optimal plans. Journal of Political Economy, 85: 473–492.
Mahmoudzadeh, M and Shadabi, L. (2012). Inflation and trade freedom: An empirical analysis. World Applied Sciences Journal, 18(2): 286-291.
Mukhtar, T. (2010). Does trade openness reduce inflation? Empirical evidence from Pakistan. The Lahore Journal of Economics, 15(2): 35–50.
Okun, A, M. (1981). Prices and Quantities: A Macroeconomic Analysis. The Brooking Institution. Washington, DC.
Rogoff, K. (1985). Can international monetary policy cooperation be counterproductive? Journal of International Economics,18:199–217.
Romer, D. (1993). Openness and inflation: theory and evidence. Quarterly Journal of Economics, 108(4): 869–903.
Samimi, A, J., Ghaderi, S., Hosseinzadeh, R.. and Nademi, Y. (2012). Openness and inflation:New empirical panel data evidence. Economics Letters, 117:573-577.
Sanyal, A. (1996). Access to credit and the inflation process in a developing economy. Journal of Post-Keynesian Economics, 18(4): 621-31.
Tauci, H. Mehmet, S. Çaøri Esener, and B. Darici (2009). The effects of openness on inflation: panel data estimates from selected developing countries. Investment Management and Financial Innovations, 6(4): 28-34
Triffin, R., Grudel, H. (1962). The adjustment mechanism to differential rates of monetary expansion among the countries of the European economic community. The Review of Economics and Statistics, 44: 486–491.
World Bank. (2012). World Development Indicators, CD Rom. Washington, DC.
Wynne, M, A., and Kersting, E, K. (2007). Openness and inflation. Staff Papers. Federal Reserve Bank of Dallas. No. 2.