http://www.sciencepublishinggroup.com/j/cbb doi: 10.11648/j.cbb.20180601.11
ISSN: 2330-8265 (Print); ISSN: 2330-8281 (Online)
An Object-Based Analysis of an Informatics Model for Zika
Virus Detection in Adults
Nwankwo Wilson Nnamdi
1, Chinecherem Umezuruike
21
College of Natural and Applied Sciences, Wellspring University, Benin City, Nigeria
2School of Computing and Information Technology, Kampala International University, Kampala, Uganda
Email address:
To cite this article:
Nwankwo Wilson Nnamdi, Chinecherem Umezuruike. An Object-Based Analysis of an Informatics Model for Zika Virus Detection in Adults. Computational Biology and Bioinformatics. Vol. 6, No. 1, 2018, pp. 1-20. doi: 10.11648/j.cbb.20180601.11
Received: February 19, 2018; Accepted: March 7, 2018; Published: March 27, 2018
Abstract:
Zika virus infection is a disease that may be misdiagnosed due to the semblance it shares with other arboviral diseases such as dengue, yellow fever, and Chikungunya. Till date it has been difficult to model a computerized solution for its detection owing to the foregoing characteristics. This paper is aimed at studying the prevalence and incidence of the virus in a bid to analyze and create an informatics model for its detection, diagnosis and management. To achieve its objective, the object-based analysis was employed. Data collection involved a descriptive synthesis of the laid down diagnostic procedures by the world health organization (WHO) and the orthodox medical practices in Nigeria. The result of the analysis generated specifications including a component model and analysis use cases that would be used to implement the developed model in the second part of this paper.Keywords: Zika Virus, Dengue Virus, Automated Diagnosis, Informatics, Informatics Model
1. Introduction
Zika Virus Disease (ZVD), a disease caused by a virus transmitted by specie of mosquitos known as Aedes, was first diagnosed in 1947 in Uganda, East Africa among primates and in 1952, the first human infection was reported in Uganda, Tanzania and Nigeria in 1954 [1]. With observed cases of neurological disorder and neonatal malformation in new born babies delivered by infected mothers and manifest symptoms similar to diseases like Dengue, Chikungunya, Yellow fever and Malaria that made it a bit difficult to diagnosis [1]. The outbreak of the disease in Brazil in 2015 swept the health sector off its feet and created awareness that some health situations could be threat to human existence. World Health Organization (WHO) declared it a Public Health Emergency of International Concern in February 2016, based on briefing by its emergency committee [2]. From 1947 to the 2015 outbreak, very little documentation exist [3]. The WHO had published an interim ZVD vector-borne geographic risk classification [4] framework based on the risk level of transmission of the virus. The
classification contained four categories [5] or areas of risks:
a. Area with new introduction or re-introduction with ongoing transmission
b. Area either with evidence of virus circulation before 2015 or area with ongoing transmission that is no longer in the new or reintroduction phase, but where there is no evidence of interruption
Area with interrupted transmission and with potential for future transmission (Historical evidence exists that in rare instances, Zika virus transmission may be interrupted after first introduction, but the potential for
re-introduction remains. Criteria for possible
interruption include geographic isolation of populations as occurs on small islands, temperate climate, and/or successful ongoing surveillance and control activities). c. Area with interrupted transmission and with potential
for future transmission
Zika virus in Nigeria
Zika virus Disease was reported in Nigeria first in 1954. There has also been evidence of antibodies to Zika virus in Nigerian populations, with no documented evidence of continued surveillance or periodic national surveys and referencing the WHO risk classification framework, Nigeria falls into the third category as defined by the classification [4]. Current study and analysis of the patterns, causes, effects on health and disease conditions of Zika in Nigeria has not been well documented or understood because Zika Has not been prevalent in Nigeria. The transmitting vector (Aeges Mosquito) is also responsible for other flavivirus infections such as yellow fever and dengue. Recorded environmental and human behavioural risk factors (Sexual activities, Travelling different geographical area) in areas with reported Zika outbreaks are similar to those found in Nigeria and would thus favour the circulation of Zika [1]. There are likely restrictions (inadequate diagnostic testing and the absence of systematic surveillance) to detection of transmission of Zika in Nigeria. Thus, the need for a system for prevention and early diagnosis became important. Consequently, work is to design and develop a Health informatics model for prevention and early diagnosis of Zika Virus Disease in Nigeria.
1.1. Statement of the Problem
Inadequate information among the population due to the non-prevalence of the Zika virus disease in the country contributed to lack of documented data on the study and analysis of the disease patterns [1]. Its vector (Aeges Mosquito) is also responsible for the transmission of other flavivirus infections such as yellow fever and dengue. Recorded environmental and human behavioural risk factors in areas with recent Zika outbreaks like Brazil are similar to those found in the Nigerian environment hence the likelihood of the outbreak of the disease anytime. In addition, inadequate diagnostic testing and the absence of systematic surveillance are also limitations which make diagnosis difficult hence the urgent need for an adequate preventive measure and early diagnosis.
1.2. Aim and Objectives of the Study
The aim of this study is to draw a careful analysis and design a fluid model with particular emphasis on prevention and early detection of Zika Virus Disease. The objectives of this paper are to:
a. Conduct a brief study of the ontology of Zika Virus Disease in order to understand the signs and symptoms as well as onset of the virus
b. Analyse the clinical activities of a selected health institution with the focus of constructing the best model that could effectively and efficiently support
disease prevention and early diagnosis, data
interchange, information exchange across various collaborating hospitals.
c. Develop a prototype support system with a database
that accommodates data analysis and mining for extensive decision making.
1.3. Significance of the Study
This paper will:
a. Provide concrete insights for policy making regarding Zika Virus diagnosis and management in Nigeria. b. Provide a clinical support model on Zika Virus disease
management for health professionals
2. Literature Review
The study of the prevalence of Zika virus dates back to 1947 in Uganda and spread within Africa in 1952 (Tanzania, Uganda), 1954 (Nigeria). From this 1954 until 2007 there was very little literature about the disease. The symptoms of Zika virus are related to most flavivirus diseases like Dengue, Yellow fever which include body rashes, mild fever, head ache, muscle pain it brings concern. The health cases evidenced in Brazil and linked to Zika Virus are Congenital Zika Syndrome and neurological disorder in children born by infected mothers. Zika Virus Disease/Fever has become a health concern of immediate community and have spread from east Africa to South America and spreading to other parts of the world due to human behavioural activities like travelling, sexual actions, blood transfusion, and bite from infected mosquitos. The role of information management and the integration of technology have enhanced productivity in various sectors. Disease management and outbreaks have been managed using technological advancements like Health Information Systems (HIS), Geographic information systems (GIS), etc. The knowledge of the disease will enhance the design and development of health systems that will further enhance information management, decision making and training in the concerned countries. Zika Virus Disease has mild symptoms similar to Dengue fever, Malaria, and presently has no vaccine for cure which makes it a great challenge. The resultant health challenge ranges from minor birth defects, to sever neuro malformation in new born babies which in rear cases develop to serious health issues in adults. It is prevalent more in South America, Caribbean, some parts of Asia and tropical Africa and can be spread by people travelling from infected areas to uninfected areas [4].
2.1. Incidence and Spread of Zika Virus
Indonesia in 1977 and 1978 confirmed that 3.1% of the patients had heavy Zika disease presence in their system [7]. There was barrenness of documentation within the span of 1983 to 2006 but in 2007 there was a great outbreak in Yap Island of Federated States of Monesia in the Western pacific though no deaths were reported [8]. The healthcare personnel had found it difficult to differentiate the outbreak from the known dengue due to the similar manifestations it presented such as: rash, fever, arthralgia and conjunctivitis. During the said outbreak, 146 persons out of every 1000 suspected cases had the infection [9]. In 2013, outbreak in French Polynesia identified an increase in neurological and autoimmune complication. Statistics shows that for every 1000 cases 2.3% had neurological complications, 1.3% had Guillain-Barre Syndrome [10]. In May 2015, Brazil was visited with the epidemic that made the disease a matter of international health challenge. In November of the same year, the Brazilian Health Ministry reported that there was no official count of infected persons. Cases reported in 14 states in Brazil transmission by Mosquito borne Zika virus was linked to 2400 cases of microcephaly and 29 infant deaths [11]. Serum samples from 24 exanthematic patients from Camaçari, Bahia, Brazil, were tested by RT-PCR and seven of them presented were confirmed for Zika Virus. In December 2015 Brazil reported autochthonous virus transmission [12]. Statistical research estimated that the number of suspected cases of ZIKV infection ranged from 440,000 to 1,300,000 by the end of 2015 [13]. Currently
there has been sporadic spread over 27 countries which include new Caledonia, Cook Island, Fiji, Samoa and Solomon Island. Philippians, japan, Australia, Italy, Germany, Norway, Canada, United States of America with people who visited from countries with local transmission (14). Deaths as a result of ZIKV are rare, however some deaths caused by ZIKV have been reported (3). Brazilian Health Official reported three cases of people died for ZIKV complication until May 2016; four deaths were reported in Colombia and three in Venezuela (15). It is submitted that when persons with ZIKV cases migrate to areas where there are active mosquitoes that such poses a risk of mass spread of the virus. Thus, ZIKV can rapidly spread to non-endemic areas throughout the world where the mosquito vector is present [16].
2.2. Laboratory Testing
With symptoms similar to other Flavivirus infections like dengue, Chikungunya, Yellow fever, diagnose using physical diagnosis is relatively difficult, hence, a laboratory test may be required to confirm Zika diagnosis. Specimen samples to be collected for laboratory testing are blood, urine, cerebrospinal fluid, amniotic fluid, semen and saliva. These tests were recommended by WHO [2] and as shown in Table 1 for ZikV infections. There are two major tests: Nucleic Acid Testing and Serology Immunoglobulin M (IgM) detection test.
Table 1. Recommended Laboratory test for diagnosis of Zika Virus [Source: WHO, 2017].
S/N Test Specimen Symptom Duration
1. Nucleic Acid Testing (NAT) testing Whole blood, Urine or Serum collected in dry test tube patients presenting with onset of symptoms ≤ 7 days
2. Serology Immunoglobulin M (IgM)
detection Whole blood collected in a dry tube and serum
patients presenting with onset of symptoms ≥ 7 days
2.3. Testing Algorithm
Testing algorithm is a sequential procedure for conducting a test to arrive at a more accurate diagnosis. The WHO has proposed the following algorithms based on the number of days of infection.
a. Testing algorithm for suspected cases of arbo-virus infection identified within seven days of onset of symptoms: Nucleic Acid Testing (NAT) such as RT-PCR is used to detect targets on the virus genome specific for Zika virus to confirm its presence. With similar symptoms with some other flaviviruses diseases it is suggested that Zika virus be tested
alongside Dengue and Chikungunya either
sequentially or in parallel, because in principle there may be co-infection of other arboviruses. Figure 1 illustrates this algorithm.
Figure 1. Testing algorithm for infection within 7 days of contact [Source: WHO].
Figure 2. Testing algorithm for patients with more than 7 days of onset of symptoms [source: WHO].
2.4. Zika Diagnosis
Diagnosis of Zika virus infection is mostly based on symptoms and the patient’s recent history of travel to an area with active Zika virus transmission. From a compilation of differential diagnosis by [17] for dengue, Chikungunya and Zika virus, a probable cause of Zika infection is arrived by
considering the symptoms: pruritic maculopapular
exanthema plus two of headache, fever, conjunctivitis,
myalgia, arthralgia or periarticular oedema whereas a confirmed case of Zika is established if there is the presence of viral RNA by real-time RT-PCR using serum samples taken in the first five days of onset of fever (low grade fever <38.5 degree celcius).
The patient has been in a Zika epidemic or endemic area during the two weeks prior to onset of the symptoms and presents an acute (sudden onset) exanthema (skin rash often pruriginous, maculopapular, and cephalocaudal often with sever itching) in addition to two or more of the following manifestations:
Fever, usually <38.5°C; nonpurulent conjunctivitis or conjunctival hyperemia; Arthralgia; Myalgia; Periarticular swelling; and occasional presence of neurological manifestations Further confirmation of Zika virus infection may be done through laboratory tests on blood or other body fluids, such as urine, saliva or semen. According to The American Centre for Disease Control and WHO [4], there are three laboratory tests that could be done to confirm a case viz: reverse transcriptase PCR (RT-PCR) in acutely ill patients; serology for the detection of specific IgM and IgG antibodies to Zika virus and plaque reduction neutralization test.
2.5. Clinical Informatics (CI) in the Detection and Diagnosis of Zika Virus
The role of clinical informatics is becoming increasingly important as there are advances in health care management and technology that comes handy in every aspect of patient care from patients’ first contact with clinical environment to patient bills. CI supports the processes involved in care by promoting flow of information among clinical care players (patients and clinical staff) and gives access to specific outcomes of care [19]. Information creation, knowledge creation and proper use of knowledge are the core concept of clinical informatics. This involves all data generated from interaction with patients are assembled and processed into information which gives direction to and prompt decision
making in the treatment and care of the patient [20].
2.5.1. Informatics Models and Decision Support Systems Ordinarily, models are diagrammatic representation of a system showing features and relationships between components of the proposed system. In essence, they are used to represent the concepts in the mind of the researcher, after reviewing existing models and arriving at an improved model to enhance a current situation. Currently models could go as far as representing a prototype of an information system. The later opinion on a model is held throughout this paper. Several models have been proposed by several researchers. This paper reviewed chronic care model, Extended Chronic Care model, MPM Functional Model and WHO Zika Virus Application.
2.5.2. Chronic Care Model
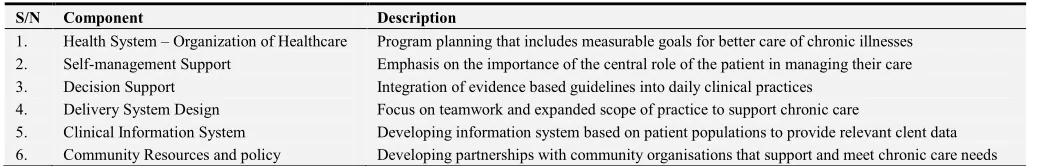
The rising prevalence of chronic diseases with its complicated care management was a concern to the health world. Managed care and integrated delivery institutions became interested and this lead to the development of Chronic Care model (CCM) by MacMoll centre of for health in 1990. The model was based on evidence and experience from care of patients with chronic health conditions like diabetes, Cancer, Stroke, and heart disease in the United States of America. The model was developed to improve chronic illness care, it consists six essential elements: Community resources; Health systems; Self- management support; Health system; Decision support; and Clinical information system. The components of the CCM are shown in Table 2. The goal of the model is to improve health outcomes [21] optimizing individual practice team interaction with patients but generally focused on physicians practice level.
Table 2. Components of a chronic care model.
S/N Component Description
1. Health System – Organization of Healthcare Program planning that includes measurable goals for better care of chronic illnesses 2. Self-management Support Emphasis on the importance of the central role of the patient in managing their care
3. Decision Support Integration of evidence based guidelines into daily clinical practices
4. Delivery System Design Focus on teamwork and expanded scope of practice to support chronic care
5. Clinical Information System Developing information system based on patient populations to provide relevant clent data 6. Community Resources and policy Developing partnerships with community organisations that support and meet chronic care needs
2.5.3. Expanded Chronic Care Model (ECCM)
The expanded chronic care model was developed as an expanded version of CCM and it is the first developed Canadian chronic care model. It emphasized the importance of community and interaction with the health care system. It incorporates a wider viewpoint of prevention in terms of reduction of risk of disease among individuals at high risk of developing diseases and broad initiatives to improve population health [22]. The expanded community component incorporated building healthy public policy, creating supportive environments, strengthening community actions as additional components. This model is an action driven model that focuses on health outcomes for individuals, communities and population. The model lacks integration of an evidence based treatment repository that will enhance
decision making, training and research.
2.5.4. MPM Functional Model
2.5.5. WHO Zika Virus App
This system is a mobile app designed and developed in 2016 for iphones and android mobile devices by the WHO. It is a real-time information system for the public on the Zika Virus. It is developed based on evidence and current statistics on the Zika outbreak transmission areas. It has three components: General information, health care workers, news. According to Maurer [24], the medical app is divided into three main components: general information, health care workers, and news. Each section is then divided into many sub-topics ranging from symptoms to transmission, prevention, etc. The healthcare worker section contains all of the WHO technical guidance on topics ranging from birth defect surveillance training to prevention of sexual transmission. The medical app contains numerous WHO graphics, PDF’s and videos along with the most current Zika news”. The app is a place of information for anyone interested in understanding of Zika Virus disease but it has limitaions. It is a plaudable development but has some flaws. These flaws are its limitations:
a. It is basically develpped for andriod phones and iphones.
b. It is an awareness application meant for physicians in transmission areas
c. Has prevention guidlianes as proposed by WHO but lacks management guidelines as regards to areas of high risks of reinffection
d. It does not integrate any logic for detecting probable cases of Zika virus infection prior to laboaratory tests. Based on thes limitations it is believed that a more robust and comprehensive model would be appropriate to take care of diagnosis, treatment nd management of the disease as well as predictions based on historical data.
3. Materials and Methods
This study is a proactive development research on Information systems (IS) and adoption of a methodical approach is based on the following rationale: Some experts have concluded that IS phenomena posed serious problems to traditional research approaches in the development of
scholarly knowledge since the traditional research
methodologies are incapable of explaining how individuals, groups, organizations, nations and society, can harness ICT to serve humanity [25]. Thus, IS researchers employing these approaches cannot provide full and satisfactory accounts of the success, failure, effectiveness, efficiency, freedom, and subjugation that occur in computing environments. The integration of system development into the research process, by multi-methodological approach that would include theory building, systems development, experimentation and observations was proposed [26]. IS design is deemed a class of research that would stand as an equal with traditional social science based theory building and testing [27]. The object-oriented approach employed in this paper decreases the “semantic gap” between the system and the real world even in complex environments, and enhances the
construction of terminology similar as that used by participants in everyday business.
3.1. Identification of the Needs/Requirements
In order to design a new system that would solve a problem, it is important to identify the needs of the users of the system. To achieve this, an object-based analysis was carried to afford an easy comprehension of the entire system so as to reveal the challenges and problems that are expected to be resolved by the proposed system. The results provided by the object-based analysis were used as the input for modeling the automated system
3.2. Building the Model
The basic operations involve modelling using the Unified modelling language and subsequent instantiation of the model to match the requirements of the present scenario. Modelling of the automated system is done at various levels: a. The structural level using component and class (object) diagrams, which include static structure definitions of components, classes and objects;
b. The system behaviour level (use cases and activity diagrams);
c. The user interface level, which include the design of the graphic user interface components and their relationships. The tools used for building the models are: Erwin data modeler (for data modelling and integration); Microsoft Visual studio (to support unified modelling language and program design); and MySQL Server DBMS, an open source versatile database java management system.
3.3. Analysis of the Current System
The current system for managing Zika virus infection and similar diseases in Nigerian public hospitals is the routine traditional approach that often does not involve the use of
computer-based information system for disease
identification. In any case, to understand how the system works (the behaviour); the hospital procedures are divided into subsystems and proper understanding of the various subsystems is required. To this end, the major subsystems in the patient-care domain were studied in order to detect where challenges (amenable to computerization) really exist. To achieve the foregoing, for each identified subsystem, the study specified the following:
i. Actors in the subsystem;
ii. Business process model (what happens in the
subsystem), using an activity diagrams;
iii.Use cases (what the participants i.e. hospital staff, are doing in the subsystem or what the they will be doing with the new subsystem);
iv.The interaction expressed as sequence of activities and collaboration (interaction among two or more classes or objects) using sequence and collaboration diagrams; v. Classification (classes of objects/entities, their attributes,
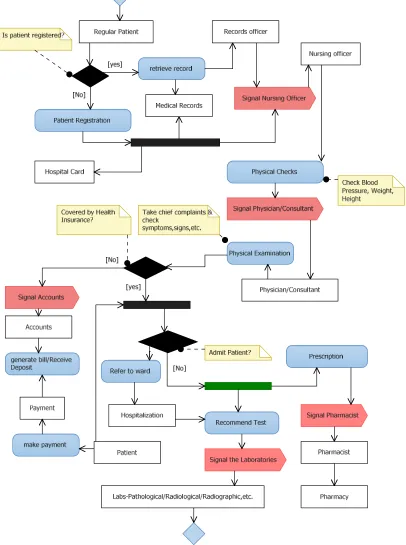
3.3.1. The Patient Registration Subsystem
Actors: The actors in this subsystem are: Patients, Records officers, and Nurses
The activity diagrams in Figures 4-5 include the activities in this subsystem. The record officers are responsible for registering and issuing a patient with appropriate outpatient
card also called an index or hospital card. A patient may present this card to the staff nurse who books the patient for consultation, that is, where the patient is a regular patient. The end product of this phase is the generation of a patient file and the issuance of a card containing the patient’s basic details i.e. registration number, surname, first name, etc.
Figure 4. Activity diagram showing commencement of care.
3.3.2. The Physical Examination Subsystem
The physical examination process is applicable to every patient. It is the next task chain from where data may be generated. This phase involved the conduct of physical checks and measurements such as: blood pressure, weight, etc. by nurses as well as the routine physical examination of the patient for relevant signs by the consultants/physicians. At this point, the physician independently or with the assistance of other medical personnel (nurses, doctors, etc.) may plan to commence treatment or may subject the patient to further investigation through a medical laboratory.
Actors: The actors in this subsystem are: Patients; Physicians; and Nurses.
3.3.3. The Laboratory/Diagnostic Subsystem
Laboratory investigation represents a host of activities
ranging from pathological, biochemical, histological,
radiological to radiographic investigations often requiring
experts in various fields. However, the type of laboratory
investigation dependson theresult ofphysicalexamination.
In some cases, no laboratory investigation may be
recommended.Thissubsystemisshowninfigure6.
Actors: The actors in this subsystem are: Patients; Nurses; Pathologists; Medical Laboratory Scientists; Radiographers; and Radiologists. The output of this phase is a test result. The test result may come in various physical forms such as: a text
paper document, graphics paper document, imaging on special surfaces, etc.
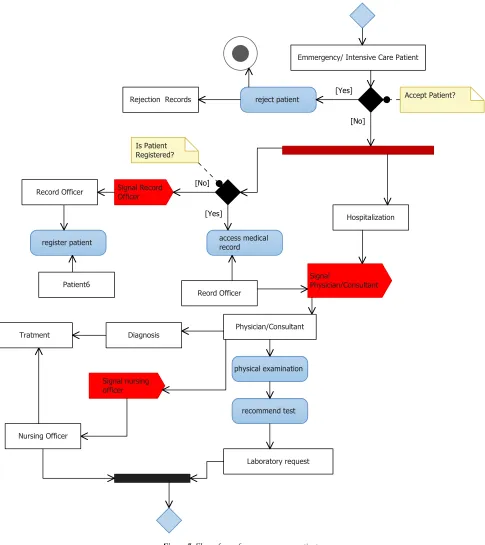
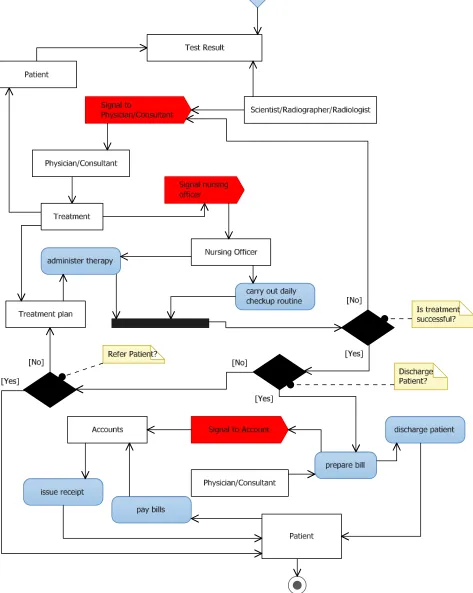
3.3.4. The Treatment/Prescription Subsystem
This subsystem has the following actors: Physicians;
Surgeons; Nurses; Patients; and Healthcare officers
(Physiotherapists, Pharmacists, Psychologists, Optometrists, etc.). The main objective of this subsystem is to ensure that a patient recovers from his/her ailment. The nature of treatment usually determines the actors that would be involved. For an emergency patient, the treatment cycle may follow a somewhat different pattern as shown in Figures 7-8 respectively.
3.3.5. The Intelligence/Decision Subsystem
Actors: The actors under this subsystem are: Consultants and Administrative officers.
3.3.6. Disease Management and Public Health Subsystem Like the intelligence subsystem, the disease management and public health subsystem may not be a concern of the patient undergoing treatment in the hospital but that which assists in the tracking of healthcare concerns that follow unusual pattern. For instance, an increase in the number of
patients having a particular health concern may be a signal to an epidemic. In a similar vein, the hospital also uses the subsystem in the detection, isolation and management of strange or unusual health conditions that are new in the facility. Tracking of such occurrences would help the hospital authorities to plan and implement appropriate actions to mitigate the challenges posed by these challenges.
Figure 7. Flow of care for an emergency patient.
Emmergency/ Intensive Care Patient
Signal
Physician/Consultant
Physician/Consultant
Hospitalization
recommend test
Laboratory request Tratment
Signal nursing officer
Signal Record Officer Record Officer
register patient
Patient6
Is Patient Registered?
Diagnosis
access medical record
Reord Officer
Accept Patient? reject patient
Rejection Records
physical examination
Nursing Officer
[No]
[Yes]
Figure 8. Activity diagram showing the tasks associated with an intensive care patient.
3.4. Analysis of the Automated Model
This is done through the use case diagrams. A use case is a functionality the users need from a system. In object-based
shows the relationships between the actors and use cases. When we say what an actor did (does), that's a use case. The associations between actors and use cases are represented with a solid line between them. The solid line shows that an actor is associated with the use case. Relationships may exist between different use cases. Two kinds of relationships have
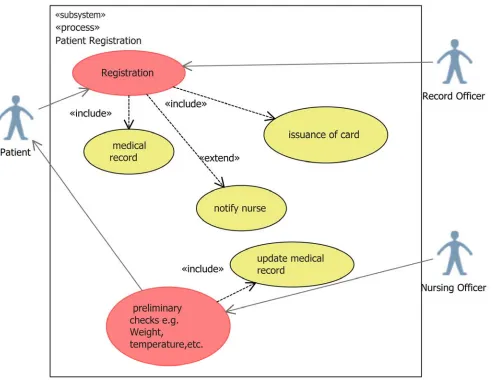
been identified. These are: ‘Include’, and ‘Extend’ relationships. The use case include is a directed relationship between two use cases which is often employed to show that behaviour of the included use case is to be part of the behaviour of the base use case. Figure 9 shows the use case diagram for the patient registration process.
Figure 9. Patient registration use case diagram.
Figure 10 shows the use case diagram for the physical examination subsystem. In this subsystem, the physician or consultant, during a physical examination on a patient would retrieve and update the patient’s medical record stored in the clinical database. In addition to the updates, the consultant/physician may notify other professionals such as laboratory scientists, radiographers, radiologists, etc. where further investigation into the cause of the ailment is required. The laboratory investigation (see Figure 9) is also seen as a subsystem in the clinical care cycle. The results of the tests could be fed into the software system regardless of the format in which it is produced. This is to afford a smooth integration of multimedia files generated from modern computerized laboratory equipment into the patient records.
Following laboratory investigation is the diagnosis and subsequent treatment. This subsystem is shown in Figure 12. Note that it is not all clinical care that would involve
unusual disease patterns, make forecast of spreads, etc.
Figure 10. Physical examination subsystem.
Figure 12. The Treatment subsystem.
The last phase of the patient care cycle is often the discharge or referral of a patient. This is also associated with the payment of bills by the patient. Figure 14 is a use case diagram that shows these activities. In each case the appropriate records must be created or updated. In addition, messaging is an important element in this phase like in other subsystems, and that is the essence of the use of signalling
between the various actors.
Figure 13. Disease control and Management use case diagram.
Table 3. The Analysis use case for Patient registration subsystem.
Use case name Registration of Patient
Description This use case reflects the procedure for registering new patients
Reference Figure 9
Course of
events Action of Actor Response from system
1: The patient or proxy pays the prescribed fees for issuance of outpatient card
2. The patient’s basic data are captured into the central database. 3. The system prints outpatient card
Alternate course
4. If the patient is an emergency patient the registration process may be deferred temporarily
Pre-condition Patient’s ailment must fall within the domain of care of the hospital Post-condition The records officer notifies the attendant Nurse for further actions
Assumptions None
Table 4. The Analysis use case for Physical examination subsystem.
Use case name Physical examination
Description Procedure for conducting physical examination on patients
Reference Figure 10
Course of events Action of Actor Inputs/Responses from system
1: Nurse takes preliminary measurements such as weight, blood pressure, etc. of patient. Patient is sent to consultant/physician
2: Physician/Consultant examines patient for vital signs and symptoms 3: Consultant orders a laboratory investigation where necessary
4: Measurements and results of physical examination are captured into the central database.
5: Laboratory orders are generated and alerts sent to the relevant laboratory personnel
Alternate course 6: Commence treatment/prescription if there is no immediate need for laboratory investigation
7: Prescription is created on system; System generates alert to the Pharmacist, Accounts respectively; Pharmacist dispenses drugs and updates patient’s record
Pre-condition The health insurance coverage of the patient must be checked to determine the range of care available to the patient
Post-condition The Consultant signals the laboratory specialist (s) or Pharmacist where prescription is given
Assumptions Patient is not under critical care
Table 5. The Analysis use case for Treatment subsystem.
Use case name Treatment/Prescription
Description This use case reflects the procedure for treating patients
Reference Figure 12
Course of events Action of Actor Inputs/Responses from system
2: Physician/Consultant and other care personnel examines lab results and effect diagnosis on patient in the consulting room or in the surgical theatre
4: Consultant books patient for surgery at a scheduled date; 6: Physician/Consultant and Nurses carry out surgical therapy; Move patient to the ward for monitoring and recovery
9: Physician/Nurse reviews periodic recovery status of patient; Modify treatment regimen where necessary; Specify further investigation where relevant. Signal the appropriate personnel; Treatment cycle continues till patient is certified ok.
1: Results of laboratory investigation are displayed on the system
3: Results of diagnosis is sent to the system
5: Surgical treatment schedules are created for patient. Resources for surgery identified, assigned on the system. Messages sent to personnel
7: State of patient after surgery is fed into the system 8: Monitoring schedule for patient is created including routine therapy
10: Therapeutic regimen success/failure recorded
Alternate course
11: Consultant/Physician prescribes appropriate therapy; Signal pharmacist and Accounts unit; Pharmacist dispenses the prescription to the patient; Accounts is informed of the patient’s bill.
12: Prescription is created on system; System generates alert to the Pharmacist, Accounts respectively; Pharmacist dispenses drugs and updates patient’s record
Pre-condition The health insurance coverage of the patient must be checked to determine the range of care available to the patient
Post-condition
Table 6. The Analysis use case for Discharge/Billing subsystem.
Use case name Discharge/Billing
Description This use case reflects the tasks associated with Discharge and Billing
Reference Figure 14
Course of events Action of Actor Inputs/Responses from system
2: Physician/Consultant certifies health of patient where there is marked therapeutic success; updates patient’s bill; discharges patient; signals Accounts and Pharmacy respectively 4: Patient pays bills;
5: Account officer receives and confirms payment from patient; 6: Patient picks up prescribed drugs from Pharmacist (where necessary)
1: System displays details of patient including resources consumed, health status, etc.
3: Therapeutic regimen success/failure record updates; System generates Patient’s bill; Patient’s treatment file is updated and closed; Alerts are generated for Accounts & Pharmacy units respectively
7: Prescription and Accounts records of patient are updated and finalized.
Alternate course 8: Physician/Consultant places patient on referral (where facility cannot continue with treatment);
9: Referral record is updated; Bill is paid and financial record of patient is updated;
10: Treatment case records update with therapeutic failure
Pre-condition The health insurance coverage of the patient must be checked to determine the range of care available to the patient
Post-condition
The Consultant/Physician signals Accounts unit and Pharmacist respectively; Patient picks his/her maintenance medications and quits the facility
Assumptions None
Table 7. The Analysis use case for Disease control and management subsystem.
Use case name Disease control and Intelligence
Description This use case reflects the tasks associated with intelligence gathering and research
Reference Figure 13
Course of events Action of Actor Inputs/Responses from system
2: Medical researcher/Epidemiologist mines disease patterns and trends; makes forecasts as to resources needed to manage the spread of diseases
1: System displays disease frequencies and histories. 2: System presents therapeutic cure profiles for selected diseases
Alternate course None
Pre-condition Consolidation of therapeutic profiles and disease history databases Post-condition Researcher notifies the appropriate authorities on findings
Assumptions None
Table 8. The Analysis use case for Laboratory investigation subsystem.
Use case name Laboratory investigation
Description This use case reflects the tasks associated with laboratory investigation
Reference Figure 11
Course of events Action of Actor Inputs/Responses from system
2: Laboratory personnel performs test on patient or with samples where necessary
1: System displays laboratory requests from Physician/Consultants 3: Results of laboratory investigations are captured on the system; Alerts are generated.
Alternate course 4: Patient is referred to external service facility for the conduct of tests
5: Updates are made to the laboratory requests regarding use of external facilities;
6: Patient returns results to relevant department for system conversion; alerts are generated.
Pre-condition Physical examination completed
Post-condition Alerts are generated to signal Consultants/Physicians
Assumptions None
3.5. The Automated Zika Virus Disease Care Model (ZikaSol Model)
The automated model, a network-ready application
maintainability and extensibility [see figure 15). Each user of the system would be granted relevant privileges based on defined roles. It incorporates a business logic that is based on the rules of identifying a probable case of Zika virus based on the major signs and symptoms of the infection. All patient care actions would be routed to the central database; histories
such as resources, therapeutic cure/failure profiles, disease histories, etc. would be extracted, transformed and loaded periodically to the data mart. The high-level model of the proposed system is presented in using the component model diagram. It is composed of four interconnected subsystems: Front end, Operational database, and a Data mart.
Figure 15. Component Model of ZikaSol model.
4. Conclusion
The main objective of this paper is to evolve a brief but concrete computerized model that would be useful for detecting the Zika Virus infection in adult members of the society. In order to achieve this, the WHO specifications and provisions [18] were duly analysed as to determine the various signs and symptoms that are considered important in the preliminary diagnosis of Zika virus as well as the various clinical procedures that are followed. The analysis covered the various events that take place from the visit of the supposedly infected patient to a health facility to case history taking, diagnosis, treatment (where possible), discharge and billing to medical intelligence (information gathering from
References
[1] Nigeria Centre for Disease Control (2016) Public Health Risk Assessment of Zika Virus in Nigeria and Interim recommendations. Abuja, Nigeria: Nigeria Centre for Disease Control, Nigeria, Federal Ministry of Health, National Health Promotion Policy Draft.
[2] World Health Organization (2016) "WHO Director-General summarizes the outcome of the Emergency Committee regarding clusters of microcephaly and Guillain-Barré syndrome" [online]. Available at:
http://www.who.int/mediacentre/news/statements/2016/emerg ency-committee-Zika-microcephaly/en/ [Accessed 10 February 2016].
[3] Paixão, E. S., Barreto, F., Teixeira, M. G., Costa M. C., and Rodrigues L. C. (2016) "History, Epidemiology, and Clinical Manifestations of Zika: A Systematic Review.", American journal of Public Health, Vol. 106, Issue 4, pp 106-112. doi: 10.2105/AJPH.2016.303112.
[4] World Health Organization (2017) "Zika virus country classification scheme" [online]. Available
at:http://apps.who.int/iris/bitstream/10665/254619/1/WHO-ZIKV-SUR-17.1-eng.pdf?ua=1 [Accessed 17 February 2018].
[5] Centres for Disease Control and Prevention (2016) "Country Classification Technical Guidance" [online]. Available at: https://wwwnc.cdc.gov/travel/page/Zika-country-classification [Accessed 17 February 2018].
[6] FAGBAMI, A. H. (1979) "Zika virus infections in Nigeria: virological and seroepidemiological investigations in Oyo State", Journal of Hygience, Vol. 83, No. 2, London.
[7] Olson, J. G., Ksiazek, T. G., Suhandiman, & Triwibowo (1981) "Zika virus, a cause of fever in Central Java, Indonesia", Trans R Soc Tropical Medicine Hygiene, Vol. 75, Issue 3: pp 389-393.
[8] Ramzy, A. (2016) "Experts Study Zika’s Path From First Outbreak in Pacific" [online], New york times: Available at: https://www.nytimes.com/2016/02/11/world/asia/Zika-virus-yap-island.html.
[9] Duffy M. R. et al (2009) "Zika virus outbreak on Yap Island, Federated States of Micronesia", New England Journal of Medicine, Vol. 360, Issue 24, pp 536-43. doi: 10.1056/NEJMoa0805715.
[10] Blázquez, A. and Saiz, J. (2016) "Neurological manifestations of Zika virus infection", World Journal of Virology, Vol. 5, No.4, pp 135–143. doi: 10.5501/wjv.v5.i4.135.
[11] European Centre for Disease Control (2016) "Zika virus infection from 2014 onwards"[online]. Available at: https://ecdc.europa.eu/en/Zika-virus-infection.
[12] Hennessey, M., Fischer, M., Staples, J. E. (2016) "Zika virus spreads to new areas-region of the Americas", Morbidity and Mortality Weekly Report.
[13] Salvador, F. S., and Fujita, D. M. (2016) "Entry routes for Zika virus in Brazil after 2014 World Cup: new possibilities", Travel Medicine and Infectious Disease Journal, Vol. 14, pp 49-51.
[14] Goorhuis, A., Eije KJ von, Douma, R. A. (2016) "Zika virus and the risk of imported infection in returned travelers: implications for clinical care", Travel Medicine and Infectious
Disease Journal, Vol. 14, pp 13-15.
[15] Pan American Health Organization/World Health
Organization (2016). "Regional Zika Epidemiological Update (Americas)" [online]. Available at
http://www.paho.org/hq/index.php?option=com_content&vie w=article&id=11599&Itemid=41691.
[16] Zammarchi, L., Stella, G. and Mantella, A. (2016) "Zika virus infections imported to Italy: clinical, immunological and virological findings, and public health implications", Journal of Clinical Virology, Vol. 63, pp 32-35.
[17] Beltrán-Silva, S. L., Chacón-Hernández, S. S., Moreno-Palacios, E. and Pereyra-Molina, J. A. (2016) "Clinical and differential diagnosis: Dengue, Chikungunya and Zika", Rev Med Hosp Gen Méx.
http://dx.doi.org/10.1016/j.hgmx.2016.09.011.
[18] Pan American Health organization /World health Organization (2017) "TOOL FOR THE DIAGNOSIS AND CARE OF PATIENTS WITH SUSPECTED ARBOVIRAL DISEASES", Pan American Sanitary Bureau, Regional Offce of the World Health Organization Washington, D. C.
[19] JDemiris, G. et al (2008) "Patient-centered Applications: Use of Information Technology to Promote Disease Management and Wellness. A White Paper by the AMIA Knowledge in Motion Working Group", Journal of the American Medical Informatics Association, Vol 15 (1): pp 8–13. doi: 10.1197/jamia. M2492.
[20] Berner, E. S.; Tonya J. L. (2007) Clinical Decision Support Systems: Theory and Practice (2nd ed.), New York: Springer Science and Business Media.
[21] Wagner E. H., Austin, B. T., Von Korff M. (1996) "Improving outcomes in chronic illness", Managed Care Quarterly, Vol. 4, No. 2, pp 12-25.
[22] Barr, V. J., Robinson, S., Marin-Link, B., Underhill, L., Dotts, A., Ravensdale, D., et al. (2003). The Expanded Chronic Care Model: An integration of concepts and strategies: from population health promotion and the Chronic Care Model. Hospital Quarterly, Vol. 7, pp 73-82. [Online]. Available at: http://blogs.usask.ca/SHORE/Chronic%20Care%20Model.pdf
[23] Riaño, D., Bohada, J. A., Collado, A, López-Vallverdú, J. A. (2013) "MPM: A knowledge-based functional model of medical practice", Journal of Biomedical Informatics, Vol. 46, Issue 3, pp 379-87. doi: 10.1016/j.jbi.2013.01.007.
[24] Maurer, D. (2016, March 20). World Health Organization launches Zika app for physicians and health workers [online]. Available at: https://www.imedicalapps.com/2016/03/world-health-organization-Zika-app/.
[25] Lee, A. S. & Liebenau, J. (1997). "Information systems and Qualitative Research", Iinternational conference on
Information systems and qualitative research, pp. 1-8, London, UK: Chapman & Hall, Ltd. Available at:
http://www.people.vcu.edu/~aslee/ifipwg82.pdf.
[26] Nunamaker, J. F., Chen, M., and Purdin, T. D. M. (1991). "Systems Development in Information Systems Research", Journal of Management Information Systems, Vol. 7, Issue 1, pp 89-106.
![Table 1. Recommended Laboratory test for diagnosis of Zika Virus [Source: WHO, 2017].](https://thumb-us.123doks.com/thumbv2/123dok_us/9538731.1482971/3.595.33.558.444.505/table-recommended-laboratory-test-diagnosis-zika-virus-source.webp)
![Figure 1. Testing algorithm for infection within 7 days of contact [Source: WHO].](https://thumb-us.123doks.com/thumbv2/123dok_us/9538731.1482971/4.595.85.515.332.617/figure-testing-algorithm-infection-days-contact-source.webp)
![Figure 3. MPM Functional Model [Source: Riano et al, 2013].](https://thumb-us.123doks.com/thumbv2/123dok_us/9538731.1482971/6.595.99.493.82.740/figure-mpm-functional-model-source-riano-et-al.webp)