T
Th
he
er
ra
a
no
n
os
st
ti
ic
cs
s
2019; 9(2): 491-525. doi: 10.7150/thno.29875
Review
Recent Progress on Liquid Biopsy Analysis using
Surface-Enhanced Raman Spectroscopy
Yuying Zhang, Xue Mi, Xiaoyue Tan, Rong Xiang
School of Medicine, State Key Laboratory of Medicinal Chemical Biology, Key Laboratory of Bioactive Materials for Ministry of Education, Nankai University, 300071 Tianjin, China
Corresponding author: Dr. Yuying Zhang, Medical School of Nankai University, 94 Weijin Road, 300071 Tianjin, China. Email: [email protected]
© Ivyspring International Publisher. This is an open access article distributed under the terms of the Creative Commons Attribution (CC BY-NC) license (https://creativecommons.org/licenses/by-nc/4.0/). See http://ivyspring.com/terms for full terms and conditions.
Received: 2018.09.11; Accepted: 2018.11.30; Published: 2019.01.01
Abstract
Traditional tissue biopsy is limited in understanding heterogeneity and dynamic evolution of tumors. Instead, analyzing circulating cancer markers in various body fluids, commonly referred to as “liquid biopsy”, has recently attracted remarkable interest for their great potential to be applied in non-invasive early cancer screening, tumor progression monitoring and therapy response assessment. Among the various approaches developed for liquid biopsy analysis, surface-enhanced Raman spectroscopy (SERS) has emerged as one of the most powerful techniques based on its high sensitivity, specificity, tremendous spectral multiplexing capacity for simultaneous target detection, as well as its unique capability for obtaining intrinsic fingerprint spectra of biomolecules. In this review, we will first briefly explain the mechanism of SERS, and then introduce recently reported SERS-based techniques for detection of circulating cancer markers including circulating tumor cells, exosomes, circulating tumor DNAs, microRNAs and cancer-related proteins. Cancer diagnosis based on SERS analysis of bulk body fluids will also be included. In the end, we will summarize the “state of the art” technologies of SERS-based platforms and discuss the challenges of translating them into clinical settings.
Key words: liquid biopsy, surface-enhanced Raman spectroscopy, circulating tumor cell, exosome, circulating tumor DNA
Introduction
Molecular and cellular heterogeneity represent one of the greatest challenges in cancer diagnosis and therapy. The molecular landscapes of metastatic lesions might be varied from the primary tumor tissue, and the genome profile within a tumor also evolves dynamically over time [1]. Traditional tissue biopsy obtained by collecting a portion of cells from the tumor site reflects only a single snapshot of a small region, and therefore is inadequate for comprehensive characterization and tracking of a patient’s tumor [2]. In the last few years, detection of tumor-derived components in body fluids (blood, urine, saliva, ascites, cerebrospinal fluid, etc.), commonly referred to as “liquid biopsy”, has been getting enormous attention in both medical research and clinic applications [3-5]. Compared to tissue
biopsy, which is invasive and cannot be repeatedly performed, liquid biopsy enables physicians to non-invasively interrogate the dynamic evolution of tumors and monitor patients’ response to therapeutic treatments in real time [6].
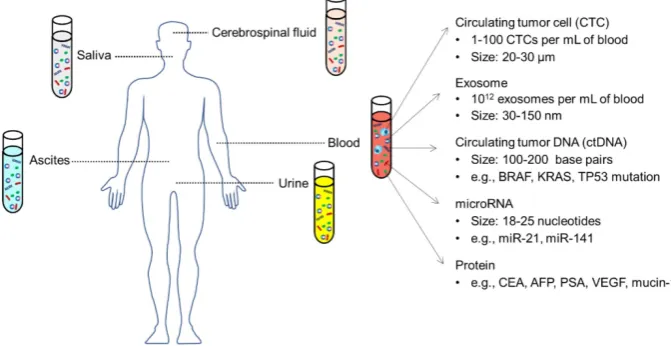
Plenty of substances from liquid biopsies have been found to be closely related to tumor stage and might serve as new biomarkers for cancer diagnosis/ prognosis (Figure 1), including circulating tumor cells (CTCs), exosomes, circulating tumor DNAs (ctDNAs), and non-coding microRNAs (miRNAs), alongside a series of cancer-related proteins [6, 7]. Tumor cells that shed from solid tumor sites and enter the circulatory system are called CTCs. In the past two decades, many studies have confirmed that CTCs are present in the blood stream at very early stages of
Ivyspring
cancer and play a major role in tumor metastasis [8]. CTCs represent the molecular characteristics of the corresponding tumor tissue and have been validated as prognostic markers for patients with metastatic breast, colorectal and prostate cancer in the clinic [9]. More recent studies have found that tumor cells excrete a large number of extracellular vesicles (EVs) into their mircoenvironment and use them for cell-cell communication [10]. EVs in body fluids, in particular exosomes (a subset of EVs with a size of 30-150 nm), contain proteins, lipids and nucleic acids inherited from the parental tumors cells and hold great promise to be used as novel diagnostic/prognostic markers [11-13]. In addition to complete cells or cell fragments, the tumor’s genetic content can also be found in the circulating cell-free nucleic acids. Circulating tumor DNA (ctDNA) that derive from apoptotic/necrotic neoplastic cells or lysed CTCs represent genomic profiles closely related to tumor burden, intratumoral heterogeneity, therapy responses and resistance [14]. Non-coding microRNAs (miRNAs), which regulate gene expression, also exist in various biological fluids and distinct levels of circulating miRNAs might reflect the progress of cancer [15, 16]. Additionally, increased amounts of several kinds of proteins in the blood, such as prostate-specific antigen (PSA), carcino-embryonic antigen (CEA) and a series of carbohydrate antigens, have been found to be positively related to tumor stages [17].
Despite the growing interest in biomarkers in liquid biopsy, establishing sensitive and reliable detection methods for clinical applications remains challenging due to the complexity of biological samples as well as the extremely low concentration of the analytes [18, 19]. In recent years, optical sensors based on surface-enhanced Raman spectroscopy (SERS) have emerged as one of the most powerful techniques in biological and biomedical analysis
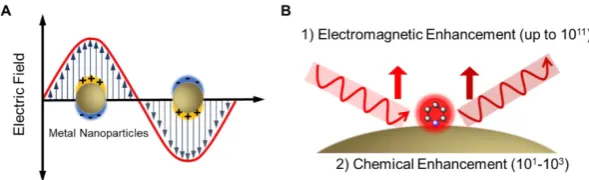
[20-22]. Raman spectroscopy provides fingerprint vibrational spectra of molecules and allows individual components in a mixture to be identified. However, Raman signals are usually weak due to the very low ratio of inelastic scattering events (approximately one in 106 photons being inelastically scattered) [23]. In the 1970s, Fleischmann et al. [24] and Van Duyne et al. [25] found that Raman signals can be significantly enhanced when molecules are adsorbed on a roughened metal surface. The enhancement factor can be a million-fold and enables detection of a monolayer species on a metal surface, leading to the initial establishment of the SERS technique. In 1997, two research groups independently reported single molecule/single nanoparticle SERS, where the enhancement factors were estimated to be as high as 1014 [26, 27]. Among the various mechanisms propo-sed to explain SERS in recent years, electromagnetic enhancement (EM) and chemical enhancement (CM) are the most widely accepted [20, 28] (Figure 2). In the EM mechanism, the interaction between electromag-netic waves with plasmonic (typically Au and Ag) nanostructures with dimensions much smaller than the wavelength induces collective oscillation of free electrons on the metal surface. When the frequency of the incident light matches the inherent oscillation frequency of free electrons in the metal, localized surface plasmons resonance (LSPR) occurs and leads to an enhancement in the incident optical field (Figure 2A). The CM arises from the charge transfer resonance between the reporter molecule and the nanostructure, requiring direct adsorption or chemical binding of the molecule on the metal surface, and is usually weaker than the EM [20]. In SERS (Figure 2B), the high local optical field induced by resonances between incident /scattered light and surface plasmons on the metal nanostructures provides more than 10 orders of magnitude signal enhancement (by EM); in addition,
an enhancement factor of 101-103 is contributed by the CM. As a result, SERS combines the structural specificity and experimental flexibility of conventional Raman spectrosc-opy with the ultrahigh sensitiv-ity provided by the plasmonic nanostructure- mediated signal amplification, making it a desirable technique for analysis of biomedical samples [29].
The rational design of plasmonic nanostructures with defined physicochemical prop-erties is essential for SERS. In general, two platforms are
commonly used as SERS-active substrates: periodic
2D nanostructures (Figure 3A), and colloidal
nanoparticles (NPs) in solution (Figure 3B) [20]. Controlled deposition and lithographic/ template synthesis techniques are routinely used in the fabrication of nanostructured 2D surfaces due to the high level of reproducibility. For colloidal NPs, quasi-spherical NPs, anisotropic NPs, and NP clusters including aggregates and assemblies of NPs have been extensively synthesized and employed as SERS substrates [30]. Their optical properties strongly depend on the size, shape and composition of the NPs, and adjusting the LSPR peak into resonance with the incident laser wavelength is usually beneficial for enhanced optical field and optimized SERS signals.
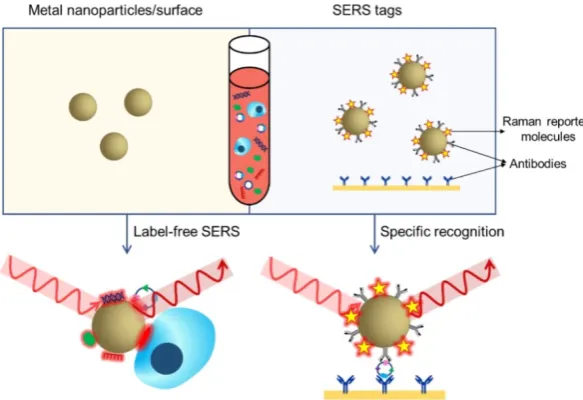
Two methodologies are mainly adopted in biomedical applications of SERS: label-free detection and indirect detection using SERS tags [20]. In label-free SERS detection (Figure 4, left), samples for analysis directly adsorb to the surface of metallic nanostructures and intrinsic fingerprint spectra of the biomolecules are obtained. Complex spectral analysis is usually a prerequisite to interpret the spectral information for discriminating biomolecules at differ-ent status or cells/microorganisms of differdiffer-ent species
[31, 32]. SERS tags (Figure 4, right) are typically composed of metallic NPs coated with Raman reporter molecules emitting strong and distinct Raman signals. By conjugating specific recognition molecules such as antibodies or aptamers, SERS tags can be used as optical labelling tools for indirect sensing/imaging of the target biomolecules in vitro
and in vivo [30, 33-35]. Compared to traditional external labelling reagents like organic dyes or fluorophores, SERS tags offer advantages such as ultrasensitivity, tremendous multiplexing capacity, high photostability, the need of only a single laser to excite all SERS labels and minimized interference by autofluorescence from cells/tissues [20, 23]. In the past decade, both label-free SERS detection and SERS tags have been increasingly applied to liquid biopsy analysis, providing qualitative and quantitative information for cancer diagnosis, prognosis, and real-time monitoring of therapy response. In this review, we will summarize recent progress in the use of SERS for detection of CTCs, extracellular EVs, ctDNAs, miRNAs, cancer-related proteins, as well as bulk body fluids, and discuss the opportunities for developing new generation SERS-based platforms and the challenges of translating them to clinical
settings. About the physical fundamentals of SERS, the rational design and optimization of SERS substrates, and the other broad applications of SERS-based techniques, we highly recommend several excellent reviews on the corresponding topics [20, 23, 28-30, 36, 37].
CTCs
The presence of CTCs in the blood of cancer patients was first discovered by Dr. Ashworth in 1869. However, little research was performed in the following years on CTCs due to their extraordinary rarity in blood vessels (1-100 CTCs amongst 5 billion erythro-cytes and 10 million leukoerythro-cytes) [8, 38]. With the development of new enrichment and detection techniques, CTCs have been increasingly studied since the mid-1990s and gained enormous attention for their clinical value to predict disease progression and survival in metastases [39, 40]. Numerous studies have confirmed that CTCs might be used as prognostic markers for breast, colorectal and prostate cancer; i.e., higher CTCs numbers correlate with increased
Figure 2.(A) Illustration of the collective oscillation of free electrons in metal nanoparticles upon excitation by an electromagnetic wave. (B) Illustration of electromagnetic enhancement and chemical enhancement in SERS.
metastasis and lower survival rates. In addition, recent studies have found that CTCs enter the blood stream at an unexpectedly early stage, even before malignancy could be detected, indicating the potential of CTCs to be used as noninvasive markers for early cancer diagnosis [41]. Furthermore, phenotype identification and molecular analysis of CTCs are expected to offer more insights into the understanding of tumor metastasis and guide therapeutic management.
Current techniques for CTCs detection
In the past twenty years, a variety of technolo-gies have been set up to separate and identify CTCs based on their unique physical and/or biological properties that are distinct from hematological cells. For example, ISET (isolation by size of epithelial tumor cells, Rarecells Inc.) discriminates CTCs by filtration through an 8 μm porous membrane due to the larger size of CTCs (20-30 μm) relative to hematologic cells. ApoStream (ApoCell) isolates CTCs based on the assumption that cancer cells have a more negative surface charge than hematologic cells. CellSearch (Janssen Diagnostics) is the first and currently only FDA-approved system for clinical automated CTC detection in breast, colorectal and prostate cancer patients. In this assay, putative CTCs are selected using magnetic beads modified with anti-epithelial cell adhesion molecule (EpCAM) antibodies, and then enumerated based on subsequ-ent immunostaining results (cytokeratin+/DAPI+/ CD45-). Compared to the separation methods based on physical properties, the isolation purity is largely improved by using ligands for specific recognition;
however, the labor-intensive and time-consuming procedures as well as high instrument costs remain a major obstacle and hinder their use in clinical diagnostics [38, 39, 42].
SERS detection of CTCs after enrichment
Sha et al. were the first to combine magnetic beads enrichment with SERS rapid detection and developed a no-wash assay for CTCs enumeration (in 2008) [43]. They modified magnetic beads with anti-EpCAM antibody and SERS tags with anti- human epidermal growth factor receptor-2 (HER2) antibody, respectively, thereby both NPs can specifically recognize breast cancer cells (Figure 5A). By adding the magnetic bead-EpCAM antibody and SERS-HER2 antibody conjugates to a blood sample, a sandwich structure (magnetic beads-CTC-SERS tags) will be formed and CTCs can be rapidly detected in the presence of whole blood, with a limit of detection (LOD) less than 50 cells/mL. Using the same strategy, Shi et al. fabricated folic acid-modified magnetic beads and SERS tags, which can specifically recognize CTCs since folate receptors are overexpressed in a variety of cancer cells [44]. In order to promote the in vivo application of the NPs, they built up a magnetic trapping system that can capture CTCs flowing inside a Tygon tube with different flow velocities ranging from 0.12 to 12 cm/s (mimicking the physiological situation in peripheral vessels), and were able to detect CTCs at a concentration of ∼300 cells/mL in a total sample volume of 10 mL within 7 min. Bhana et al. fabricated magnetic- SERS dual functional NPs by coating a gold shell on iron oxide NPs, and then conjugated anti-EpCAM or anti-HER2 antibodies on
the surface. The highly integrated magnetic-SERS NPs cocktail allowed on-line magnetic separation and SERS detection of CTC-mimic SK-BR-3 cells in whole blood, with a detection sensitivity down to 1-2 cells/mL [45]. Aptamers are
in vitro-selected single-stranded oligonucleotides that can bind to particular targets with high affinities and specificities, providing similar functions as antibodies but are easier to prepare and cost less. Sun et al. used a KDED2a-3 aptamer against DLD-1 cells (a colorectal adenocarcinoma cell line) to label magnetic NPs and SERS tags (Figure 5B), and the target cells were captured from buffer and whole blood with an efficiency of 73% and 55%, respectively [46].
Figure 5.SERS detection of CTCs after magnetic beads enrichment. (A) a, Schematic of the ternary immuno-complex formed by SERS tags and magnetic bead conjugates binding to the model CTC. b, TEM image of the SERS tags. c, Magnetic beads binding to SKBR3 cells. d, HER2 antibody-conjugated SERS tags (green) labeling of the SKBR3 membrane (Hoechst dye-labeled nuclei are in blue). Adapted with permission from [43], copyright 2008 American Chemical Society. (B)
Schematic representation of CTCs capture and identification using aptamer-modified magnetic beads and SERS tags. Adapted with permission from [46], copyright 2015 Springer Nature.
Figure 6. Schematic of the ASGPR antibody-conjugated silver‐coated magnetic NPs, GPC3 antibody-conjugated SERS tags, and the operating principle for CTCs detection in human peripheral blood using dual-enhanced SERS.
In order to improve the detection sensitivity, Pang et al. fabricated silver shell-coated magnetic beads and conjugated them with anti-asialoglyco protein receptor (ASGPR) antibody to recognize hepatocytes and used glypican 3 (GPC3) anti-body to decorate Au@Ag nanorods-based SERS tags (Figure 6). Aggregation of the magnetic beads and SERS tags on the surface of hepatocellular carcinoma (HCC) CTCs induced further plasmonic coupling between the Ag shell on the magnetic NPs and the
of human whole blood, among which 34 cells were captured by anti-EpCAM antibody-adsorbed nitrocel-lulose membrane and detected by SERS imaging [48].
SERS detection of CTCs without enrichment
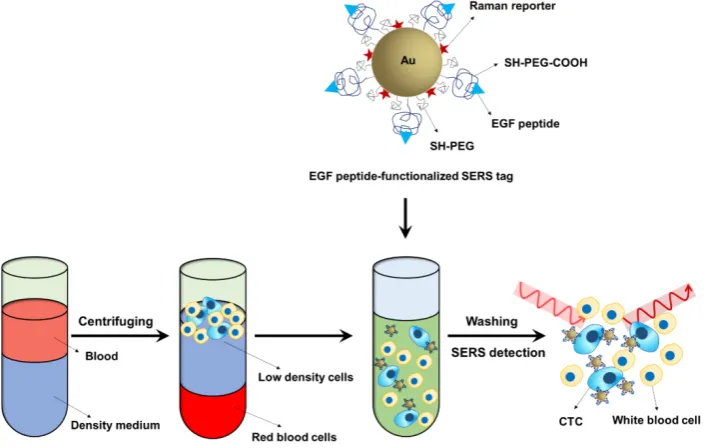
The majority of CTC detection techniques require an enrichment step before detection due to the rarity of CTCs in the peripheral blood and the presence of a large number of hematocytes. SERS is a highly sensitive technique that can detect even a single particle. Another key advantage of SERS is that it provides a sharp fingerprint-like spectrum, which is distinct from other interferences within the complex biological milieu [49]. Based on the super sensitivity and spectral specificity of SERS technology, Wang and coworkers developed a direct assay to detect CTCs in peripheral blood (Figure 7). In the direct assay, ~60 nm Au NPs were coated with QSY reporter molecules and then encapsulated with a mixed layer of thiolated polyethylene glycol (SH-PEG:SH-PEG- COOH=85:15). The closely packed PEG protection layer helped to stabilize the NPs and reduce non-specific interactions with blood cells, while the carboxy functional group was used for conjugation with epidermal growth factor (EGF) peptide as recognition groups to capture CTCs. The peripheral blood was mixed with mononuclear cell separation medium and centrifuged, and the obtained low-density cell layer containing white blood cells and CTCs was incubated with the SERS probes and then measured using a Raman system. This assay was able to detect as low as 5-50 tumor cells in 1 mL of blood and successfully identified CTCs in 19 patients with squamous cell carcinoma of the head and neck
(SCCHN) [49].
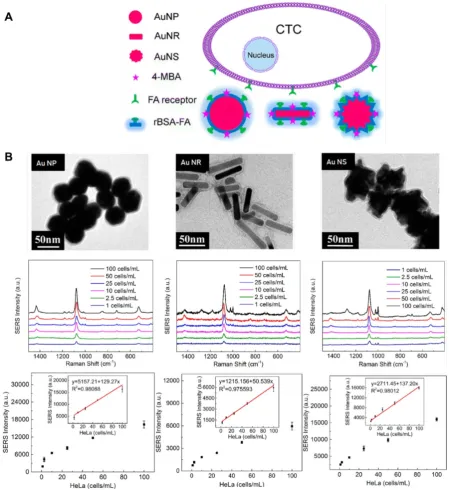
In order to reduce the thickness of the protection layer and improve SERS signal, Wu et al. used reduc-tive bovine serum albumin (rBSA) instead of PEG to encapsulate the Au NPs, and folic acid was conju-gated to the surface of the NPs to recognize tumor cells. They observed a linear relationship between SERS signal and the number of tumor cells in the range of 5-500 cells/mL, and the LOD was 5 cells/mL [50]. In their subsequent work, they fabricated SERS probes using spherical Au NPs, Au nanorods and Au nanostars as metal substrates, and then encapsulated the NPs with rBSA and conjugated them with folic acid (Figure 8). They optimized the modification conditions and proved that all three SERS probes can be utilized for CTCs detection in the blood without initial enrichment, among which Au nanostar was the most sensitive with a LOD of 1 cell/mL [51].
Multiplexed detection of CTCs based on SERS
EpCAM is highly expressed on normal epithelia and epithelial tumors but is absent on blood cells and has therefore been frequently used for positive enrichment of epithelial CTCs. However, it has recently been reported that circulating epithelial cells were detected in patients with benign colon diseases and using EpCAM as the single CTC marker might lead to false positive results [52]. Other studies have found that carcinoma cells can undergo an epithelial- to-mesenchymal transition (EMT) that results in reduced expression of epithelial markers, which means that, using anti-EpCAM antibodies as single recognition ligands might result in false negative findings [53, 54]. Thus, there is a need for
broad-spectrum enrichment and accurate discrimination of CTCs based on specific cocktails of epithelial, mesenchymal, tumor (such as HER2 and EGFR)- and/or tissue (such as PSA and
mammaglobin)-specific markers [38]. SERS provides
tremendous spectral multiplexing capacity for simultaneous detection of different targets due to its narrow peak width (~1-2 nm, about 10-100 times narrower than fluorescence emission bands) [20, 22], and therefore is becoming a highly desirable technique for CTCs discrimination and subtyping.
Figure 8. (A) Schematic of SERS-active NPs with various shapes for CTCs detection. (B) TEM images of Au nanospheres-based SERS tags, Au nanorods-based SERS tags, Au nanostars-based SERS tags, and their sensitivity for CTCs detection. Adapted with permission from [51], copyright 2016 American Chemical Society.
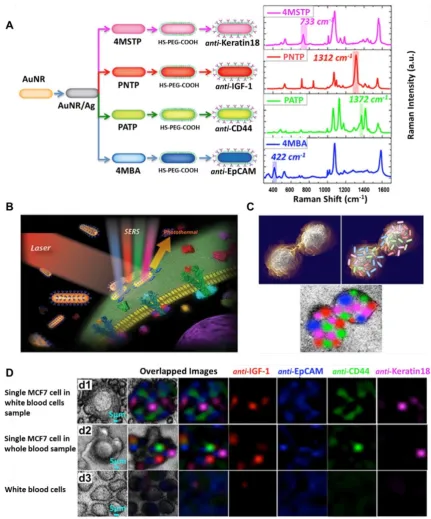
Nima et al. fabricated a series of SERS probes by functionalizing Ag-Au nanorods with four different Raman-active molecules ((4-mercaptobenzoic acid [4MBA], p-aminothiophenol [PATP], p-nitrothiophe-nol [PNTP], and 4-(methylsulfanyl) thiophep-nitrothiophe-nol [4MSTP]), and conjugating them with four kinds of antibodies specific to breast cancer markers (anti- EpCAM, anti-CD44, anti-Keratin 18 and anti-Insulin- like growth factor antigen), respectively (Figure 9). The Raman signals of the reporter molecules on the Ag-Au nanorods were more than two orders of magnitude higher than those on conventional Au
(5,5′-dithiobis (2-nitrobenzoic acid) [DTNB] and 4MBA) and two quantum dots (CdTe 614 and CdTe 512) were combined to encode the probes. Four antibodies/proteins (anti-HER2, transferrin, anti-CD3 and anti-prostate-specific membrane antigen (PSMA)) were conjugated onto the probes to target SKBR3, Hela, Jurkat T and LNCaP cells, respectively. By utilizing the above four human cancer cell lines and one normal cell line MRC-5 as model cells, the authors
proved that the nanoprobes can specifically separate cancer cells from normal ones and potentially could be used for high throughput analysis and cancer diagnosis. However, the authors pointed out that the limitation of this system is that the nanoprobes precipitated and produced signals no matter if a target cell was captured or not, and they suggested to separate the magnetic cores from the probes in future work [56].
Figure 9. Detection of multiple surface markers on CTCs using SERS. (A) Schematic and Raman spectra of four antibody-modified SERS nanotags. (B)
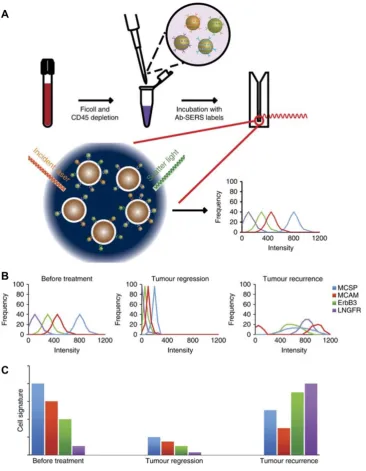
Figure 10. (A) Experimental workflow for the use of four melanoma surface marker antibodies (MCSP, MCAM, ErbB3, and LNGFR)-modified SERS tags to monitor CTC surface marker expression. (B) CTC populations in response to treatment: the frequency distribution of each marker can signal how diverse the cell populations are in terms of surface marker expression levels. (C) CTC signature in response to treatment: the relationship between the average Raman intensities of each surface marker represents the CTC signature. Adapted with permission from [59], copyright 2018 Springer Nature.
Recent studies have indicated that the molecular phenotype of CTCs evolves dynamically with the progression of disease and during treatment [38]. For example, ER- CTCs have been detected in patients with breast cancer who had ER+ primary carcinomas [57], while HER2- breast cancer was found to acquire a
HER2+ subpopulation after multiple courses of
therapy [58]. Therefore, real-time monitoring of phenotypic evolution of CTCs is crucial for obtaining vital tumor biological information for treatment guidance. Recently, Tsao and coworkers developed a SERS-based technique to characterize the phenotype changes of melanoma cell lines as well as CTCs from
clinical melanoma patients during immunological or molecular targeted therapies [59]. Four Raman reporter molecule-surface marker pairings were
decorated on the surface of Au NPs (Figure 10):
surface markers—SK-MEL-28, MCF-7, SKBR3, BM-MSC, etc. —the SERS probes were applied to monitor cellular phenotypic changes of melanoma cell lines harboring BRAF mutations in response to BRAF inhibitor (PLX4720), showing that all three tested cell lines formed distinct subpopulations after drug treatment. Then the authors collected blood samples from ten stage-IV melanoma patients serially during the course of treatment and monitored the CTC signature change. Based on the multiplexed SERS detection and analysis, they found that CTC populations shifted after treatment with dabrafenib and trametinib for 40 days and discriminated drug-resistant clones that show different CTC pheno-types [59]. Compared with current CTC detection technologies such as CellSearch system and CTC Chip, the proposed SERS-based technique is extremely sensitive (10 cells in 10 mL of blood), highly multiplexed (simultaneous monitoring of several surface protein expression profiles) and simple (does not need initial enrichment of CTCs), and therefore holds great potential to be translated into clinical use for disease and treatment monitoring.
Capture, detection and release of CTCs
Besides enumeration and subtype characteriz-ation of CTCs, downstream analyses such as single
cell genomics/ transcriptomics, or ex vivo culture of CTCs for drug sensitivity tests may provide more comprehensive information for personalized cancer therapy [8]. In a SERS-coding microsphere suspension chip designed by Li et al., folic acid as a recognition molecule was immobilized on magnetic composite microspheres through a disulfide bond and used to capture CTCs. After that, 90% of the CTCs were eluted within 20 min by incubation with glutathione which breaks disulfide bonds, and SERS labels on the cells assisted in conveniently recognizing the captured/ recovered cells [60]. More recently, Ruan et al. established a supersensitive CTC analysis system using folic acid-conjugated triangular silver nano-prisms and folic acid-conjugated superparamagnetic iron oxide nanoparticles (SPION) as SERS probes and CTC capturing agents, respectively (Figure 11A). A LOD as low as 1 cell/mL was achieved, and after adding excess folic acid the captured CTCs could be released for further cell expansion and phenotype identification [61].
Circulating cancer stem cells (CCSCs) as a rare type of CTCs, have arisen as a useful resource for monitoring and characterizing both cancers and their metastatic derivatives. Based on SERS detection combined with a microfluidic chip, Cho and coworkers developed a new technique for selective
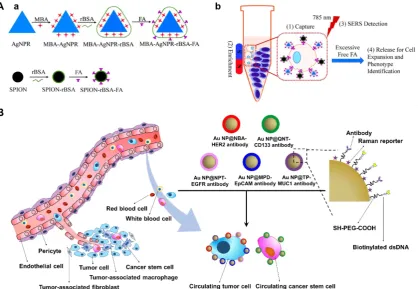
isolation and non-invasive analysis of CCSCs in complete blood samples. Au NPs were first labeled with 5 different Raman reporter molecules: thio-phenol (TP), Nile blue A (NBA), 1-naphthalenethiol (NPT), 4-mercaptopyridine (MPD) and 2-quinolin-ethiol (QNT). The obtained SERS labels were then coated with a PEG layer and individually conjugated with antibodies against 5 different surface markers (anti-CD133, anti-EpCAM, anti-EGFR, anti-HER2 and anti-MUC1) to distinguish CCSCs and several major
breast cancer CTC subtypes (Figure 11B). A
biotinylated dsDNA was also conjugated on the surface of the SERS probes for later recognition of streptavidin on the CCSC-chip, thus when the SERS probes-labeled cell suspensions flow through the microfluidic channel on the chip, the labeled CCSCs can be captured through biotin-streptavidin reaction and simultaneously detected by SERS (93% accuracy), followed by restriction enzyme digestion of dsDNA to release the cells. The authors then utilized their new method to predict tumor metastasis by screening blood samples from xenograft models and, upon CCSC detection, they found that all the tested subjects exhibited liver metastasis [62].
Exosomes
Exosomes are small extracellular vesicles (~30-150 nm in diameter) that originate from multivesicular bodies and are released into the extracellular environment by fusion of the compartments with the plasma membrane [10]. Exosomes were first isolated by Johnstone et al. in the 1970s and in the following decades were considered to be only involved in the removal of unnecessary substances [63]. After their function as intercellular messengers were demonstrated in several studies recently, exosomes have gained enormous attention both as disease markers for diagnosis and as delivery vehicles for therapy [11, 64-66]. The surface molecules on exosomes mediate their recognition of recipient cells [67]. Once attached to a target cell, exosomes can induce signaling via receptor-ligand interaction or be internalized into the target cells and deliver their content (DNA, RNA, protein and lipids) into the cytosol for cell-cell communication [10]. Exosomes can be released from almost all cell types; among them, tumor-derived exosomes are of particular interest due to their important role in cancer development, metastasis, regulation of immune responses, and induction of angiogenesis [68-70].
Current techniques for exosomes isolation and detection
Exosomes are present in most body fluids such as blood, urine, saliva and ascites, and hold great
potential to be used as promising biomarkers for liquid biopsy-based cancer diagnosis. In recent years, a large variety of techniques have been developed for exosome detection, most of which require an initial isolation step to purify exosomes from the complex biological milieu using separation methods such as differential ultracentrifugation, ultrafiltration, precip-itation using water-excluding polymers, immunoaffi-nity capture, and microfluidics-based techniques [71]. In 2006, Thery et al. set up the ultracentrifugation protocol for purifying exosomes from cell culture supernatants and biological fluids that is currently considered the gold standard and represents one of the most commonly used and reported techniques in exosome isolation [72]. Additionally, based on the small size of exosomes, ultrafiltration using nanome-mbranes has also been introduced for exosome isolation [73]. Compared with ultracentrifugation, ultrafiltration is relatively faster and does not rely on specialized equipment; however, the shear stress might cause deterioration and the exosomes might be lost due to trapping in the pores of the filters. Exosome precipitation using polymers such as PEG is another method that is easy to perform and has been proved to be more efficient than ultracentrifugation and nanomembrane concentration [73]. Several isolation kits based on precipitation are now comerci-ally available; nevertheless, their applications are limited due to the coisolation of non-exosome materials such as proteins, which influence subsequent analysis. Immunological separation based on selective recognition of proteins on the membrane of exosomes (such as tetraspanins CD81, CD9, CD63 and cancer-related proteins HER2, EGFR) using corresponding antibodies-modified magnetic beads enables specific and fast purification of exosomes; however, it remains difficult to be applied to large-volume samples. Recently, rapid advances in microfabrication technology have offered the oppor-tunity to fabricate complicated microfluidics-based devices and integrate them with the above-mentioned size/immunoaffinity-based techniques as well as acoustic/electrokinetic sorting methods, allowing fast separation of exosomes from a large number of samples [74, 75]. After purification, the exosomes are usually characterized using techniques such as ELISA, flow cytometry, nanoparticle tracking analysis (NTA), microfluidic or electrochemistry-based approaches to evaluate the number of exosomes or their expression levels of disease-related proteins. Progress in the aforementioned exosome isolation and detection techniques has been summarized in several comprehensive reviews [18, 71, 76].
qualitative analysis of exosomes. For example, Liang et al. described a rapid, ultrasensitive and inexpensive nanoplasmon-enhanced scattering (nPES) assay that directly quantifies tumor-derived extracellular vesicles from as little as 1 μL of plasma. In this assay, extracellular vesicles are first captured by antibodies modified on a sensor chip and when antibody- conjugated gold nanospheres and nanorods bind with the vesicles concurrently, the formed Au nanosphere- vesicle-Au nanorod complexes produce a local plasmon effect that shifts the spectra of scattered light while increasing the scattering intensity [77]. Besides the nPES assay, plasmonic nanomaterials have been designed as SERS tags for simultaneous detection of multiple cancerous exosomes, and have also been applied as enhancement substrates for exosomes classification using label-free SERS analysis methods [78]. In the following sections, we will summarize recent studies using SERS-based techniques for exosome detection and analysis.
Detection of exosomes by SERS tags
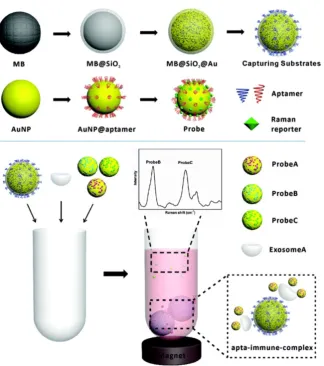
Although SERS tags have been largely applied for the detection of CTCs and disease-related biomol-ecules in the past decade, their first application to the detection of tumor-derived exosomes appeared only two years ago. In 2016, Cui’s group fabricated anit-CD63 antibody-modified magnetic NPs and anti-HER2 antibody-modified Au@Ag nanorods, which can bind various surface proteins on the membrane of tumor-derived exosomes. In the presence of the target exosomes, a sandwich-type immunocomplex is formed and, after precipitation using a magnet, the SERS signals are measured. With this assay, exosomes from a human breast cancer cell line SKBR3 and a human fetal lung fibroblast cell line MRC5 were studied, proving that tumor-derived exosomes can be qualitatively and quantitatively detected, with a LOD of 1200 exosomes in duration of 2 h [79]. To simultaneously detect multiple kinds of exosomes, the same group improved their method by mixing exosome samples with CD63 aptamer- modified magnetic nanobeads and three kinds of SERS nanoprobes that were labelled with different Raman reporter molecules and modified with aptamers against different tumor markers (HER2, CEA and PSMA). When one kind of target exosome is present, only the specific SERS probes will recognize the target exosomes and form a sandwich-type complex with the magnetic nanobeads. After the complexes are precipitated by a magnet, decreased signals of the corresponding SERS probes in the supernatant will be detected while the signals of the other non-relevant SERS probes remain unchanged. When three kinds of exosomes are present simultan-eously, the SERS intensities of the three types of the probes will all decrease (Figure 12). Using this method, LOD values of 32, 73, and 203 exosomes per microliter were achieved for exosomes secreted by SKBR3, Tb4 and LNCaP cells, respectively. In addition, blood samples from breast cancer, colorectal cancer and prostate cancer patients were tested, demonstrating the great potential of this method to be applied to early stage screening of cancers [80].
Figure 13. (A) Experimental workflow of the fabrication of an antibody array and the detection of exosomes by the antibody array and SERS tags. (B) Average SERS spectra of exosomes at different concentrations captured with CD63 antibodies, average SERS spectra from exosomes using different capture antibodies, and a colorimetric comparison of protein expressions on cancer and normal cells based on SERS detection results. Adapted with permission from [81], copyright 2018 Ivyspring.
In another study performed by Kwizera et al., an antibody array was printed on a standard gold-coated glass slide to fabricate a miniaturized device for exosomes capture (Figure 13). By using gold nanorods labelled with QSY21 as SERS tags to detect the exosomes, a LOD of 2000 exosomes per microliter was obtained and more than 80 purified samples could be analyzed on a single device within 2 h. The expression levels of serval surface protein markers (EpCAM, CD44, HER2, EGFR, IGF1R, CD81, CD63 and CD9) were analyzed, showing that exosomes derived from MDA-MB-231, MDA-MB-468, and SKBR3 breast cancer cells give distinct protein profiles compared to exosomes derived from MCF12A normal breast cells. The authors also found that exosomes in the plasma from HER2-positive breast cancer patients exhibit significantly higher levels of HER2 and EpCAM than those from healthy donors, suggesting the diagnostic potential of these markers for breast cancer diagnostics [81]. More recently, Li et al. developed an ultrasensitive SERS immunoassay for exosome-based diagnosis and classification of pancreatic cancer. In this assay, polydopamine (PDA) was self-polymer-ized on the surface of both glass slides and SERS tags (Au@Ag-PATP) and antibodies against different
target proteins on exosomes (migration inhibitor factor (MIF), glypican 1 (GPC1), CD63, EGFR) were individually encapsulated into the PDA layer. Then, exosomes derived from pancreatic cancer or healthy control patient samples were captured on the chip surface followed by recognition of the SERS tags to form a “chip-exosome-SERS tag” sandwich structure. Based on the specific recognition and strong signal of the SERS tags, a single exosome in 2 μL sample could be detected. In addition, by analyzing 2 μL of clinical serum sample, the MIF antibody-based immunoassay could not only discriminate pancreatic cancer patients from healthy individuals, but also distinguish metastasized tumors from metastasis-free tumors and different stages of tumor node metastasis [82].
Label-free SERS detection of exosomes
information of the exosomal content, but these methods usually require complicated and time- consuming protocols and are cost inefficient since a large amount of sample is needed for a single measurement [83]. Raman spectroscopy provides the intrinsic molecular information of biological samples and, as in SERS, these signals can be greatly enhanced when the analytes are located in close proximity to plasmonic nanomaterials [32]. To obtain enhanced Raman signals of exosomes, Tirinato et al. decorated nano-geometry-based phonics structures on a super- hydrophobic surface, with which exosomes were conveniently concentrated and conveyed onto the SERS-active area. SERS spectra analysis indicated that exosomes derived from healthy cells (CCD841-CoN) exhibited a higher lipid content while the ones derived from tumor cells (HCT116) exhibited a richer RNA content [84]. In a later study performed by Lee et al., a silver film-coated nanobowl platform was fabricated to capture exosomes secreted by SKOV3 cells and served as a substrate to enhance the Raman
signals (Figure 14A). SERS spectra of exosomes
purified by two separation methods (total exosome isolation reagent (TEIR) and ultracentrifugation) were recorded and statistically analyzed with principal component analysis (PCA). They found that the TIER kit might purify a certain kind of exosomes more selectively than ultracentrifugation but produced strong background SERS peaks which needed to be subtracted. New SERS peaks were found to appear during the drying process, indicating that the initially intact exosomes ruptured over time and released their molecular contents. This time-dependent evolution of SERS peaks enabled analysis of exosomal membrane compositions as well as the contents inside the exosomes [83]. Other metallic substrates such as a bimetallic nanoplasmonic gap-mode substrate fabricated by assembling Ag nanocubes on Au nanorods array [85], Au nanospheres-deposited cover glass (Figure 14B) [86], silver-coated recordable compact disk [87], positively-charged small Au NPs [88] and integrin-specific peptide ligand-modified Ag NPs [89] have also been applied for analysis of intrinsic Raman spectra of exosomes. In most of the cases, patterned metallic surfaces instead of colloidal NPs were applied for SERS detection of exosomes, probably due to the similar size range of SERS NPs and exosomes and the difficulty in linking exosomes in close proximity to the NP surface. In a recent study performed by Stremersch and coworkers, 10 nm positively-charged Au NPs were prepared by coating a 4-dimethylaminopyridine layer on the NPs. These NPs can be electrostatically adsorbed onto the surface of exosomes to form a plasmonic shell, thereby enabling generation of enhanced Raman signals of
individual vesicles in suspension. By performing partial least squares discriminant analysis (PLS-DA) on the obtained spectra, vesicles from different origins (B16F10 melanoma cells and red blood cells) were distinguished [88].
Different from SERS tags-based detections, label- free SERS detection usually obtains complicated spectra due to the complexity of biological samples and, therefore, requires arduous spectral analysis to obtain biomedically relevant information. In most cases, the SERS spectra of exosomes from cancer patients with reference to healthy people are recorded and compared, and the peaks in the difference spectra are tentatively assigned to certain components such as lipid, phospholipid, nucleic acid, polysaccharide, amino acids and proteins according to previous literatures. However, SERS signals greatly depend on interactions among sample, metal substrate and laser. Even for exosomes derived from the same cell lines, the intensity and shape of SERS spectra might be varied when different parts of exosomes are located in the plasmonically active area. To statistically classify the origin of exosomes, PCA analysis is usually performed to compact the information contained in the spectra into a limited set of principal components, and the scores for individual measurements may provide a quantitative metric to detect differences between complex spectra. Alternatively, by training with Raman spectra of pure samples, a PLS-DA model can be built and used to discriminate different types of vesicles.
Circulating tumor DNA
Figure 14. Label-free SERS detection of exosomes. (A) Schematic of a silver film-coated nanobowl substrate preparation and its use in SERS analysis of intact and ruptured exosomes (a). Time-dependent SERS spectra of exosomes derived from the SKOV3 cell line (b) and principal component analysis of the SERS spectra (c). Adapted with permission from [83], copyright 2015 The Royal Society of Chemistry. (B) Schematic of exosomes released from lung cancer cells (a) and normal cells (b), and SERS detection of the two types of exosomes (c, d). e, SERS spectra of exosomes released from lung cancer cells (blue) and normal cells (black). f, Exosome classification by PCA of SERS spectra. Adapted with permission from [86], copyright 2017 American Chemical Society.
Isolation of cfDNA for detection of tumor- specific alterations is relatively easy compared with purification of CTCs and exosomes. Typically, 5-10 mL of blood sample is extracted in an anticoagulant tube and centrifuged to obtain plasma containing cfDNAs. Although the amount of cfDNAs in plasma may be 2-4 times lower than that in serum [95], it is
methods for analyzing ctDNA, which is challenging due to the small fraction of tumor-specific DNA among the enormous total cfDNAs (<1.0% in many cases). Current technologies for the analysis of ctDNAs can be broadly categorized as targeted and untargeted approaches. Targeted approaches utilize PCR-based, digital PCR-based or sequencing-based techniques to detect specific known somatic mutations/epigenetic alterations that have been discovered in a primary tumor, such as BRAF, KRAS, TP53, PIK3CA and methylated CpGs. On the other hand, untargeted approaches employing genome- wide methods such as whole genome sequencing, personalized analysis of rearranged ends (PARE), and digital karyotyping, are important for the discovery of novel disease markers. Progress in these techniques has been summarized in several recent reviews [93, 97]. Here, we will introduce two SERS-based strategies for the detection of targeted ctDNAs: combining enzymatic amplification with SERS tags, and “click” SERS reaction.
ctDNAs detection by enzymatic amplification combined with SERS tags
Zhou and coworkers developed a novel strategy to detect single-stranded ctDNA by combining a molecular recognition unit (triple-helix molecular switch, THMS) and, a signal amplification unit (RNase HII enzyme) with T-rich ssDNA-mediated
SERS enhancement of single-walled carbon nanotubes (SWNTs). As shown in Figure 15A, the presence of target ctDNA leads to release of T-rich ssDNA from THMS. With the aid of HII enzyme-assisted amplification, a large number of T-rich ssDNAs could
be adsorbed onto the surface of SWNTs by
π
-
π
stacking interactions and serve as a template for in situ
growth of copper NPs. The Cu NPs decorations greatly enhance the G-band peak of the SWNTs due to the enhanced electromagnetic field between Cu NPs and SWNTs. This method enables detection of DNA point mutations (KRAS G12DM) with a sensitivity of 0.3 fM, and needs a sample volume of only 5 μL [98]. In another study performed by Wee et al., a multiplexed PCR/SERS detection method was designed for simultaneous analysis of 3 DNA point mutations in melanoma (BRAF V600E, c-Kit L576P and NRAS Q61K). In this assay, Au NPs modified with Raman reporter molecules and thiolated DNA oligonucleotides were used as SERS nanoprobes to recognize the barcoded-amplicons, and then were enriched using magnetic beads for SERS detection (Figure 15B). This assay enables highly specific and sensitive (10 mutant alleles from a background of 10,000 wild type sequences) detection of multiple ctDNAs with the convenience of standard PCR, and may potentially be translated into clinical applications [99].
Figure 16. (A) Schematic of the concept of “Click SERS” analogous to click chemistry. (B) a, Schematic of a 15-well plate for 10-plex DNA detection and top view of the detection wells with full spectra when 10 targets are added. b, TEM images of dimer formation. c, Acquired “Click” spectra presented in the wells during sample detection. Adapted with permission from [100], copyright 2018 American Chemical Society.
ctDNAs detection by “Click” SERS
Most recently, Zeng et al. reported a new readout technique for DNA detection, the so-called “Click” SERS, which is based on Raman scattered light splice derived from SERS tag assemblies [100]. Analogous to the reaction of small molecule units in click chemistry, two SERS tags form a dimer upon simultaneous recognition of a target molecule, leading to combinatorial output of signals from individual NPs (Figure 16A). In order to simplify the spectral analysis and avoid interference from biological milieu, triple bond-containing reporters with single and narrow emission in the biological Raman silent
region (~1800-2600 cm-1) were synthesized and
employed to label the SERS tags. In contrast to the conventional “sole code related to sole target” readout method, “Click” SERS relies on the number and positions rather than the intensity of combinatorial emissions, and thus the multiplexing capacity can be continuously increased as long as more distinguishable emissions are employed (Figure 16B). In a proof of concept study, the authors successfully detected 10-plex DNAs synchronously using this strategy. Apart from DNA molecules, other substances such as thrombin, ATP, Hg2+ in solution and receptor proteins on cell membranes could also be detected/ imaged by target-simulated assembly of SERS tags [100].
Circulating microRNAs
MicroRNAs are small non-coding RNAs (18-25 nucleotides) that regulate gene expression by paring to the 3’ untranslated region (UTR) of a set of mRNAs [101]. Since discovery of the first miRNA in
Caenorhabditis elegans, over 30,000 mature miRNAs have been identified in 206 species [102, 103]. miRNAs are involved in regulating a wide range of biological and pathological processes including development, metabolism, signal transduction, and tumor progress. Correlations between miRNAs and different types of cancer have been well-documented in several recent reviews, showing that certain species of miRNAs play key roles in tumorigenesis, progression and metastasis [15, 16, 103-105]. For example, miR-25 and miR-223 were proved to be relevant in the tumorigenesis of NSCLC [106], while miR-155 was found to be significantly elevated in breast cancer patients [107]. Due to their broad existence and stability in many body fluids including blood, urine, saliva, tear, and cerebrospinal fluid, circulating miRNAs are emerging as a class of novel biomarkers for cancer detection and prognosis [108].
Label-free SERS detection of circulating miRNA
SERS as a sensitive spectroscopic technique was introduced into the field of miRNA detection in 2008 when Driskell et al. utilized silver nanorod arrays as a metal substrate for label-free detection and classification of miRNAs. In this work, 5 unrelated human miRNAs and 8 members of the Let-7 miRNA family were synthesized and directly adsorbed onto the silver nanorod arrays. The SERS spectra of related and unrelated miRNAs were detected in near-real time, and miRNA patterns were classified using PLS-DA analysis with high accuracy [110]. By generation of PLS models for two-, three-, and five-component mixtures from massive spectra covering a wide concentration range of each miRNA, the same group could quantitatively detect individual miRNA in multicomponent mixtures [111]. In a later study, Abell et al. employed an array-patterned Ag nanorods chip to obtain reproducible SERS signals and used least squares analysis for quantitative determination of the relative ratios of the four nucleotide components A, C, G, and T/U in miRNA sequences. Using this method, subtle changes in the SERS spectra of a clinically relevant miRNA before and after hybridization were captured [112].
Detection of circulating miRNA by SERS tags
Compared with label-free analysis, SERS tags have been more frequently employed for ultrasensi-tive and multiplexed detection of circulating miRNAs, mainly through the following three strategies: formation of a sandwich structure, signal turn “on/off”, and hybridization chain reaction (HCR)- induced signal amplification.
A sandwich structure is usually composed of a detection probe, a target molecule and a capture unit. In a study performed by Guven et al., miR-21 was either directly immobilized onto a gold slide or using a capture probe for hybridization, and then SERS tags modified with detection probes were added and further hybridized with the targets. The detection limits of the direct and sandwich assays were both around 1 nM; however, the sandwich assay provided better selectivity [113]. Later, Su and coworkers synthesized DNA-mediated Au-Ag nanomushrooms with interior nanogaps as ultrasensitive detection probes. The DNA on the NPs act as both gap DNA for SERS signal enhancement and probe DNA for hybridization with target sequences. Raman reporter molecules were adsorbed onto the NPs either by using a Raman reporter-labeled alkanethiol probe DNA or co-assembling thiol-containing Raman reporter molecules with the probe DNA, and capture DNA was modified on the surface of magnetic NP
through biotin-streptavidin reaction (Figure 17A). In the presence of target sequences (miR21, miR31, miR141), sandwich structures (Au-Ag nanomushro-om-target RNA-magnetic NP) are formed and SERS signals can be detected at a miRNA concentration as low as 1 pM [114]. Similarly, Zhou et al. fabricated nanogap-based SERS tags encoded with Raman dyes and synthesized hollow silver microspheres using bacteria as templates. The SERS tags and Ag microspheres were modified with detection DNA probes and capture DNA probes, respectively. Simultaneous detection of multiple liver cancer- related miRNAs (miR223, miR21, miR122) was performed with high sensitivity (detection limit of 10 fM) and specificity, demonstrating the potential of this assay in clinical diagnosis [115].
nanoprobes were further combined with padlock probe-based exponential rolling circle amplification (P-ERCA) for ultrasensitive detection of miR-155. This assay exhibited a wide linear range of 100 aM to 100 pM with a LOD of 70.2 aM, indicating its potential application for clinical diagnostics [119].
Hybridization chain reaction is an enzyme-free, room temperature linear amplification approach that was first introduced by Robert et al. in 2004 [120]. In this approach, stable species of DNA hairpins coexist in solution until the introduction of initiator strands triggers a cascade of hybridization events that yields nicked double helices analogous to alternating copolymers. Compared with enzyme-based amplific-ation strategies, HCR is simple in operamplific-ation and
cost-effective, only using the DNA single strand for in situ adjustment of the length of double-stranded DNA. Zheng and coworkers combined
miRNA-triggered HCR reaction with Ag+-mediated
cascade amplification to detect circulating miRNAs in
serum. As shown in Figure 17C, the target miRNA
triggered fabrication of long self-assembled DNA polymer via HCR on the surface of silica microbeads, inducing multiple Ag NPs conjugation, which worked as a primary amplification element. Then, the Ag NPs were dissolved into silver ions, which can control the gaps between neighboring Raman reporter-encoded Au NPs to form ‘‘hot-spots’’ and produce enhanced SERS signals. The quadratic amplification allowed a detection limit of miRNA as low as 0.3 fM. Using this assay, miR-21 in sera of chronic lymphocytic leukemia (CCL) patients and healthy donors was detected, indicating increased expression of miR-21 in CCL patients [121]. In a later study performed by Liu et al., locked nucleic acid (LNA) capture sequences were bolted on a chip surface to recognize miR-21. Upon addition of target molecules, high-efficiency cascade HCR was triggered and hairpin structure-modified, 4,4′- biphenyldithiol (DBDT)- coded Ag NP dimers were assembled into a large aggregate. As a result, extremely bright SERS signals were generated, allowing detection of a single miR-21 at the single-cell level [122]. Similarly, Li et al. designed a
target-triggered strand
displacement-
hybridization chain reaction (TSD-HCR). In this reaction,
miR-141, an epithelial-associated miRNA
expressed in a wide range of common human cancers including breast, lung, and prostate cancer, was used as a model to optimize the experimental conditions. This assay enabled monitoring of miR-141 from human breast cancer cells down to 0.17 fM, with a wide linear range from 10-15 to 10-7 M [123].
Figure 17. SERS-based detection of circulating microRNA. (A) Schematic of the synthesis of mushroom-like Au-Ag SERS probes by either using a Raman reporter-labeled alkanethiol probe DNA (1), or co-assembling thiol-containing Raman reporter molecules with the probe DNA (2), and formation of the sandwich complexes by hybridization of target DNA/RNA with capture beads and SERS probes. Adapted with permission from [114], copyright 2017 American Chemical Society. (B) Schematic of the preparation and application of the molecular beacon-functionalized SERS sensor (signal turn “on/off”) for simultaneously measuring multiple miRNAs. Adapted with permission from [117], copyright 2016 The Royal Society of Chemistry. (C) Design scheme of enzyme-free quadratic SERS signal amplification for circulating microRNA detection in human serum via miRNA-triggered hybridization chain reaction and Ag+-mediated cascade
Cancer-related protein
For decades, panels of blood protein markers including carcinoembryonary antigen (CEA), alpha- fetoprotein (AFP), PSA, CA 19-9, CA15-3, CA 125, EGFR, etc. have been applied for prognostic tests, monitoring of cancer recurrence, and for predicting therapeutic response [17, 124-127]. The expressions of these markers in the blood are frequently elevated several months before imaging abnormalities, and therefore could effectively guide triage of patients into optimal treatment strategies and facilitate personalized therapy [126]. Compared with other circulating tumor markers, proteins are easily recovered from blood plasma and serum, but the high abundance of blood proteins such as albumin and the broad size/concentration ranges of various protein molecules complicate the detection of low-abundant protein biomarkers. Identification and quantification of protein markers is normally performed using immunological techniques such as Western blot (WB) or ELISA. The target proteins are captured by corresponding antibodies or aptamers to generate a colorimetric or fluorescence signal proportional to the quantity of protein in the samples. Although robust, these methods are tedious, expensive and, in the case of WB, semi-quantitative and with low sensitivity. Compared to enzyme-labeled antibodies broadly used in traditional ELISA, SERS tags-labeled antibodies/aptamers usually provide a higher detec-tion sensitivity and enable simultaneous detecdetec-tion of multiple protein markers, which helps to increase the accuracy of disease diagnosis. During the past decade, a variety of SERS-based platforms have been estab-lished for ultrasensitive and multiplexed detection of cancer-related proteins, employing different mechanisms such as SERS signal generation upon formation of a sandwich structure, SERS signal turn “off” upon dissociation of core-satellite assemblies, enzyme-induced generation/amplification of SERS signal, target molecule binding-induced Raman frequency shift, etc. A couple of examples will be presented for each strategy in the following section.
SERS signal generation upon formation of a sandwich structure
In SERS-based detection assays of target proteins, a sandwich structure is usually formed from a SERS tag, target protein, and a magnetic bead or a nanostructured metal surface. Choo’s group has utilized a SERS-based immunoassay for simultaneous detection of two lung cancer markers, CEA and AFP, directly in the sera of patients. In this assay, hollow gold nanospheres were labeled with malachite green isothiocyanate (MGITC) and X-rhodamine-5-(and-6)- isothiocyanate (XRITC), and conjugated with anti-
CEA and anti-AFP antibodies, respectively. The SERS labels and antibodies-modified magnetic beads formed sandwich immuno-complexes in the presence of CEA and AFP, and the Raman signals were then measured [128]. In a recent study performed by the same group, a similar immunoassay was developed for the determination of free to total (f/t) PSA ratio to improve the diagnostic performance of prostate cancer. PSA screening has been applied in the diagn-osis of prostate cancer for more than 20 years [129]; however, it has been found that the PSA blood test is not specific for prostate cancer because other factors including benign prostatic hyperplasia or prostatitis can also cause an increase in total PSA (t-PSA) [130]. To solve this problem, the f/t PSA ratio can be additionally used to discriminate prostate cancer from benign prostatic diseases. In the study of SERS-based detection of the f/t PSA ratio, Au NPs were labeled with MGITC and XRITC, and conjugated to anti-free PSA(f-PSA) antibodies and anti-complexed PSA (c-PSA) antibodies, respectively, while magnetic beads were modified with anti-t-PSA antibodies (Figure 18). The SERS-based immunoassay provided a LOD of 0.012 ng/mL for f-PSA and 0.15 ng/mL for c-PSA. In the detection of 30 clinical samples, the SERS-based assay showed comparable results with parallel electrochemiluminescence (ECL) detection, with a small sample volume (<10 μL), a short assay time (<1 h), and a smaller standard derivation, therefore holding strong potential for accurate diagnosis of prostate cancer in the clinic [131]. To avoid the washing step and simplify the detection process, Gao et al. combined a SERS-based immunoassay with a droplet-based microfluidic system embedded with a rectangular magnetic bar. In the presence of PSA targets, immunocomplexes formed in the droplets. Then, the system segregated free SERS tags and magnetic immunocomplexes by splitting the droplets into two smaller parts: the supernatant part containing free SERS tags and the other part containing magnetic immunocomplexes. By detecting the SERS signals in the supernatant droplets, PSA in the serum was quantitatively and automatically detected with a LOD below 0.1 ng/mL, without any washing steps [132].
capture target proteins. For example, Domenici et al. encapsulated glass slides with the bacterial blue-copper protein azurin, which binds P53 proteins. SERS tags linked to P53 were then captured by azurin on the slide and selectively detected wild- type/mutated P53 at concentrations as low as 500 fM in human serum [134]. A three-dimensional hierarchical plasmonic nanostructure endows much higher sensitivity than a planar surface. Li et al. compared the performance of SERS immunosensors with different configurations, i.e., Au nanospheres with Au film, Au nanospheres with Au triangle nanoarray, and Au nanostars with Au triangle nanoarray. The last one exhibited the highest sensitivity with a LOD of 7 fg/mL toward human IgG and was successfully applied for detection of VEGF in plasma from clinical breast cancer patients [135]. In a recent study, Song et al. fabricated Au-coated butterfly wings with natural 3D hierarchical sub-micrometer structures as SERS substrates. The Au layer was ~40-70 nm in thickness, formed a much higher hotspot density than the plain surface, and enabled reliable and sensitive detection of tumor marker CEA in clinical biofluid samples [136].
A special material that has been exploited for SERS detection of target proteins in a low sample volume is hollow core photonic crystal fiber (HCPCF). Conventional optical fibers have been combined with SERS for in vivo sensing/imaging, showing desired flexibility but usually lacking detection sensitivity. As
shown in Figure 19A, HCPCF enables the
incorporation of liquid analytes and SERS tags into air holes and provides a long laser light-analyte interaction length, thus allowing highly sensitive detection of biomolecules from extremely low sample volumes. Olivo et al. developed a highly sensitive protein sensing methodology by combining SERS with HCPCF, using EGFR as a model analyte. The inner wall of the core of HCPCF was first modified with poly-L-Lysine, then EGFR was immobilized on the wall. After dipping into the suspension of anti-EGFR antibody-conjugated SERS tags, the tags specifically bound with the target proteins (Figure 19B). This sensing method enables detection of ∼100 pg protein in a sample volume of ∼10 nL [137]. In a following work by the same research group, two potential hepatocellular carcinoma markers, AFP and alpha-1-antitrypsin (A1AT), were simultaneously detected using Cy5-labeled SERS tags and MGITC- labeled SERS tags in combination with HCPCF in a sample volume of only 20 nL. However, the authors pointed out that two challenges were faced in this platform: non-specific binding of the SERS tags onto the inner wall of the fiber, and incorporation of the samples into the cladding holes along with the hollow core, which lead to alteration of the bandgap and hence affected light guidance inside the core. A potential solution is selectively collapsing the cladding walls to realize liquid-core PCF that allows the liquid analytes to fill only the central hollow core, and better controls should also be provided to avoid non-specific signals [138].
Figure. 19 (A) Schematic of HCPCF as a SERS platform. (B) Schematic of the binding of anti-EGFR antibody-conjugated SERS tags to the target proteins immobilized on the inner wall of the core of HCPCF.
Figure 20. (A) Scheme of a SERS sensor for the detection of mucin-1 based on Au NRs–Ag NPs core-satellite assemblies. (B) TEM images of Au NRs–Ag NPs core-satellite assemblies with different concentrations of mucin-1. (C) SERS spectra and standard curve of mucin-1 detection. Adapted with permission from [140], copyright 2015 The Royal Society of Chemistry.
SERS signal turn “off” upon dissociation of core-satellite assemblies
A signal turn “off” strategy has been designed for the detection of target protein based on competitive binding of an aptamer with target protein and the partial complementary sequence. Ma et al. fabricated a core-satellite structure comprised of a 37 nm Au@Ag NP as a core and 10 nm Au NPs as satellites, using an aptamer specific to PSA and its partial complementary DNA as linker molecules. The assemblies had intense electromagnetic hot-spots and
Figure 21. (A) Schematic of a Ag NPs aggregation-based SERS signal generation system. Adapted with permission from [142], copyright 2015 American Chemical Society. (B) a, Schematic of SERS tags binding on BMFON after MMP-2/MMP-7 enzyme cleavage of peptides on BMFON and AuNPs. b, SEM images of (i) clean BMFON substrate (ii) peptide-shielded avidin-conjugated BMFON and (iii) SERS tags bound to BMFON after enzyme cleavage. Adapted with permission from [144], copyright 2015 Optical Society of America.
Enzyme-induced generation/amplification of SERS signal
In conventional ELISA detection, a signal is generated by the conversion of the enzyme substrate into a colored molecule, the absorbance of which is then measured with a plate reader. By combining enzyme labels in ELISA with hydrogen peroxide- mediated controlled growth of gold NPs, Stevens et al. developed an ultrasensitive assay for detection of biomarkers with the naked eye, which was termed plasmonic ELISA [141]. Similarly, Liang and coworkers demonstrated a new method that use oxidation-induced dissolution of aggregated SERS
tags for ultrasensitive analyte detection. The
mechanism is shown in Figure 21 A: proper
aggregation of SERS tags produces “hot spots” and generates bright SERS signals, which can be reduced by hydrogen peroxide through oxidization of Ag NPs
to Ag+. In the presence of target molecules,
Olivo and co-workers, formation of hemoglobin– haptoglobin (Hb–Hp) complex was utilized to catalyze the reaction of 3,3′,5,5′-tetramethylbenzidine (TMB) substrate to generate the final product of strongly SERS-active TMB2+. Haptoglobin is an acute phase plasma glycoprotein that is widely gaining application as a prognostic ovarian cancer biomarker. In this assay, a linear increase in the SERS signal of TMB2+ was observed with increasing concentrations of Hb–Hp complex from 50 nM to 34 µM, and Hp in clinical samples was quantified, showing higher sensitivity compared with conventional ELISA method [143].
Matrix metalloproteinases (MMP) are a family of zinc-dependent endopeptidases, among which, over expression of MMP-2 and MMP-7 has been reported to correlate closely with carcinomas such as breast cancer, lung cancer, pancreatic cancer, gastric cancer and prognosis of colorectal carcinoma. Gong et al. designed a platform for the detection of MMP-2 and MMP-7 based on corresponding enzymatic reactions. In this platform, avidin-modified bimetallic-film- over-nanosphere (BMFON) substrate and biotin- modified SERS tags are shielding by MMP peptides; in the presence of corresponding enzymes, the peptides are cleaved, leading to the binding of BMFON with SERS tags and thus strong SERS signals
are generated (Figure 21B). This method enabled
detection of individual enzymes ranging from 1 ng/mL to 40 µg/mL, and multiplexed detection of MMP-2 and MMP-7 was realized through simultan-eous incubation with 4-aminothiophenol (4ATP)- and 2-naphthalenethiol (NT)-labeled peptide-modified SERS tags [144].
Target molecules binding-induced Raman frequency shift
In most of the afore-mentioned SERS tags-based detection techniques, the amount of target molecule is quantitatively analyzed according to the intensity of SERS signal. In an entirely different way, Olivo et al. observed that the Raman frequencies of an antibody- conjugated SERS-active molecule can be affected when binding to its target antigen. The frequency shifts were attributed to structural deformations of the reporter molecule as a result of the binding event, which means that, a single antibody-conjugated SERS reporter molecule could behave as a nanomechanical biosensor (Figure 22A). Based on this phenomenon, the SERS response of anti-influenza-H1-conjugated 4ATP to mechanical stresses induced upon binding to influenza-H1 (H1) and the SERS response of anti-p53-conjugated 6-MP upon binding to P53 antigen were investigated. A detection limit of around 2.5 nM was obtained, a level comparable with
conventional ELISA [145]. In a following study by the same group, the LOD of H1 was further improved to ~10 pM by fabricating a random silver film as a highly sensitive SERS substrate [146]. Later, Tang et al. developed a wet chemical silver NP film fabrication for SERS substrates and employed microcontact printing to define ordered domains of chemisorbed
Raman reporters on the substrate (Figure 22B);
simultaneous detection of AFP and GPC-3 was realized with a LOD down to subpicomolar concentrations (10-13 M) [147]. Instead of using antibodies for target molecules recognition, Pazos et al. designed a SERS-active peptide-conjugate (MB-H1) by attaching a 4-mercaptobenzoyl (MB) unit to the side chain amino group of a lysine residue on the H1 peptide. The MB provided a large SERS cross-section and bound to the metal NPs through silver-thiol interaction, while the H1 peptide selectively linked with c-MYC protein. The peptide /c-MYC recognition was translated into measurable alterations of SERS spectra (ratio between the out-of-plane CCH
deformation at 756 cm−1 and the in-plane ring
breathing at 1075 cm−1), and enabled fast and reliable detection of c-MYC in blood [148].
Apart from conjugating recognition groups with Raman reporter molecules, Balzerova et al. developed a method directly using antibody-modified Fe3O4@ Ag nanocomposites for label-free determination of human IgG in blood samples obtained by finger prick (Figure 22C). The antibody-modified Fe3O4@Ag nanocomposites generated Raman peaks at 1650, 1539, and 1350 cm-1, which were induced by amide I, II and III vibrations, respectively. Upon binding of human IgG onto the nanocomposites, the intensities and ratios of the spectral bands changed in correlation to the amount of IgG, enabling detection of IgG at concentrations above 600 fg/mL [149].
![Figure 5. labeling of the SKBR3 membrane (Hoechst dye-labeled nuclei are in blue). Adapted with permission from [43], copyright 2008 American Chemical Society](https://thumb-us.123doks.com/thumbv2/123dok_us/8685628.1734587/5.612.107.544.365.575/labeling-membrane-hoechst-adapted-permission-copyright-american-chemical.webp)