Available online on 15.05.2019 at http://jddtonline.info
Journal of Drug Delivery and Therapeutics
Open Access to Pharmaceutical and Medical Research© 2011-18, publisher and licensee JDDT, This is an Open Access article which permits unrestricted non-commercial use, provided the original work is properly cited
Open Access
Research Article
Development and validation of Spectrophotometry methods for estimation
of linezolid in bulk and in pharmaceutical Dosage formulation
Rink R. Mali, Dr. A.P. Gorle
R.C. Patel Institute of Pharmaceutical Education & Research, Karwand Naka, Shirpur, Dist. Dhule, Maharashtra, INDIA
ABSTRACT
A simple, precise and economical, and rapid Spectrophotometric methods for the quantification of Linezolid in bulk material and in tablets. Further, this study is designed to validate the developed methods as per ICH guidelines. Material & methods: In Methods A and B, a stock standard solution was prepared by dissolving 10 mg of Linezolid in 100 mL of phosphate buffer pH 7.4 to obtain a concentration of 100 μg/mL. After suitable dilution, 10 μg/mL of Linezolid was prepared and scanned in the UV-visible range 400 –200 nm; In method A zero order spectrum Linezolid showed a maximum absorbance at 251 nm. while in Method B area under curve (AUC) zero-order spectrum was recorded between 245 and 268 nm. For a linearity study, series of dilutions were prepared from stock solutions. Results: In Method A and B, Linezolid followed linearity in the concentration range of 3 – 18 μg/mL with (r2 = 0.9978) (r2 = 0.9981). The accuracy of the method was checked by
recovery experiment performed at three different levels i.e., 80%, 100% and 120%. The % recovery was found to be in the range 96.15% – 99.32% for method A, while in method B range is 99.16 % - 100.20 %. The low values of % RSD are indicative of the accuracy and reproducibility of the method. The precision of the method was studied as an intra-day, inter-day variations and repeatability. The % R.S.D. value less than 2 indicate that the method was precise. Ruggedness of the proposed method was studied with the help of two analysts. The proposed method of pharmaceutical formulation the amounts of Linezolid estimated by both these methods (A and B) were found to be 96.25 ± 0.44 and 99.48 ± 1.05, respectively. Conclusion: The developed methods are simple, precise, rugged, and economical. Both these methods can be used for routine analysis of Linezolid from its tablet formulation.
Keywords: Linezolid, UV-Spectrophotometric methods, area under curve, zero order spectrum
Article Info:Received 18 March 2019; Review Completed 20 April 2019; Accepted 22 April 2019; Available online 15 May 2019 Cite this article as:
Mali RR, Gorle AP, Development and validation of Spectrophotometry methods for estimation of linezolid in bulk and in pharmaceutical Dosage formulation, Journal of Drug Delivery and Therapeutics. 2019; 9(3):60-65
http://dx.doi.org/10.22270/jddt.v9i3.2605 *Address for Correspondence:
Dr. A.P. Gorle, Associate Professor, R.C. Patel Institute of Pharmaceutical Education & Research, Karwand Naka, Shirpur, Dist. Dhule, Maharashtra, INDIA
INTRODUCTION
Linezolid is a synthetic antibiotic, the first commertially available of the 1, 3-oxazolidinone antibiotic class, used for the treatment of infections caused by multi-resistant bacteria including streptococcus and methicillin-resistant Staphylococcus aureus (MRSA).[1] Chemical name of Linezolid (LIN) 1is N-{[(5S)-3-[3-fluoro-4-(morpholin-4-yl)phenyl]-2-oxo- 1,3-oxazolidin-5-yl]methyl}acetamide. It has an empirical formula of C16H20FN3O4 and a molecular weight of 337.346 g/mol. [2] Linezolid is active after oral or intravenous administration. [3] It inhibits bacterial protein synthesis by actingat an early step and a site different from that of other AMAs. It binds to 23s fraction of the50s ribosome and interfere with formations of the ternary N-formylmethionine-t- RNA-70sinitiation complex. Binding of linezolid distorts the t-RNA binding site overlapping both 50sand 30s ribosomal subunits and stops protein synthesis before it starts. [4] Appropriate use of Linezolid is essential to minimize the risk of resistance development in Gram
positive bacteria. The availability of both parenteral and oral formulations provides the opportunity to transfer appropriate patients to an oral formulation. [5] Linezolid is administered as intermittent intravenous dose of 600mg every 12 h, without loading dose. [6]
Structure of Linezolid
Method[8], and HPTLC [9] methods were reported for this compound.
UV spectrophotometric method was reported for the quantitative determination of Linezolid in pharmaceutical dosage forms. The developed method was simple, precise, specific and accurate analysis proved that method is reproducible and selective for the analysis of Linezolid in bulk drug and tablet.
EXPERIMENTAL WORK
Instrument:
A double beam UV-VIS spectrophotometer (UV-2450, Shimadzu, Japan) connected to computer loaded with spectra manager software UV Probe with 10 mm quartz cells was used. The spectra were obtained with the instrumental parameters as follows: Wavelength range: 200 – 400 nm; scan speed: Medium; sampling interval: 1.0 nm.
Material and Methods:
Active Pharmaceutical Ingredient (API) of Linezolid supplied by ALEMBIC Pharmaceutical
Limited, Vadodara, India) As the tablet formulation was available in Indian market, LIDOMAX-600mg tablets were used as pharmaceutical formulation for further analysis. Solvent used for preparation of solution is phosphate buffer pH 6.4, phosphate buffer pH 7.4 and Methanol.
Preparation of solvent:
Phosphate buffer pH 6.4 : Dissolve 1.79gm of disodium hydrogen phosphate, 1.36gm of potassium dihydrogen phosphate and 8.0 gm of sodium chloride in sufficient water to produce 1000ml. and adjust the pH, if necessary.
Phosphate buffer pH 7.4 : Dissolve 2.38 gm of disodium hydrogen phosphate, 0.19 gm of potassium dihydrogen phosphate and 8.0 gm of sodium chloride in sufficient water to produce 1000ml. and adjust the pH, if necessary.[10]
Preparation of standard stock solution:
A standard stock solution of Linezolid was prepared by dissolving accurately weighed 10mg of the drug in phosphate buffer pH 7.4 in 100ml volumetric flask, sonicate and to obtain the concentration of 100 µg/ml for method A and B . Methods:
A. Zero order UV spectrophotometric method : Determination of wavelength:
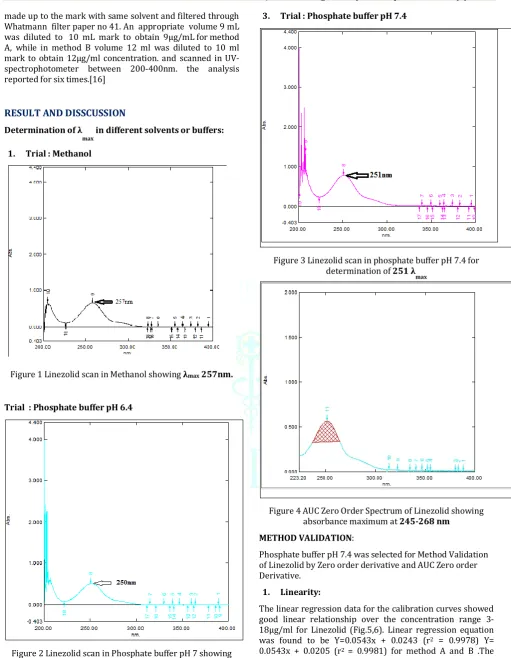
1. Methanol: From the standard stock solution; 1 ml (100 µg/ml) was diluted with 10 ml methanol to obtain the concentration of 10 µg/ml. and this solution was scanned in the UV-region 400 - 200nm. Linezolid showed λmax at 251nm (Fig.1)
2. Phosphate buffer pH 6.4 : From the standard stock solution; 1 ml (100 µg/ml) was diluted with 10 ml Phosphate buffer pH to obtain the concentration of 10 µg/ml. and this solution was scanned in the UV-region 400 - 200nm. Linezolid showed λmax at 251nm (Fig.2) 3. Phosphate buffer pH 7.4: From the standard stock
solution; 1 ml (100 µg/ml) was diluted with 10 ml solvent to obtain the concentration of 10 µg/ml. and this solution was scanned in the UV-region 400 - 200nm. Linezolid showed λmax at 251nm (Fig.3)
B. Area under curve UV spectrophotometric method:
Determination of wavelength : From the standard stock solution; 1 ml (100 µg/ml) was diluted with 10 ml Phosphate buffer pH 7.4 to obtain the concentration of 10 µg/ml. and this solution was scanned in the UV-region 400 - 200nm. Linezolid shows maximum absorbance at 251nm. And the AUC of zero order spectrum was recorded between 245 – 268nm. (Fig.4)[11]
Validation of The Method: 1. Linearity:
Different aliquots of linezolid in range 3 – 1.8 ml were transferred into series of 10 ml volumetric flasks and the volume was made up to the mark with water to get concentrations 3,6,9,12,15, and 18 μg/ml, for method A and method B.
2. Accuracy (% Recovery):
To the pre analyzed sample solutions, a known amount of standard stock solution was added at different levels i.e. 80%, 100% and 120%. The solutions were reanalyzed by proposed method.[12]
3. Precision:
Precision of the method was studied as intraday and inter-day variations. For method A and B Intra-inter-day precision was determined by analyzing the 9,12 and 15 μg/ml of Linezolid solutions for three times in the same day. Inter-day precision was determined by analyzing the 12 , 15 and 18 μg/ml of Linezolid solutions daily for three days over the period of week.[13]
4. LOD and LOQ (Sensitivity):
The sensitivity of measurements of Linezolid by the use of the proposed method was estimated in terms of the Limit of Quantification (LOQ) and Limit of Detection (LOD). The LOQ and LOD were calculated using equation LOD = 3.3 x N/B and LOQ = 10 x N/B, where, ‘N’ is standard deviation of the peak areas of the drugs (n =3), taken as a measure of noise, and ‘B’ is the slope of the corresponding calibration curve.[14]
5. Repeatability:
Repeatability was determined by analyzing 5 μg/ml foe method A, while in method B 8 µg/ml concentration of Linezolid solution for six times.
6. Ruggedness:
Ruggedness of the proposed method is determined for 12 μg/ml concentration of by analysis of dilution from homogenous slot by two analysts using same operational and environmental conditions. For method A and B.
7. Analysis Of Bulk Material :
From the standard stock solution of Linezolid, an appropriate volume 9 ml was diluted to 10 ml mark to obtain 9 µg/ml for method A , while in method B volume 12ml was diluted to 10 ml mark to obtain 12µg/ml the resulting solution was scanned in UV-spectrophotometer between 200-400 nm. The spectrum was recorded at 251nm.[15]
8. Analysis Of Tablet Formulation:
made up to the mark with same solvent and filtered through Whatmann filter paper no 41. An appropriate volume 9 mL was diluted to 10 mL mark to obtain 9µg/mL for method A, while in method B volume 12 ml was diluted to 10 ml mark to obtain 12µg/ml concentration. and scanned in UV-spectrophotometer between 200-400nm. the analysis reported for six times.[16]
RESULT AND DISSCUSSION
Determination of λ
max in different solvents or buffers:
1. Trial : Methanol
Figure 1 Linezolid scan in Methanol showing λmax 257nm.
2. Trial : Phosphate buffer pH 6.4
Figure 2 Linezolid scan in Phosphate buffer pH 7 showing λmax 250nm.
3. Trial : Phosphate buffer pH 7.4
Figure 3 Linezolid scan in phosphate buffer pH 7.4 for determination of 251 λ
max
Figure 4 AUC Zero Order Spectrum of Linezolid showing absorbance maximum at 245-268 nm
METHOD VALIDATION:
Phosphate buffer pH 7.4 was selected for Method Validation of Linezolid by Zero order derivative and AUC Zero order Derivative.
1. Linearity:
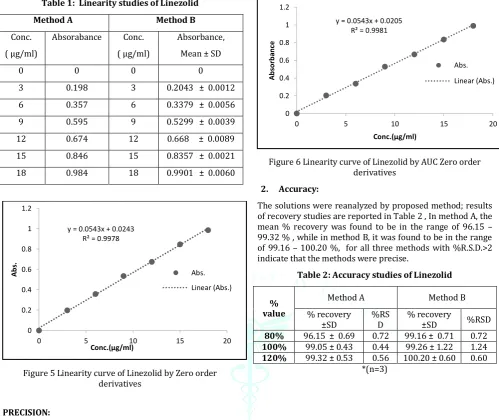
The linear regression data for the calibration curves showed good linear relationship over the concentration range 3-18μg/ml for Linezolid (Fig.5,6). Linear regression equation was found to be Y=0.0543x + 0.0243 (r2 = 0.9978) Y=
0.0543x + 0.0205 (r2 = 0.9981) for method A and B .The
Table 1: Linearity studies of Linezolid
Method A Method B
Conc. ( μg/ml)
Absorabance Conc. ( μg/ml)
Absorbance, Mean ± SD
0 0 0 0
3 0.198 3 0.2043 ± 0.0012
6 0.357 6 0.3379 ± 0.0056
9 0.595 9 0.5299 ± 0.0039
12 0.674 12 0.668 ± 0.0089
15 0.846 15 0.8357 ± 0.0021
18 0.984 18 0.9901 ± 0.0060
Figure 5 Linearity curve of Linezolid by Zero order derivatives
Figure 6 Linearity curve of Linezolid by AUC Zero order derivatives
2. Accuracy:
The solutions were reanalyzed by proposed method; results of recovery studies are reported in Table 2 , In method A, the mean % recovery was found to be in the range of 96.15 – 99.32 % , while in method B, it was found to be in the range of 99.16 – 100.20 %, for all three methods with %R.S.D.>2 indicate that the methods were precise.
Table 2: Accuracy studies of Linezolid
% value
Method A Method B
% recovery
±SD %RSD % recovery ±SD %RSD 80% 96.15 ± 0.69 0.72 99.16 ± 0.71 0.72
100% 99.05 ± 0.43 0.44 99.26 ± 1.22 1.24
120% 99.32 ± 0.53 0.56 100.20 ± 0.60 0.60
*(n=3)
3. PRECISION:
The precision of the developed method was expressed in terms of % relative standard deviation (% RSD). These result shows reproducibility of the assay. The % R.S.D. values found to be less than 2, so that indicate this method precise for the determination of both the drugs in formulation (Table 3)
Table 3: Precision studies of Linezolid
Methods (μg/ml) Conc. Intra-day precision Inter-day precision
Amount found* % RSD Amount found* % RSD
A
9 8.94 0.57 8.91 0.70
12 11.97 0.84 11.96 0.93
15 14.94 0.82 14.86 0.43
B
12 11.99 0.62 11.89 0.77
15 14.91 0.69 14.88 0.49
18 17.84 0.70 17.87 0.77
4. SENSITIVITY:
The linearity equation was found to be Y=0.1353x – 0.0558 (r2 = 0.9982). The LOQ and LOD for Linezolid were found to
be 0.28 μg and 0.85 μg, for method A. while in method B linearity equation was found to be y = 0.1382x – 0.0812 (r²= 0.9962). The LOQ and LOD for Linezolid were found to be 0.48 μg and 1.47 μg respectively (Table 4)
Table 4: Sensitivity studies of Linezolid
Methods Linear regression equation LOD (µg/ml) LOQ(µg/ml)
A y = 0.1353x – 0.0558 (r²= 0.9982) 0.28 0.85
B y = 0.1382x – 0.0812 (r²= 0.9962) 0.48 1.47
y = 0.0543x + 0.0243 R² = 0.9978
0 0.2 0.4 0.6 0.8 1 1.2
0 5 10 15 20
Ab
s.
Conc.(µg/ml)
Abs.
Linear (Abs.)
y = 0.0543x + 0.0205 R² = 0.9981
0 0.2 0.4 0.6 0.8 1 1.2
0 5 10 15 20
Ab
so
rb
an
ce
Conc.(µg/ml)
Abs.
5. REPEATABILITY:
Repeatability was determined for selected concentrations of Linezolid solution for six times and the % amount determined with % RSD less than 2 for all the two methods. The results are expressed in Table 5.
Table 5: Repeatability studies of Linezolid
Methods Amount taken (µg/ml) Amount found* % Amount found*± SD % RSD
A 5 4.91 98.35 ±1.54 1.57
B 8 7.94 99.31 ± 1.30 1.32
6. Ruggedness
Peak area was measured for same concentration solutions, six times. The results are in the acceptable range for the drugs. The results are given in Table *. The result showed that the % R.S.D. was less than 2 %.( Table 6)
Table 6: Ruggedness studies of Linezolid
Methods (µg/ml) Conc. Analyst I Analyst II
% Amount found*± SD % RSD % Amount found*± SD % RSD
A 12 99.24 ± 1.42 1.43 99.32 ± 0.92 0.94
B 12 99.45 ± 1.37 1.38 99.01 ± 1.22 1.23
7. Determination of Linezolid in bulk:
The concentrations of the drug were calculated from linear regression equations. The % amount found was between % to % (Table 7).
Table 7: Analysis of Linezolid in bulk
Methods Amount taken (µg/ml) Amount found* % Amount found*± SD % RSD
A 9 8.72 96.98 ± 0.31 0.32
B 12 11.98 99.88 ± 0.93 0.93
8. Analysis of Linezolid in tablet formulation:
The spectrum was recorded at 251nm. The concentrations of the drug were calculated from linear regression equation. The % amount was found between % to % (Table 8).
Table 8: Analysis of Linezolid in tablet formulation
Methods Amount taken (µg/ml) Amount found* % Amount found*± SD % RSD
A 9 8.66 96.25 ± 0.44 0.45
B 12 11.93 99.48± 1.05 1.06
CONCLUSION
The spectrophotometric both developed methods are economical, simple, accurate, precise and rugged, and can be used for the usual study of Linezolid from its pharmaceutical formulations. The methods are developed for quantification on Linezolid in tablets. It is also used in routine quality control of the formulations containing Linezolid.
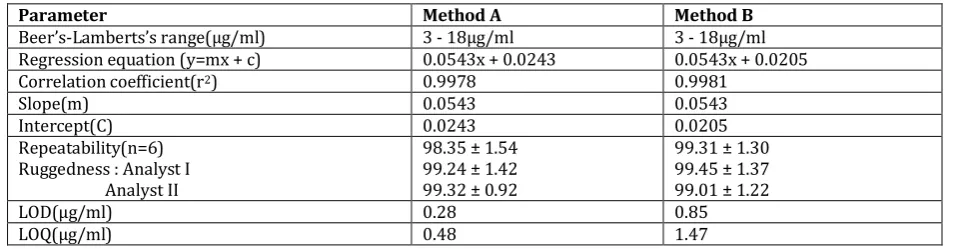
Parameter Method A Method B
Beer’s-Lamberts’s range(µg/ml) 3 - 18µg/ml 3 - 18µg/ml
Regression equation (y=mx + c) 0.0543x + 0.0243 0.0543x + 0.0205
Correlation coefficient(r2) 0.9978 0.9981
Slope(m) 0.0543 0.0543
Intercept(C) 0.0243 0.0205
Repeatability(n=6) Ruggedness : Analyst I Analyst II
98.35 ± 1.54 99.24 ± 1.42 99.32 ± 0.92
99.31 ± 1.30 99.45 ± 1.37 99.01 ± 1.22
LOD(µg/ml) 0.28 0.85
REFERENCES
1. Nagaraju PT, Sreenivasa Rao M, Ravi Kumar C, Mabhasha D, K Venu Gopal, UV-Spetrophotometric Method Development And Validation For Determination of Linezolid In Pharmaceutical Dosage Form, Research And Reviews: Journal of Pharmaceutical Analysis, 2014; 3(3):23 - 27. 2. Ravisankar Panchumartha, Amusha Ranikancherla, A Simple
Developement And Validation Reverse Phase HPLC Method For The Determination of Linezolid In Bulk And Pharmaceutical Dosage Form, American Journal of Pharmacy And Health Research, 2014; 2 (9):2321- 3647.
3. Sapavadiya VK Sapavadiyab MV, Shelata PK, Lalwani AN, Development And Validation of New RP-HPLC Method For The Estimation of Linezolid In Linezolid Gel, International Journal Pharmacy And Pharmaceutical Sciences, 2015; 7(4):250- 254.
4. Verma A, Rathor DS, Vidyasagar G, Development And Validation of RP-HPLC Method For Simultaneous Estimation of Cefexime And Linezolid, International Journal of Pharmacy & Life Sciences, 2016; 7(8):5130 - 5134.
5. Vanitha P, Thimmaraju MK, Raghunandan N, Development And Validation of UV Spectrophotometric Method For The Estimation of Linezolid In Bulk And Pharmaceutical Formulation, International Journal of Pharmacy And Pharmaceutical Science Research, 2012; 2(3):57 - 60. 6. Serena Fortuna, Gennaro De Pascale, Enzo Ragazzoni,
Massimo Antonelli, Validation of A New HPLC -UV Method For Determination of The Antibiotic Linezolid In Human Plasma And In Bronchoalveolar Lavage, Journal of Biomedical Chromatography. 2013; 27:1489 - 1496 7. Shah H, Patel P, Patel K, Mr. Sagar Solanki, Method
Development And Validation of Spectrophotometric Methods For Simultaneous Estimation of Cefiximetrihydrate And Linezolid In Their Combined Tablet Dosage Form, International Journal Pharmaceutical Research And Bio-Sciences, 2012; 1(5):516 - 529.
8. Ch. Lakshmi Narayana A, T. Suresh A, S. Mahender Rao, A Validated Chiral HPLC Method For The Enantiomeric Separation of Linezolid on Amylose Based Stationary Phase,
Journal Of Pharmaceutical And Biomedical Analysis, 2003; 32:21 - 28.
9. S.A. Patel, P.U. Patel , N.J. Patel, M.M. Patel, High Performance Thin Layer Chromatographic Method For Estimation Of Linezolid In Tablets, Indian Journal Of Pharmaceutical Sciences,2007; 69(4):571- 574.
10. Indian Pharmacopeia, Government of India ministry of health and family welfare, published by Indian Pharmacopoeia commission, Ghaziabad,2014, volume I, Pg.no.761.
11. Tulsibhai GD, Laxmanbhai BH, Spectrophotometric Method Development and Validation for Estimation of Linezolid in Tablet Dosage form, Journal of Research in Pharmacy, ; 3(3):06-12.
12. Naik A.D., Pai S.P.N. , Spectrophotometric Method for Estimation of Linezolid in Tablet Formulation , Asian Journal of Biomedical and Pharmaceutical Sciences, 2013; 3(21):4-6. 13. Ribadiya C, Ribadia H, Talaviya N, Joshi C, Parmar A,
Development And Validation Of First Order Derivative Method For Simultaneous Estimation Of Cefixime Trihydrate And Linezolid In Its Combined Tablet Dosage Form, International Bulletin Of Drug Research,2013; 3(5):49-57. 14. Sushma S. ,Pushpa Latha E, Method Development And
Validation Of Spectrophotometric Method For The Estimation Of Linezolid In Pure And Tablet Dosage Form, Asian Journal Of Pharmaceutical Analysis And Medicinal Chemistry,2015; 3(2):82 - 88.
15. Bh. Saikiran, Sk. Johnny, P. Leela Madhuri, Uv Spectroscopic Method For Estimation Of Linezolid In Tablets, International Journal Of Pharmaceutical, Chemical And Biological Sciences, 2013; 3(3):729-731.
16. Patel SA, Patel JV, Spectrophotometric methods for simultaneous estimation of cefixime trhydrate and Linezolid in tablet dosage form, International Research Journal of Pharmacy, 2013; 4(1):161-164.