http://www.sciencepublishinggroup.com/j/ijepe doi: 10.11648/j.ijepe.20170606.13
ISSN: 2326-957X (Print); ISSN: 2326-960X (Online)
Behavior of Harmonic Current Rates Generated by Linear,
Nonlinear and Mixed Loads in Niamey Services
Daouda Abdourahimoun, Madougou Saïdou
*Department of Physics, High School of Education, University Abdou Moumouni of Niamey, Niamey, Niger
Email address:
[email protected] (D. Abdourahimoun), [email protected] (M. Saïdou) *Corresponding author
To cite this article:
Daouda Abdourahimoun, Madougou Saïdou. Behavior of Harmonic Current Rates Generated by Linear, Nonlinear and Mixed Loads in Niamey Services. International Journal of Energy and Power Engineering. Vol. 6, No. 6, 2017, pp. 100-107.
doi: 10.11648/j.ijepe.20170606.13
Received: October 23, 2017; Accepted: November 6, 2017; Published: December 11, 2017
Abstract:
Since the discovery of electric energy, several improvements have been made by scientists, so that, suppliers can permanently guarantee a quality power to customers. In addition, the introduction of high-tech equipments in all sectors of activity has increased the level of harmonic disturbances in electricity distribution networks. Thus, power systems are subjected to harmonic disturbances injected by these loads and entail effects on the equipments of the distribution network itself and on that of the customers connected there to. In Niger, thereis a constant increase in these types of loads, although there is no complete renewal of energy consuming loads (incandescent bulbs, Cathode Ray Tube (CRT) televisions, fans, etc.). It is necessary to study the behavior of the harmonic rate generated by these loads connected to the distribution network in order to anticipate on the consequences [1]. This article presents a study on the behavior of harmonic distortion rate in current generated by linear, nonlinear and mixed loads in offices at Niamey, Niger. Using an electric analyzer (CA8220), a study on the behavior of harmonic distortion rate in current generated by linear, nonlinear and mixed appliances was conducted. To do this, it studied the variation of the harmonic content by acting on polluting loads (a compressor and an air conditioner), very polluting loads (a computer and an ultrasound machine) and a pure load (a water heater). The results show that a combined and simultaneous use of appliances with nonlinear and linear loads (mixed loads) makes it possible to attenuate the overall harmonic rate, compared to a use of the nonlinear loads alone in the network.Keywords:
Linear Loads, Nonlinear Loads, Analyzer, Total Harmonic Distortion (THD), Impact of Harmonic1. Introduction
Today, with the evolution of technologies, the electronic devices (Alterative Current AC and Direct Current DC) become the important tools in our uses [2]. Similarly, these devices generate harmonics which become a permanent electrical fault in the power distribution network. The use of electronic devices in an electrical installation impacts the quality of the electricity network and the proper functioning of the equipments [3].
In Africa, particularly in Niger, the criteria for connecting a site to the distribution network are mainly based on sufficient electrical power to serve subscribers connected to the distribution network. However, the nature of the load impedance affects the quality of the electrical power in the
network. This quality of electric power is more important in sensitive institutions like the hospitals, airports, industries, etc. [4].
followed by materials and methods and finish with the presentation, analysis and interpretation of the results.
2. Linear Loads, Nonlinear Loads and
the Electric Harmonic
2.1. Linear Loads and Nonlinear Loads
Devices or equipments connected to the power distribution network are either linear loads or nonlinear loads. The linear
loads call an electric current having the same wave form as the electrical source, while the nonlinear loads receivers consume a current not having the same waveform as its electrical source [6]. The latter affect the quality of electrical power, particularly the wave form of the electrical signal [7]. Figure-1 gives an example of a nonlinear load: an asynchronous motor equipped with a variable speed drive, consuming a current not having the same waveform as its electrical source.
Figure 1. Asynchronous motor with variable speed drive [7].
2.2. Quality of the Wave of the Voltage and the Electric Current
The electrical harmonics created by the nonlinear loads bring an additional current but with frequencies multiple to that of the fundamental one. This variation in the frequency delivered (of the wave form) affects the wave quality of the current (of the voltage). The presence of these harmonics affects the proper functioning of subscribers’ electrical appliances and electro-technical equipment of the distribution network [3]. The experiment by Shraddha Dhumal and al., (2015) shows that, the presence of linear loads does not inject harmonics and that the nonlinear loads generate high harmonics [8].
2.3. Harmonic Distortion Rate
Several physical quantities exist to describe the level of harmonic distortion. Total Harmonic Distortion (THD) and its derivatives are generally used in the algorithms of electrical network analyzers to assess the quality level of the distributed electricity [9].
2.3.1. The Overall Harmonic Distortion Rate
It represents the ratio of the effective value of the
harmonics Yn to the effective value of the fundamental Y1
[10].
% = 100 ∑ (1)
Where, Yn is the effective value of (n-1) harmonics and Y1
is the effective value of the fundamental.
2.3.2. Individual Distortion Rate
The Individual Total Harmonic Distortion (THDI) is calculated with the ratio of the effective value of the harmonic of n order on the effective magnitude of the fundamental [10].
% = 100 (2)
2.4. Standard of Electrical Harmonics
contractual values for the individual harmonic rate generated by the devices [12].
These devices are classified according to their type and power rate, hence leading to the following allotment:
- Class A: this label is attributed to balanced three-phase devices of IEC 61000-3-2;
- Class B: it contains portable devices;
- Class C: these are lighting fixtures including lightning dimmers with the power rate greater than 25 W;
- Class D: it combines special wave signal equipment with a power rate equal or less than 600 W.
Table 1. Individual harmonic rates injected by devices with a current equal or less than 16 A [12].
Harmonic h Class A [A] Class B [A] Class C [% fundamental] Class D [mA/W]
Odd Harmonics
3 2.3 3.45 30*λ 3.4
5 1.14 1.71 10 1.9
7 0.77 1.155 7 1
9 0.4 0.6 5 0.5
11 0.33 0.495 3 0.35
13 0.21 0.315 3 3.85/13
15≤h≤39 0.15×15/h 0.225×15/h 3 3.85/h
Even harmonics
2 1.08 1.62 2 -
4 0.43 0.645 - -
6 0.3 0.45 - -
8 0.23×8/h 0.345×8/h - -
: is the power factor.
Likewise, these devices must respect the level of compatibility of the harmonic voltages on the low voltage distribution network [12]. This is the IEC 6100-2-2 standard detailed in Table-2.
Table 2. Compatibility level of the individual harmonic voltages on the low voltage electrical network.
Odd Harmonics not Multiples of 3 Odd Harmonics Multiples of 3 Even Harmonics
Harmonic Order H Harmonic voltage% Harmonic Order h Harmonic voltage% Harmonic voltage h Harmonic voltage%
5 6 3 5 2 2
7 5 6 1.5 4 1
11 3.5 9 0.3 6 0.5
13 3 12 0.2 8 0.5
17 2 15 0.2 10 0.5
19 1.5 >21 12 0.2
23 1.5 >12 0.2
25 1.5
>25 0.2+0.5×25/h
3. Materials and Methods
The study of the behavior of harmonic rates in the presence of electrical loads was carried out in the maintenance department of the Niamey Reference Maternity Hospital (Issaka Gazoby Maternity). To do so, a CA 8022 analyzer (Figure-2a) is used to record the harmonic rate of the loads used (Figure-2b). Note that the analyzer has an accuracy of less than 0.1%.
All loads are single-phased with a 220 V supply. Table-3 shows the power ratings of the devices used.
Table 3. Power rate of each of the devices (loads) used.
Loads Power
Lap top 65 W
Ultrasound Machine 400 W
Air Compressor 750 W
air-conditioner 1980 W
Water heater 1850 W
4. Results
4.1. Presentation of the Results
4.1.1. Water Heater
The water heater used for this experiment is purely resistive (linear load). It can clearly see in Figure-3 that the voltage and the current have the same waveform.
Figure 3. Presentation of the waveform signal of the 2200 W water heater.
4.1.2. Air-Conditioner
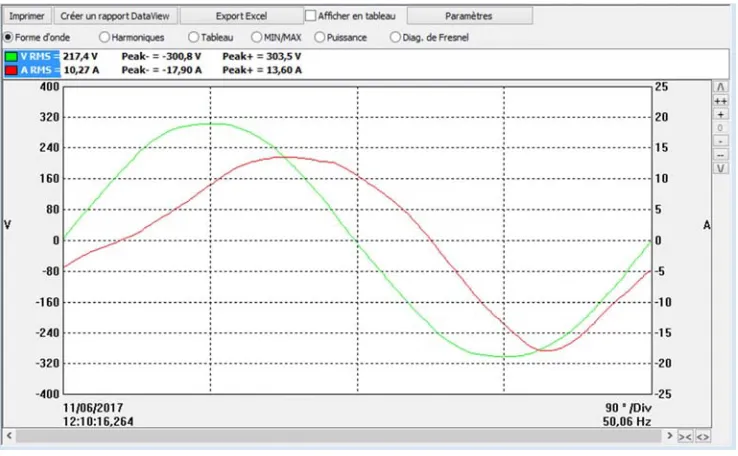
The signal pattern of Figure-4 below is the result obtained from the measurement taken at the terminals of the air-conditioner (non-linear load).
Figure 4. Presentation of the wave form of an air conditioner power rated 1980 W.
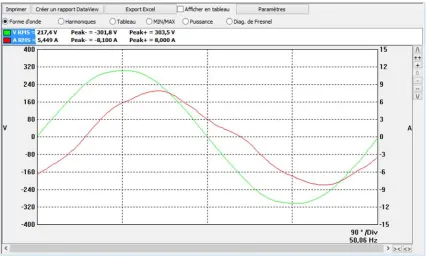
4.1.3. Air Compressor
more harmonic disturbances.
Figure 5. Presentation of the waveform of a 750 W air compressor.
4.1.4. Ultrasound Machine
Knowing that electronic devices are sources of harmonic disturbances, it is quite obvious that the analyzer records a distorted signal for the ultrasound waveform (highly polluting nonlinear load for its case) as illustrated in Figure-6.
Figure 6. Presentation of the waveform of the 400 W ultrasound machines.
4.1.5. Laptop
Figure 7. Presentation of the waveform of a 65 W computer.
4.2. Evolution of the Harmonic Rates Produced by the Combination of Linear and Non-Linear Loads
To carry out our experiment, it has made different combinations of nonlinear and linear loads in order to have all the cases studied: nonlinear loads, linear loads and mixed loads (linear and nonlinear). The summary of the different cases is given in Table-4 below.
Table 4. Different combinations of studied nonlinear, linear and mixed loads (linear and nonlinear).
Code Loads
1 Laptop (PC)
2 PC + Ultrasound machine
3 PC+ Ultrasound machine +Heater
4 PC + Ultrasound machine +Heater +Air Compressor
5 PC + Ultrasound + Heater+ Air Compressor + Air conditioner
6 Heater+ Air Compressor +Air conditioner
7 Air Compressor +Air conditioner
8 PC+ Heater
Figure-8 illustrates the behavior of the harmonic rate of the first part of our system. It has five periods including the different combinations of the devices.
Figure 8. Variation of the harmonic rate produced by the combination of the linear and non-linear loads of the first part of our system (five phases).
Figure-9 illustrates the behavior of the harmonic rate of the second part (periods 6, 7 and 8). It involves three periods.
4.3. Analysis of Results
Tables 5 and 6 summarize respectively the overall harmonic current rate of each device separately and the variation of the harmonic rate as a function of the combinations of these devices.
Table 5. Overall harmonic current rates of each load separately.
Loads THDA (%)
Laptop 197.9
Ultrasound machine 64.4
Air Compressor 6.9
Air-conditioner 21.1
Water heater 1.3
Table 6 shows the variation of harmonic current rates according to the different combinations of the devices.
Table 6. Variation of harmonic current rates according to the different combinations of the devices.
Code Loads THDA
1 PC 197.9
2 PC + Ultrasound machine 64.4
3 PC + Ultrasound machine + heater 4.9
4 PC + Ultrasound + Heater + Air Compressor 5.2
5 PC + Ultrasound + Heater + Air Compressor +Air
conditioner 8.4
6 Heater+ Air Compressor + Air conditioner 7.9
7 Air Compressor +Air conditioner 13.44
8 PC + Heater 2.82
4.4. Interpretation of Results
In period 1, a very high rate was obtained with only the operation of the computer which is a very polluting nonlinear load, resulting in 197.9% THDA. When it switched on the ultrasound machine (period 2), it notice a significant decrease in the harmonic current rate, although it is still harmful (THDA = 64.9%). This confirms the results of the work of Gupta S. D. and al., (2016) which showed that the harmonic rate injected by the combination of two nonlinear devices is lower than that generated individually. In period 3, when the water heater was combined with the period 2 combination, this rate fell to a very low level of 4.9%. This period denotes that the resistance (linear load) significantly attenuates the harmonic disturbances even though it is power consuming. The harmonic current level is incremented from the moment when the air compressor and the air conditioner are switched on respectively in period 4 and period 5. During these two periods, the presence of the air compressor and/or the air conditioner has created a slight increase in harmonic disturbance compared to period 3. In second part, it was demonstrated that the period 6 describes a significant attenuation of the harmonic rate due to the water heater in the presence of non-linear loads, both energy-consuming.
However the combination made in period 7, reiterates a decrease in harmonic disturbance. The last period (period 8) which is the combination of the most polluting load (linear loads) led to the best result (THDA = 2.82%).
5. Conclusion
This experiment made it possible to observe the variation in harmonic rates resulting from the use of nonlinear and linear loads. With the computer, we obtained a harmonic content in current of 197.9%. By combining a highly polluting load (PC) and a moderately polluting (ultrasound machine), the harmonic rate was reduced by 134.5% (getting 64.4%). The addition of a purely resistive load (the water heater) to the previous devices brought about a significant reduction of 60% of the above mentioned harmonic disturbance value, i.e. 5.2% of the overall recorded harmonic rate at current.
It can be seen that the presence of linear charges significantly attenuates the harmonic disturbances even though they are power consuming. These linear loads which are useful for maintaining the quality of electrical power, particularly the waveform of the electrical signal, must exist in the subscriber's equipments even if the new energy efficiency policy of the WAEMU (West African Economic and Monetary Union) tends to replace them. Therefore, even if they have to be replaced, let it be with less energy-consuming linear loads in order to maintain a balance in the balance sheet of harmonic rates.
Moreover, this work shows indeed that the policy of promoting renewed and renewable energies and their efficiency needs to be accompanied by tracking and monitoring electrical disturbances mainly harmonics. For this purpose, research on distribution of electrical loads is necessary including a longer period to see the importance of the behavior of harmonic current in the power distribution network.
References
[1] Farooq, Haroon, Chengke Zhou, and Mohamed Emad Farrag. "Analyzing the harmonic distortion in a distribution system caused by the non-linear residential loads." International Journal of Smart Grid and Clean Energy 2.1 (2013): 46-51. [2] Chaoui, Abdelmadjid. Filtrage actif triphasé pour charges non
linéaires. Thèse de doctorat. Université de Poitiers, en cotutelle avec l’Université Ferhat Abbas de Setif, (2010). 287 pages. [3] Farooq, Haroon, et al. "Investigating the power quality of an
electrical distribution system stressed by non-linear domestic appliances." Proc. Int. Conf. Renewable Energies Power Qual. (2011).
[4] DAOUDA Abdourahimoun, MADOUGOU Saïdou and IBRAHIM Abdoul-Azziz. "Global Harmonic Rate Assessment in the Electricity Distribution Network in Niamey City: Case studies of Domestic, Industrial and Hospital Substations. Energy and Power Engineering". (2017). Volume 9, N°12. in press.
[6] Rao, Raneru Nageswara. "Harmonic Analysis of Small Scale Industrial Loads and Harmonic Mitigation Techniques in Industrial Distribution System." International Journal of Engineering Research and Applications 3.4 (2013): 1511-1540.
[7] Éric Félice, Philippe Révilla. "Qualité des réseaux électriques et efficacité énergétique". Technique et Ingénierie; Edition Dunod. (2009). 208 pages.
[8] Shraddha Dhumal, Jalaja Gundi Poonam Khirid, Manashri Yadav and M. D. Tuljapurkar. "Detection of Harmonics in Distribution System Using FFT with Case Studies". International Journal for Scientific Research & Development. Vol. 3, Issue 04. (2015).
[9] Radil, Tomas, and Pedro M. Ramos. "Methods for estimation
of voltage harmonic components". Power Quality. Mr Andreas Eberhard (Ed.), ISBN: 978-953-307-180-0, InTech, (2011). 17 pages.
[10] FranciscoDe la Rosa, "Harmonics and power systems". Electric Power Engineering Series, 1st Edition, CRC press Book, 2006. 208 pages.
[11] Ignatova, Vanya. "Méthodes d'analyse de la qualité de l'énergie électrique. Application aux creux de tension et à la pollution harmonique". Thèse de doctorat. Université Joseph-Fourier, Grenoble I, (2006). 171 pages.
![Figure 1. Asynchronous motor with variable speed drive [7].](https://thumb-us.123doks.com/thumbv2/123dok_us/8486463.1715343/2.595.145.450.203.444/figure-asynchronous-motor-variable-speed-drive.webp)
![Table 1. Individual harmonic rates injected by devices with a current equal or less than 16 A [12]](https://thumb-us.123doks.com/thumbv2/123dok_us/8486463.1715343/3.595.147.451.592.748/table-individual-harmonic-rates-injected-devices-current-equal.webp)