Comparative Analysis of Canny and Prewitt Edge Detection
Techniques used in Image Processing
Nisha
1, Rajesh Mehra
2, Lalita Sharma
3PG Scholar , Dept. of ECE , NITTTR, Chandigarh , India1 Associate Professor, Dept. of ECE , NITTTR, Chandigarh, India2
PG Scholar , Dept. of ECE, NITTTR , Chandigarh, India3
Abstract — An edge may be defined as the curve that
follows a path of rapid change in image intensity and it forms a boundary between two different regions in an image. Edge detection plays an important role in digital image processing and is used for image segmentation, data extraction, data compression. In this paper, two edge detection algorithms namely canny edge detection and prewitt edge detection techniques are used to extract edges from different images. Performance factors are analyzed in terms of processing time and accuracy on the basis of Peak signal to Noise Ratio (PSNR) and Mean Squared Error (MSE). MATLAB is used for edge detection. From the experimental results, it is observed that canny edge detection technique results better than prewitt edge detection technique.
Keywords — Canny edge detection technique, Edge
detection, Image processing, MSE, Prewitt edge detection technique, PSNR.
I. INTRODUCTION
Edge detection is the process of identifying and locating sharp discontinuities in an image. It have been used by object recognition, target tracking, object detection etc. Segmentation partition the image into a set of disjoint regions that are uniform and meaningful with respect to some characteristics to enable easy image analysis. Image processing is used in many applications like video surveillance, traffic management and medical imaging. Edge detection is the process of locating an edge of an image. Edges can be classified based upon their intensity profiles like step edge, ramp edge, ridge edge, roof edge. Edge detection can be done in four steps smoothing, enhancement, detection and localization [1]. Prewitt, Robert, Sobel and canny are edge detection algorithms. In edge detection, we used two types of operators namely gradient based edge detection and laplacian based edge detection. The objective of edge detection is to discover the information about the shapes and the reflectance or transmittance in an image and every detector is used to avoid false edges and detected edges should closest to reference edges [2][3]. Edges can be classified based upon their intensity profiles
like step Edge, Ramp Edge, Ridge Edge, roof Edge as shown in Fig. 1.
Convex roof Edge Concave roof Edge
Concave ramp Edge Step Edge
Bar Edge Fig. 1. Types of Edges [4]
Fig. 2: Four steps of edge detection
1
.
Imagesmoothing:-
This step involves filtering the image for noise reduction and improving the performance of edge detector.2. Enhancement :- This step related with improving the quality of the digital image. We use filter to enhance the quality of the edges in the image.
3. Detection :- Extracting all edge points and determine which edge pixels should be discarded as noise.
4. Localization :- This step used for determine the exact location of an edge (sub- pixel resolution might be required for some applications. It estimate the location of an edge to better than the spacing between pixels).
This paper is organized as follow: Section I gives the introduction of the edge detection, various steps of edge detection methods and its purpose. Section II includes edge detection techniques. After that, Prewitt edge detection and canny edge detection is discussed in Section III. Section IV presents the experimental results and analysis by PSNR and MSE value. The last Section V concludes the paper followed by the references.
II. EDGE DETECTION TECHNIQUES
The edge detection algorithms can be generally classified based on the behavioural study of edges with respect to the operators. Different edge-detection approaches can be broadly classified under classical or gradient based edge detectors (first derivative), Zero crossing (second derivative) and optimal edge-detector [7].
Table I
EDGE-DETECTION APPROACHES [7]
There are many ways to perform edge detection. However, the majority of different methods may be grouped into two categories namely Gradient and Laplacian.
1. Gradient:- The gradient method detects the edges by looking for the maximum and minimum in the first derivative of the image.
2. Laplacian:- The laplacian method searches for zero crossings in the second derivative of the image to find edges. An edge has the 1D shape of a ramp and calculating the derivative of the image can highlight its location.
Suppose we have the following signal, with an edge shown by the jump in intensity as shown in Fig. 3 below [8] :
Fig. 3: Intensity graph of a signal [8]
If we take the gradient of this signal (which is in one dimension, is just the first derivative with respect to time t), we get Fig. 3 [8]. Clearly, the derivative shows a maximum located at the centre of the edge in the original signal. This method of locating an edge is characteristics of the „gradient filter” family of edge detection filters and includes the sobel method. In any image, image gradient is a directional change in the intensity and it is used to extract information from images. The gradient of the image is one of the fundamental building blocks in image processing. Once a threshold is set, you can compare the gradient value to the threshold value and detect an edge whenever the threshold is exceeded as shown in Fig. 4[8]:
Fig. 4: First derivative of the signal [8]
METHODS APPROACHES
1. First order derivative / Gradient methods
Robert operator Sobel operator Prewitt operator 2. Second order derivative
/ Zero crossing
Furthermore, when the first derivative is at a maximum, the second derivative is zero. As a result, another alternative to finding the location of an edge is to locate the zeros in the second derivative. Second derivative of the signal is also called Laplacian method. Figure 5 shows the Second derivative of the signal [9].
Fig. 5 Second derivative of the signal [9]
Robert, Sobel, Prewitt are classified as classical operators but highly sensitive to noise. There are various detection methods in the domain of image edge detection, each having certain disadvantages. As edge detection is a fundamental step in computer vision, it is necessary to point out the true edges to get the best results from the matching process. That is why it is important to choose edge detectors that fit best to the applications [8].
III. METHODOLOGY
Edge detection filters out ineffective data, noise and frequencies while preserving the important structural properties in an image. Edge maps are one of the popular ways to represent input images and its features [4]. First, applying Prewitt and Canny algorithms on lena images by finding out the results using MATLAB software. Secondly, calculate value of PSNR and MSE between each resultant edge detected image and input image. In this research paper edge detection algorithms are compared to find out best among Prewitt edge detection and Canny edge detection algorithm. The methodology is as follows:
1. Dataset- Input images can be collected 2. Edge detection
Prewitt
Canny
3. Best technique among edge detection algorithm Canny
1) PREWITT EDGE DETECTION
The Prewitt edge detector is one of the classical operator used in image processing tools. The function of sobel operator is almost same as of prewitt operator but prewitt operator have different kernels, where constant c=1. It is an another way to estimate the magnitude and orientation of an edge. The prewitt operator is limited to 8 possible orientations, however most direct orientation estimates are not much more accurate. This gradient based edge detector is estimated in the 3x3 neighbourhood for 8 directions. We calculated all the eight convolution masks. The convolution mask with the largest module is then selected [7]. The convolution masks of the Prewitt detector are given in Fig. 6.
Gx Gy
Fig.6. Prewitt Mask
The general algorithm for Prewitt Edge Detector is as follows:-
2) CANNY EDGE DETECTION
It is one of the edge detection method to find edges from the input image without affecting the features of the edges. The canny edge detector first smoothens the image to eliminate noise. Then it finds the image gradient to highlight regions with high spatial derivatives. After that it perform tracking along these regions and suppresses any pixel that is not at the maximum .The gradient array at this moment can further be reduced by hysteresis which is used to track along the remaining pixels that have not been suppressed. Hysteresis uses two thresholds and if the magnitude is below the first threshold, it is set to zero . If the magnitude is above the high threshold, it is made an edge [7].
1 1 1
0 0 0
-1 -1 -1
-1 0 1
-1 0 1
-1 0 1
Step 1: Accept the input image.
Step 2: Apply mask Gx, Gy to the input image. Step 3: Apply Prewitt edge detection algorithm and the gradient.
Step 4: Masks manipulation of Gx, Gy separately on the input image.
Step 5: Results combined to find the absolute magnitude of the gradient.
The general algorithm for Canny Edge Detector is as follows:-
Step 1: Smooth the image with a Gaussian filter. Step2 : Compute the gradient magnitude and orientation using finite-difference approximations for the partial derivatives.
Step 3: Apply non-maxima suppression to the gradient magnitude.
Step 4: Use the double thresholding algorithm to detect and link edges.
Step 5: Canny edge detector approximates the operator that optimizes the product of signal-to-noise ratio and localization . As a result, we are determined final images.
The Mean Square Error (MSE) and the Peak Signal to Noise Ratio (PSNR) are used to compare image edge detection quality. The MSE value gives the average difference of the pixels throughout the original image with edge detected image. The higher MSE indicates a greater difference between the input image and resultant image. The MSE value is calculated using this equation:-
MSE = ∑A , B[I1 (a,b) – I2 (a,b)]2 (1) A, B
PSNR is the ratio between the maximum possible power of a signal and the power of corrupting noise that affects the fidelity of its representation [8]. PSNR is usually expressed in terms of the logarithmic decibel scale. Higher value of PSNR is good as it means that the ratio of signal to noise is higher. For image compression, input signal is the original data, and the noise is the error introduced by compression. It is easily calculated based on the MSE value. PSNR calculated by using this equation :-
PSNR = 10 log10 (R2/ MSE) (2)
R is the maximum variation in input image.
IV. EXPERIMENTAL RESULTS
1) ACCURACY MEASURE
From the analysis of PSNR values of edge detection algorithms from TABLE II, Canny edge detection algorithm gives less PSNR value as compared to Prewitt edge detection algorithm.
TABLE II Results of PSNR and MSE
PARAMETERS PREWITT CANNY
MSE 19427.1827 19564.4430
PSNR (dB) 5.24670535 5.21612875
From the Graph 1, it is observed that Canny edge detection algorithm attains low PSNR value in
edge detected image as compared to Prewitt Edge Detection algorithm
.
Graph 1: Accuracy measure for Edge Detection Algorithm
From the Table 2, we measure the accuracy in terms of calculating the value of PSNR and we analysis that canny edge detection algorithm detect in fewer seconds when compared to prewitt edge detection algorithm.
TABLE III
Execution Time of Canny and Prewitt Detection
Algorithms Time (in sec)
Prewitt 34.8
Canny 34.6
From the Graph 2, it is observed that Canny edge detection algorithm detects takes less execution Speed when compared to prewitt edge detection Algorithm.
.
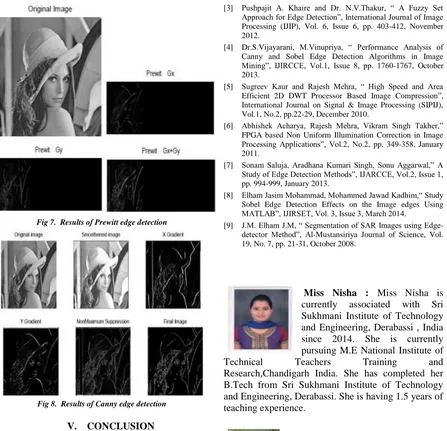
Fig 7. Results of Prewitt edge detection
Fig 8. Results of Canny edge detection
V. CONCLUSION
This paper discussed two edge detectors and is performance analysis based on Mean Square Error, Peak Signal to Noise Ratio and Processing Time needed for lena image to detect edges. Matlab software used for Edge detection. In this research paper the relative performance of Canny and Prewitt edge detection techniques is carried out. It have been observed that Canny edge detection algorithm produces higher accuracy in detection of edges and takes lesser execution time than Prewitt edge detection algorithm.
REFERENCES
[1] Rajesh Mehra and Rupinder Verma, “ Area Efficient FPGA Implementation of Sobel Edge Detector for Image Processing Applications”, International Journal of Computer Applications, Vol.56, No.16, pp. 7-11, October 2012. [2] D.Poobathy, R.Manicka Chezian, “ Edge Detection Operators:
Peak Signal to Noise Ratio Based Comparision”, MECS, Vol.10, pp. 55-61, October 2014.
[3] Pushpajit A. Khaire and Dr. N.V.Thakur, “ A Fuzzy Set Approach for Edge Detection”, International Journal of Image Processing (IJIP), Vol. 6, Issue 6, pp. 403-412, November 2012.
[4] Dr.S.Vijayarani, M.Vinupriya, “ Performance Analysis of Canny and Sobel Edge Detection Algorithms in Image Mining”, IJIRCCE, Vol.1, Issue 8, pp. 1760-1767, October 2013.
[5] Sugreev Kaur and Rajesh Mehra, “ High Speed and Area Efficient 2D DWT Processor Based Image Compression”, International Journal on Signal & Image Processing (SIPIJ), Vol.1, No.2, pp.22-29, December 2010.
[6] Abhishek Acharya, Rajesh Mehra, Vikram Singh Takher,” FPGA based Non Uniform Illumination Correction in Image Processing Applications”, Vol.2, No.2, pp. 349-358, January 2011.
[7] Sonam Saluja, Aradhana Kumari Singh, Sonu Aggarwal,” A Study of Edge Detection Methods”, IJARCCE, Vol.2, Issue 1, pp. 994-999, January 2013.
[8] Elham Jasim Mohammad, Mohammed Jawad Kadhim,“ Study Sobel Edge Detection Effects on the Image edges Using MATLAB”, IJIRSET, Vol. 3, Issue 3, March 2014.
[9] J.M. Elham J.M, “ Segmentation of SAR Images using Edge-detector Method”, Al-Mustansiriya Journal of Science, Vol. 19, No. 7, pp. 21-31, October 2008.
Miss Nisha : Miss Nisha is
currently associated with Sri Sukhmani Institute of Technology and Engineering, Derabassi , India since 2014. She is currently pursuing M.E National Institute of
Technical Teachers Training and
Research,Chandigarh India. She has completed her B.Tech from Sri Sukhmani Institute of Technology and Engineering, Derabassi. She is having 1.5 years of teaching experience.
Dr.Rajesh Mehra: Dr..Mehra is
![Fig. 1. Types of Edges [4] Bar Edge The rapid increase in the range and use of electronic](https://thumb-us.123doks.com/thumbv2/123dok_us/8594900.1722211/1.595.312.528.241.539/fig-types-edges-edge-rapid-increase-range-electronic.webp)
![Fig. 3: Intensity graph of a signal [8]](https://thumb-us.123doks.com/thumbv2/123dok_us/8594900.1722211/2.595.317.511.306.430/fig-intensity-graph-signal.webp)
![Fig. 5 Second derivative of the signal [9]](https://thumb-us.123doks.com/thumbv2/123dok_us/8594900.1722211/3.595.326.528.273.387/fig-second-derivative-signal.webp)