COGNITIVE DE-BIASING AND THE ASSESSMENT OF PEDIATRIC BIPOLAR DISORDER
Melissa M. Jenkins
A dissertation submitted to the faculty of the University of North Carolina at Chapel Hill in partial fulfillment of the requirements for the degree of Doctor of Philosophy in the
Department of Psychology (Clinical Psychology).
Chapel Hill 2012
Approved by:
Eric A. Youngstrom, PhD Deborah J. Jones, Ph.D. Enrique W. Neblett, Jr., PhD
Jen Kogos Youngstrom, PhD
ii ABSTRACT
MELISSA M. JENKINS:Cognitive De-Biasing and the Assessment of Pediatric Bipolar Disorder
(Under the direction of Eric A. Youngstrom, PhD)
Decades of research have demonstrated that relying solely on clinical judgment leaves one prone to a host of cognitive errors that compromise optimal decision-making. Clinical judgment appears to be particularly vulnerable to faulty heuristics and biases when assessing for pediatric bipolar disorder, as evidenced by staggering rates of misdiagnosis and overdiagnosis. Despite abundant evidence documenting the problems associated with clinical judgment, little research to date has explored the effectiveness of targeted interventions, or cognitive de-biasing strategies, for improving clinical judgment in mental health practice. The present project developed an intervention aimed at reducing cognitive-based error in the assessment of pediatric bipolar disorder. The study design was a randomized controlled trial and participants were mental health professionals (N = 79) with experience treating pediatric
populations. The treatment and control groups responded to similar case vignettes and primary outcome measures were clinicians’ diagnoses and treatment decisions. Unlike participants in the control group, participants in the treatment group received the cognitive de-biasing intervention and evidenced greater overall judgment accuracy, p < .0005.
iii
iv
TABLE OF CONTENTS
LIST OF TABLES.. .. .. .. .. .. .. .. .. .. .. .. .. .. .. .. .. .. .. .. .. .. .. .. .. .. .. .. .. .. .. .. .. .. .. .. .. .. .vii LIST OF FIGURES.. .. .. .. .. .. .. .. .. .. .. .. .. .. .. .. .. .. .. .. .. .. .. .. .. .. .. .. .. .. .. .. .. .. .. .. .. .viii I. INTRODUCTION.. .. .. .. .. .. .. .. .. .. .. .. .. .. .. .. .. .. .. .. .. .. .. .. .. .. .. .. 1 .
Overview of Proposed Study.. .. .. .. .. .. .. .. .. .. .. .. .. .. .. .. .. .. .. .. .. .. .. 1 Clinical Judgment and the Potential for Cognitive Error.. .. .. .. .. .. .. .. ..4 Pediatric Bipolar Disorder – A Public Health Crisis.. .. .. .. .. .. .. .. .. .. ..6 Cognitive Error in Assessing Bipolar Presentations –
Unpacking Misdiagnosis.. .. .. .. .. .. .. .. .. .. .. .. .. .. .. .. .. .. .. .. .. .. .. .. .. 7 Cognitive De-Biasing Strategies and Mental Health.. .. .. .. .. .. .. .. .. .. 12
Develop Insight and Awareness.. .. .. .. .. .. .. .. .. .. .. .. .. .. .. .. .. .. .. .. ..14 Consider Alternatives.. .. .. .. .. .. .. .. .. .. .. .. .. .. .. .. .. .. .. .. .. .. .. .. .. .. 15 Decrease Reliance on Memory.. .. .. .. .. .. .. .. .. .. .. .. .. .. .. .. .. .. .. .. .. 16
Specific Training on Bayesian Thinking.. .. .. .. .. .. .. .. .. .. .. .. .. .. .. .. 16 Addressing the Issue of Inaccurate Judgments .. .. .. .. .. .. .. .. .. .. .. .. ..17 What We Do Know: Making Bayesian Reasoning
v
II. METHOD.. .. .. .. .. .. .. .. .. .. .. .. .. .. .. .. .. .. .. .. .. .. .. .. .. .. .. .. .. .. .. ..27 Overview.. .. .. .. .. .. .. .. .. .. .. .. .. .. .. .. .. .. .. .. .. .. .. .. .. .. .. .. .. .. .. .. .27 Participants.. .. .. .. .. .. .. .. .. .. .. .. .. .. .. .. .. .. .. .. .. .. .. .. .. .. .. .. .. .. .. .27 Procedure.. .. .. .. .. .. .. .. .. .. .. .. .. .. .. .. .. .. .. .. .. .. .. .. .. .. .. .. .. .. .. .. 28 Study Materials.. .. .. .. .. .. .. .. .. .. .. .. .. .. .. .. .. .. .. .. .. .. .. .. .. .. .. .. .. 30 Measures.. .. .. .. .. .. .. .. .. .. .. .. .. .. .. .. .. .. .. .. .. .. .. .. .. .. .. .. .. .. .. .. .34 III. RESULTS.. .. .. .. .. .. .. .. .. .. .. .. .. .. .. .. .. .. .. .. .. .. .. .. .. .. .. .. .. .. .. ..38 Power Analyses.. .. .. .. .. .. .. .. .. .. .. .. .. .. .. .. .. .. .. .. .. .. .. .. .. .. .. .. .. 38 Quantitative Preliminary Analyses.. .. .. .. .. .. .. .. .. .. .. .. .. .. .. .. .. .. .. 40 Overall Diagnostic Accuracy.. .. .. .. .. .. .. .. .. .. .. .. .. .. .. .. .. .. .. .. .. .. 40 Race/ethnicity Bias: Are Clinician’s Diagnostic Decisions
Vulnerable to Race/Ethnicity Bias? .. .. .. .. .. .. .. .. .. .. .. .. .. .. .. .. .. .. .42 Performance on Individual Vignettes.. .. .. .. .. .. .. .. .. .. .. .. .. .. .. .. .. ..42 Base Rate Neglect: Does the Cognitive De-Biasing Intervention
Increase Diagnostic Sensitivity to Mania/Hypomania? .. .. .. .. .. .. .. .. .43 Search Satisficing: Are Clinicians More Sensitive to the
Possibility of Comorbid Conditions as a Result of the
Cognitive De-biasing Intervention?.. .. .. .. .. .. .. .. .. .. .. .. .. .. .. .. .. .. ..44 Diagnosis Momentum: Are Participants in the Control Condition
More Likely to Endorse Significantly Higher Probabilities of
Bipolar Disorder? .. .. .. .. .. .. .. .. .. .. .. .. .. .. .. .. .. .. .. .. .. .. .. .. .. .. .. ..45 Classic Mania: Does the Cognitive De-Biasing Intervention
Help Clinicians Better Understand Manic Symptoms in
vi
Clinician Attitudes toward the Intervention.. .. .. .. .. .. .. .. .. .. .. .. .. .. ..53
vii
LIST OF TABLES
Table
1. Implications of faulty heuristics and biases for bipolar populations.. .. .. .. .. .. .. 75 2. Examples of some potential symptom overlap between mania and ADHD.. .. .. .76 3. Cognitive de-biasing strategies.. .. .. .. .. .. .. .. .. .. .. .. .. .. .. .. .. .. .. .. .. .. .. .. .. .. 77 4. Actuarial estimates of likelihood of bipolar disorder for an outpatient setting.. ..78 5. Components of the cognitive de-biasing intervention for clinical judgment.. .. .. 79 6. Overview of case vignettes.. .. .. .. .. .. .. .. .. .. .. .. .. .. .. .. .. .. .. .. .. .. .. .. .. .. .. .. 81
viii
LIST OF FIGURES
Figure
1. Comparison of Participant Risk Estimates by Control
Cognitive De-Biasing and the Assessment of Pediatric Bipolar Disorder INTRODUCTION
Overview of Proposed Study
Pediatric bipolar disorder (PBD) has been in the spotlight of both clinical and
research communities as well as the media and popular press (Kluger & Song, 2002; Papolos & Papolos, 2006). Diagnoses of PBD have risen at alarming rates, with some estimates showing as much as a 40-fold increase in diagnoses over the last decade (Blader & Carlson, 2007; Moreno, et al., 2007). Research suggests that PBD is frequently misdiagnosed (low accuracy, including low sensitivity), and overdiagnosed (low diagnostic specificity)
(Hirschfeld, Lewis, & Vornik, 2003; Kessler, Rubinow, Holmes, Abelson, & Zhao, 1997; Lish, Dime-Meenan, Whybrow, Price, & Hirschfeld, 1994). Clinicians miss true cases of bipolar and diagnose PBD in many cases where the youth does not actually have the disorder.
2
process occur when clinicians use clinical judgment alone to assess bipolar symptoms, with significant variation in clinicians’ interpretation of identical case information 1.
The context of decision-making is an important consideration, especially given that heuristics can also serve as useful templates by expediting processing and synthesizing information (i.e., not always lead to inaccurate judgments). Evidence suggests that humans are more prone to commit faulty “cognitive heuristics” when the condition of interest is rare (Davidow & Levinson, 1993), and judgmental capabilities do not necessarily improve with additional experience (Brehmer, 1980, 1998; Faust, 1986; Faust, 1994; Faust, et al., 1988; Faust & Ziskin, 1988; Garb, 1989; Spengler, et al., 2009; Wedding, 1991; Wiggins, 1973; Ziskin, 1995). There is even evidence suggesting that more experienced clinicians may be at greater risk for biased judgment than novice clinicians (Strohmer & Leierer, 2000). Given the frequent misdiagnosis and overdiagnosis of PBD as well as it being a relatively rare
condition, the risk for cognitive error seems to be especially high in clinicians’ assessment of bipolar symptomotology. Unfortunately, evidence does not suggest that additional clinical experience will necessarily increase judgment accuracy. In the case of bipolar disorder, correct diagnosis is important for many reasons, including prescribing the most effective pharmacological treatment.
3
however, even these methods necessitate clinical judgment to maximize their clinical utility, or for them to be implemented in the first place (Youngstrom, Freeman, & Jenkins, 2009).
Better understanding how to reduce clinicians’ use of faulty heuristics and biases can improve clinical judgment and increase the number of accurate diagnoses for difficult, high-stakes conditions such as PBD. In contrast to current research efforts in mental health, the medical decision-making literature has catalogued over thirty failed cognitive dispositions to respond (CDRs) (e.g., heuristics, biases, sanctions, fallacies, and errors) and has
recommended strategies for reducing cognitive-based error (Croskerry, 2002, 2003; Graber, Gordon, & Franklin, 2002). Substantial clinical utility can be gained in mental health from unpacking the cognitive errors associated with clinical judgment and developing targeted interventions to rectify them. This objective is consistent with recommendations of Spengler et al. (2009), who explain that additional clinical experience may reinforce existing strategies while increased education experience, particularly training in decision-making, may enhance the quality of clinicians’ strategies.
Training clinicians in decision-making has considerable appeal, even among those
4
While clinical judgment is especially vulnerable to cognitive error in assessing cases of bipolar disorder, poor clinical judgment affects other diagnostic and treatment decisions as well (Galanter & Patel, 2005; McClellan, Werry, & Ham, 1993; Reimherr & McClellan, 2004). In general, humans typically do not use purely rational or normative approaches in making decisions (Lau & Coiera, 2007; Tversky & Kahneman, 1974), and this is evident and problematic in a variety of professional settings. For example, exorbitant fees result from unnecessary medical tests and procedures (Kraemer, 1992). The validity of clinical judgment and the amount of clinical experience are unrelated (Lueger, 2002). Clinical judgment can derail accurate decision-making (Dawes, Faust, & Meehl, 1989; Grove, Zald, Lebow, Snitz, & Nelson, 2000; Meehl, 1954), and this derailment does not necessarily self-correct with additional clinical experience alone. Taken together, developing new, concrete strategies to help clinicians make more rational decisions and to avoid cognitive pitfalls is crucial- for PBD and other patient populations.
The overarching goal of the present project included developing and testing the effects of an intervention for improving clinical judgment. Specifically, adapting cognitive de-biasing strategies primarily from the medical decision-making literature, the present study investigated the impact of a new intervention on reducing cognitive-based errors that
contribute to the misdiagnosis and overdiagnosis of PBD. Findings facilitate an increased understanding of clinicians’ cognitive vulnerabilities as well as model a new approach for improving clinical decision-making.
Clinical Judgment and the Potential for Cognitive Error
5
colleagues (2001), clinical judgment is the exercise of reasoning under uncertainty; and, often involves a combination of scientific theory, personal experience, patient perspectives, and other insights that missing data, conflicting information, and limited time can obscure (Redelmeier, 2005). With respect to assessment and diagnosis, clinical judgment largely refers to the decision-making task of interpretation. For example, clinicians may predict diagnoses by synthesizing data from clinical interviews, self-report measures, and family history of mental illness. Accuracy tends to be low when people use clinical judgment alone to perform this task (Elstein & Schwartz, 2002). In fact, mechanical or statistical prediction methods frequently perform as well, and even outperform in many cases, clinical judgment methods (Aegisdottir, et al., 2006; Grove, et al., 2000). Why does clinical judgment often lead to suboptimal decisions, especially when it comes to PBD?
PBD is an extremely challenging diagnosis (Hirschfeld, Lewis, & Vornik, 2003;
Kessler, 1999; Lish, Dime-Meenan, Whybrow, Price, & Hirschfeld, 1994; Marchand, Wirth, & Simon, 2006; Youngstrom, Birmaher, & Findling, 2008; Youngstrom, Findling,
Youngstrom, & Calabrese, 2005); however, is it possible that the way clinicians think makes diagnosing PBD even harder? Given the abundant associations between clinical judgment
and cognitive errors (Elstein & Schwartz, 2002; Klein, 2005; Meehl, 1954), it is likely that clinicians’ cognitive processes further complicate the clinical assessment of PBD.
6
characteristics of the condition. Finding ways to promote changes of habit likely includes both greater awareness and the adoption of cognitive de-biasing strategies.
Pediatric Bipolar Disorder – A Public Health Crisis
The rise in clinical diagnoses of PBD represents a major public health concern. Bipolar is the 6th leading cause of disability in adults (Murray, Lopez, & Mundial, 1996), and it is associated with a 10 to 20 times increase in suicide risk compared to the general US population (Bostwick & Pankratz, 2000; Brodersen, Licht, Vestergaard, Olesen, &
Mortensen, 2000; Guze & Robins, 1970; Harris & Barraclough, 1997; Sharma & Markar, 1994). Bipolar is also associated with substantial economic burden and medical conditions, including cardiovascular, endocrine, and alcohol use problems as well as significantly higher rates of diabetes, Hepatitis C, lower back pain, and pulmonary conditions (Dunner, 2003; Kupfer, 2005; Murray et al., 1996; Stang et al., 2006).
Serious consequences are associated with the misdiagnosis of PBD (Dunner, 2003). Untreated cases may follow a progressive and deteriorating course of illness (Geller, Tillman, Craney, & Bolhofner, 2004), and there is some evidence that wrong medication, such as antidepressants or stimulants, can possibly worsen outcome (cf. Joseph, Youngstrom, & Soares, 2009). Overdiagnosing or prematurely starting pharmacological treatment for bipolar is also dangerous because medications used to treat the illness can carry serious side effects (Wilens, et al., 2003). Suicidality is another concern with these medications (Olfson, Marcus, & Shaffer, 2006; Tondo, Isacsson, & Baldessarini, 2003). Diagnostic accuracy seems
7
Research indicates an average delay of more than ten years between first episode and diagnosis of bipolar disorder (Hirschfeld, et al., 2003; Lish et al., 2004). Another recent study found that five or more years elapsed from the onset of symptoms until a PBD diagnosis was made for more than half of youths in a community mental health setting (Marchand, et al., 2006). Moreover, despite evidence that clinical judgment is prone to a host of errors (Dawes, 1996), practitioners are slow to change their approach (Dawes, et al., 1989). Given that misdiagnosis and treatment delays can have harmful consequences, research is needed to better understand clinicians’ cognitive vulnerabilities (i.e., where mistakes occur) and the
acceptability of reliable and efficient assessment strategies among practitioners (i.e., how to
improve practice with science).
Cognitive Errors in Assessing Bipolar Presentations – Unpacking Misdiagnosis Although PBD is a challenging diagnosis due to the complicated nature of the illness, the decision-making literature indicates that a number of other factors may also be at play (Galanter & Patel, 2005). In 1974, Tversky and Kahneman suggested that contrary to the normative model that people make decisions rationally and use all information available, people often use “heuristics” or cognitive shortcuts. Although heuristics can provide necessary and often useful templates for clinical decision-making, they can also lead to biases and cognitive errors.
There have been several investigations of heuristics in decision-making (Eddy, 1982; Lueger & Petzel, 1979b; McNeil, Pauker, Sox, & Tversky, 1982; O'Donohue & Szymanski, 1994; Richards & Wierzbicki, 1990; Sandifer, Hordern, & Green, 1970; Tversky &
8
Waddington & Morley, 2000; Wierzbicki, 1993). Abundant associations have been shown between clinical judgment and cognitive errors (Elstein & Schwartz, 2002; Galanter & Patel, 2005). Clinicians, like many people, resist modifying or discarding ideas despite further evidence to the contrary (Dailey, 1952; Dawes, et al., 1989; Friedlander & Stockman, 1983; Herbert, Nelson, & Herbert, 1988; Hirsch & Stone, 1983; Meehl, 1960; Meehl, 1954;
Rosenhan & Heiner, 2008; Snyder & Swan, 1978). Croskerry (2002) identifies over thirty failed heuristics, biases, and cognitive
distortions. A number of these cognitive shortcuts are highly relevant in the assessment of PBD; see Table 1 for some of these failed heuristics and their consequent clinical
implications. The succeeding paragraphs will provide a framework for how particular heuristics highlighted in Croskerry’s (2002) review map on to clinicians’ decision-making around cases of pediatric bipolar illness and the related challenges of assessing bipolar disorder.
Challenge 1 – The Cyclical Nature of the Illness
Diagnostic decisions and reliability of clinical impressions are challenged by the cyclical nature of bipolar illness (Bowring & Kovacs, 1992). Case presentations appear very differently depending on whether a client is experiencing florid mania, severe depression, mixed or a euthymic state (Youngstrom, 2005). Consequently, clinicians often fail to detect hypo/mania, and they neglect the possibility of PBD in their diagnoses, case
conceptualizations, and treatment plans. This clinical reality supports the likelihood of the heuristic base-rate neglect--failing to adequately take into account the prevalence of a
particular disease. The frequency and seriousness of base-rate neglect is highlighted by
9
clinicians previously thought (Hasin, Goodwin, Stinson, & Grant, 2005; Merikangas, et al., 2007; Merikangas & Pato, 2009), especially in clinical settings (Biederman, et al., 1996; Blader & Carlson, 2007; Geller, et al., 2002; Youngstrom, Youngstrom, & Starr, 2005). Further, a higher proportion of people with depression will actually have bipolar disorder, particularly child populations (Angst, Sellaro, Stassen, & Gamma, 2005). One likely clinical scenario of base rate neglect includes clinicians failing to assess for hypo/manic symptoms in youth with depression. The seriousness of base-rateneglect is also highlighted by recent FDA requirements: product information sheets for all antidepressants must include a
recommendation for bipolar screening prior to prescription (see Warning section) (U.S. Food & Drug Administration, 2004; Akiskal & Benazzi, 2005).
Challenge 2 – Symptom Overlap
Symptom overlap makes it difficult to parse apart symptoms of bipolar from other likely suspects in pediatric populations, namely attention-deficit hyperactivity disorder (ADHD), unipolar depression, and oppositional defiant disorder (ODD). Irritability lacks diagnostic specificity and can be used to support a large number of diagnoses) (Youngstrom, Findling, et al., 2005). For example, irritability can be a symptom of bipolar, ADHD,
10
provisional diagnosis to become established without adequate evidence. Research lends support to the possibility that clinicians overestimate the likelihood of bipolar without adequate evidence (Dubicka, Carlson, Vail, & Harrington, 2008; Jenkins, et al., 2011). They may be framing this judgment quickly on the basis of a few features, and then fail to check whether a sufficient number of criteria are met. Similarly, once the bipolar hypothesis gains momentum, disconfirming evidence may be discounted or ignored.
Challenge 3 – High Comorbidity
Evidence suggests that bipolar disorder is associated with ADHD, anxiety disorders, ODD, and conduct disorder (CD) (Biederman, et al., 1997; Biederman, et al., 2004; Geller, et al., 2000; Lewinsohn, Seeley, Buckley, & Klein, 2002; Moreno, et al., 2007; Youngstrom, Findling, et al., 2005). High comorbidity may also be problematic in clinicians’ assessment of PBD because some clinicians may not see a “typical” uncomplicated bipolar presentation (Biederman, Klein, Pine, & Klein, 1998; Youngstrom, Findling, et al., 2005). For example, individuals with bipolar have high rates of ADHD (Galanter & Leibenluft, 2008; Kessler, et al., 2006; Lewinsohn, Klein, & Seeley, 1995; Singh, DelBello, Kowatch, & Strakowski, 2006). Table 2 provides an overview of the common symptoms between these two disorders while also highlighting important distinctions in symptom manifestation. As a result of overlapping symptomatology and higher comorbidity rates between bipolar disorder and ADHD, clinicians seem especially prone to commit search satisficing-- when one calls off a
11
satisficing also probably contributes to the overdiagnosis of unipolar depression at the
expense of bipolar disorder (Angst, 2004). Patients are more likely to seek help for symptoms of depression, and once clinicians decide that depression is present, they may call off the diagnostic search before checking for a history of hypomania or mania.
Challenge 4 – Misdiagnosis of Minority Populations
Adult research on bipolar indicates that minority populations are frequently misdiagnosed (Kirov & Murray, 1999; Lawson, Hepler, Holladay, & Cuffel, 1994).
Specifically, adult African American populations are at high risk of being misdiagnosed with schizophrenia (Davis & Jones, 1973; Flaskerud & Hu, 1992; Gross, Herbert, Knatterud, & Donner, 1969; Lawson, et al., 1994; Marquez, Taintor, & Schwartz, 1985; Mukherjee, Shukla, Woodle, Rosen, & Olarte, 1983; Neighbors, Jackson, Campbell, & Williams, 1989; Strakowski, Flaum, et al., 1996; Strakowski, et al., 1995; Strakowski, McElroy, Keck, & West, 1996; Strakowski, Shelton, & Kolbrener, 1993), and less likely than Caucasian patients to receive bipolar diagnoses even when all subjects present with psychotic mania
(Strakowski, et al., 2003; Strakowski, McElroy, et al., 1996). There is also evidence
suggesting that African American pediatric populations are more likely to receive diagnoses of conduct disorder or on the schizophrenia spectrum (DelBello, Lopez-Larson, Soutullo, & Strakowski, 2001; Fabrega, Ulrich, & Mezzich, 1993; Kilgus, Pumariega, & Cuffe, 1995). Currently, no research indicates that the risk of developing bipolar disorder varies by
12
is needed to examine the influence of race/ethnicity bias in the clinical assessment of bipolar populations as well as methods for reducing this bias.
Challenge 5 – Exaggerated Certainty
Studies examining clinicians’ ability to make appropriate confidence ratings, or rather their ability to specify when their predications are correct, have generated mixed results. Although there is substantial evidence suggesting that clinicians lack the ability to make appropriate confidence ratings (Goldberg, 1968; Mischel, 1996) and that judges tend to be overconfident (Kahneman & Tversky, 1973; Nisbett & Ross, 1980; Slovic, Fischhoff, & Lichtenstein, 1977), there is also research suggesting that this may not be the case, or that other factors such as clinical experience moderate the relationship between accuracy and confidence (see Garb, 1986, for a review). Given the evidence that PBD may be
overdiagnosed frequently in the U.S. (Soutullo, et al., 2005), overconfidence--thinking one
knows more than one does, often without having gathered sufficient information--is a serious concern that may impede accurate diagnostic decisions (e.g., Arkes 1981). In particular, overconfident judges may (a) fail to search for information that might cause them to revise their original predictions (Einhorn, 1980; Einhorn & Hogarth, 1978) and (b) disregard evidence contradicting their current judgments (Friedlander & Phillips, 1984; Koriat, Lichtenstein, & Fischhoff, 1980). More research is needed to better understand the role of clinician confidence in of the assessment of PBD.
Cognitive De-Biasing Strategies and Mental Health
13
addressing the cognitive pitfalls that contribute to the inadequacies associated with clinical judgment in mental health. The reduction of diagnostic error in medicine, however, has gained substantial attention in recent years. This may not be surprising given that diagnostic errors have a proportionately higher morbidity compared to other types of medical errors (Brennan, et al., 1991; Thomas, et al., 2000; Wilson, et al., 1995), and delayed or missed diagnoses account for approximately half of all litigation brought against physicians (Ohio Hospital Association & St. Paul Minnesota Insurance Company, 1998). In particular, cognitive de-biasing strategies have taken the forefront in recent medical research for reducing cognitive error.
Cognitive psychology experts recommend similar strategies to those used by experts in medical decision-making (e.g., Croskerry, 2003) for improving clinical judgment, such as
consider the alternatives, think Bayesian, and decrease reliance on memory (Arkes, 1981).
Each of these strategies will be discussed in more detail below. In general, there seems to be consensus across these fields, especially regarding the importance of focused professional training (Arkes, 1981; Croskerry, 2003). Arkes (1991) also shares that simply telling individuals about a particular bias and then telling them not to do it is an “absolutely worthless” technique (p. 326). Research supports the ineffectiveness of this approach (Fischoff, 1977; Kurtz & Garfield, 1978; Wood, 1978). Thus, in order to change clinician behavior a more concentrated approach seems warranted.
Although cognitive de-biasing strategies are relatively innovative for mental health practice in the sense that they are not formally organized or packaged as they are presently in medicine (see Croskerry 2003), the concept of educating and training mental health
14
(e.g., Arkes, 1991; Fischhoff, 1982). For example, based on findings from a recent meta-analysis on clinical judgment, study authors recommend that training incorporate statistical methods to decrease judgment biases and errors (Aegisdottir, et al., 2006). This is consistent with many others’ recommendations as well, including calls for increased education in regression formulas, cutoff scores, and hit rates (Anastasi & Urbina, 1982; Crocker & Algina, 1986). Further, there is evidence that training in probability theory and education on common heuristics increases judgment accuracy (Arkes, 1981, 1991a; Jenkins, et al., 2011; Nisbett & Ross, 1980; Spengler & Strohmer, 2001).
Table 3 provides an integrative list of proposed cognitive de-biasing strategies from the decision-making and cognitive psychology literatures along with definitions and
examples of each strategy. A few of these strategies will be discussed in the following paragraphs with an emphasis on their generalizability to clinicians’ assessment of PBD.
Develop Insight and Awareness
As discussed, the literature identifies common challenges associated with the
assessment of PBD that likely account for the difficulty assessing bipolar and the frequency of misdiagnosis and overdiagnosis (Bowring & Kovacs, 1992; Youngstrom, Findling, et al., 2005). Some of these challenges seem to map on to specific cognitive errors, including include base-rate neglect, diagnosis momentum, search satisficing, overconfidence bias, and race/ethnicity bias. Based on recommendations provided in the decision-making and
15
For example, clinicians might learn that base-rate neglect refers to failing to adequately take into account the prevalence of a particular disease. Then, they might be educated about the base rate of bipolar disorder based on the most recent findings from epidemiological research (e.g., Van Meter et al., 2011). Finally, two clinical scenarios might be presented in which a clinician fails to assess for past symptoms of hypo/mania in a client with depression (i.e., an example of committing the cognitive error) whereas in the second scenario, the clinician inquires about past episodes of unusually energetic or irritable mood (i.e., an example of not committing base-rate neglect). Although there is some debate about the effectiveness of merely educating clinicians and increasing their awareness about faulty heuristics and biases (Croskerry, 2003; Gordon & Franklin, 2003), experts agree that increasing insight is an important ingredient of cognitive de-biasing (Fischhoff, 1982; Redelmeier, 2005).
Consider Alternatives
Given both the high rates of comorbidity and the overlapping symptomatology of bipolar disorder and other psychiatric conditions, considering the alternatives or routinely
contemplating differential diagnoses seems highly relevant. For example, if a youth presents with irritability and high energy, these symptoms might be a sign of a mood disorder or ADHD. Training clinicians to ask themselves, “What else might this be?” can reduce
16 Decrease Reliance on Memory
Research indicates that for a number of reasons, relying on one’s memory can threaten judgment accuracy (Arkes & Harkness, 1980; Lueger & Petzel, 1979a; Ward & Jenkins, 1965). For example, Arkes & Harkness (1980) found that individuals recalled symptoms consistent with a given diagnosis even when these symptoms were not present. Mnemonics, algorithms, and clinical practice guidelines (to name a few) have been suggested as mechanisms for decreasing reliance on memory and increasing judgment accuracy. A few mnemonics have been identified in the literature on PBD (Kowatch, et al., 2005; Quinn & Fristad, 2004; Youngstrom, et al., 2009). For example, “GRAPES” is a mnemonic for more specific symptoms of bipolar including: grandiosity; racing thoughts; increased goal directed activity; pressured speech; elated, euphoric mood; and, decreased need for sleep.
Additionally, “FIND” is a mnemonic for assessing the frequency, intensity, number, and duration of bipolar symptoms. Training clinicians how to use these mnemonics can assist with symptom recognition as well as clinical interviewing (especially in time-limited situations when a gold standard assessment such as the KSADS is not feasible).
Specific Training on Bayesian Thinking
17
setting and learning how to combine this information with family history and/or test score information. This method will be discussed in more detail below.
Addressing the Issue of Inaccurate Judgments
Although there seem to be advantages of training clinicians in decision-making strategies (Berven, 1985; Berven & Scofield, 1980; Falvey & Hebert, 1992; Kurpius,
Benjamin, & Morran, 1985; Spengler & Strohmer, 2001), more research is needed to identify effective ways to teach students and professionals how to avoid cognitive pitfalls (Regehr & Norman, 1996). Graber (2002) argues that diagnostic error may never be eradicated, but that it may be significantly reduced by specific training aimed at improving cognition and
cognitive awareness. Overall, clinical decision-making could benefit from more reliable and valid clinical judgment; however, strategies or interventions for minimizing cognitive errors in mental health, particularly around diagnostic decisions, remain largely unexplored- especially strategies that have been tested under rigorous experimental conditions.
What We Do Know: Making Bayesian Thinking Easier for Clinicians
18
& Hough, 2003; Rettew, Lynch, Achenbach, Dumenci, & Ivanova, 2009; Vitiello, Malone, Buschle, Delaney, & Behar, 1990; Vitiello & Stoff, 1997). To address shortcomings of current assessment methods, researchers have begun testing the effectiveness of actuarial approaches (Jenkins, et al., 2012) that are consistent with recommendations by Croskerry (2003) and others to provide clinicians specific training in Bayesian reasoning (Arkes, 1981; Youngstrom, et al., 2009).
In contrast to traditional clinical assessment, Bayesian reasoning or actuarial approaches employ mathematical and statistical methods to assess risk of illness. Actuarial decision-making has most commonly been used in the medical community to assess the likelihood of illness such as cancer; however, two recent meta-analyses lend support to statistical prediction methodologies in mental health (Aegisdottir, et al., 2006; Grove, et al., 2000). A recent study indicates that actuarial approaches can be used in psychological assessment to improve assessment accuracy and increase agreement surrounding diagnostic decisions for suspected bipolar disorder (Jenkins, et al., 2011).
The nomogram is a simple, practical method for combining information about risk with “likelihood ratios” associated with test results or other clinical findings (Jaeschke, Guyatt, & Sackett, 1994). Clinicians can work directly with probabilities without requiring any mathematical computation (Youngstrom & Duax, 2005). Specifically, the nomogram operates as a type of slide rule (see Appendix A). The nomogram approach correctly combines three pieces of information (i.e., base rate, familial risk, and test score) into
consistent (less spread in opinion), unbiased (neither systematically over- or
under-estimating risk), and efficient (using a parsimonious amount of information to arrive at the
19
Bayesian posterior probability, can be used to determine the likelihood that a youth has PBD, and to guide next steps in assessment and treatment (Youngstrom, et al., 2009).
An alternative to the probability nomogram is to use actuarial tables. Tables are familiar, can be user-friendly, and arguably require less cognitive resources compared to the nomogram. However, tables would need to be recalculated and replaced to accommodate each scientific advance such as new base rate estimates or updates about the diagnostic performance of measures. Mental health professionals could potentially access actuarial tables to determine patient risk immediately based on their clinical setting and a patient’s test score and/or family history of bipolar illness. Table 4 provides an example of an actuarial table that mental health professionals might use. Overall, training clinicians in actuarial decision-making with convenient tools such as the nomogram or actuarial tables is not only consistent with recommendations in the de-biasing literature but is also gaining recognition in the mental health field as an evidenced-based approach (Chorpita, Yim, & Tracey, 2002; Jenkins, et al., 2011; Youngstrom, et al., 2009).
Evidence-Based Practice and Heuristics
Research suggests that people with severe mental illness seldom receive effective services in community mental health centers (Lehman & Steinwachs, 1998; U.S. Department of Health, 1999; Wang, Demler, & Kessler, 2002; West, et al., 2005). To address this issue, evidence-based practice in psychology (EBPP) promotes effective psychological practice and enhancing public health via empirically supported principles of assessment (American
20
Institute of Medicine, 2001), yet the research-practice gap persists. Any number of reasons may explain the practice-research gap. For instance, clinicians can feel overwhelmed by the literature and elect not to use it for clinical issues (Haynes, Glasziou, & Straus, 2000). This is problematic: in one study, consulting the literature changed the medicine, diagnostic test, or prognostic information given to the patient in 47% of cases (Crowley, et al., 2003).
The role of clinical judgment in EBPP has been a contentious issue between
researchers and clinicians. For instance, a common critique of EBPP by clinicians involves a belief that evidence-based treatments restrict or deemphasize the importance or role of a clinician and his/her judgment in patient care (Addis & Krasnow, 2000; Addis, Wade, & Hatgis, 1999). The Report of the 2005 Presidential Task Force on Evidence-Based Practice
argues that although cognitive errors can negatively impact clinical decision-making, clinical judgment is also responsible for complex decisions that can lead to well-conceptualized EBPP (Levant, 2005). Thus, it appears that improving clinical judgment may also help facilitate EBPP. Moreover, it is possible that training clinicians in decision-making (i.e., to improve clinical judgment) in tandem with training on or dissemination of evidence-based treatments may help validate the importance of clinical judgment, defusing clinician resistance and leading to more positive attitudes toward EBPP.
21
Plemmons, & Koontz, 2006). Getting clinicians’ feedback early in the process by providing them the opportunity to share their concerns and voice their preferences seems pivotal to successful implementation. Learning from clinicians on the front line about potential barriers that might otherwise go undetected can also allow researchers the opportunity to tailor strategies to maximize utility.
Significance and Broader Impact
Among many consequences, research shows that inaccurate decisions can lead to treatment failure and premature dropout (Epperson, Bushway, & Warman, 1983; Lutz, et al., 2006). Evidence also suggests that accurate diagnostic assessment is important for providing effective interventions (Meyers, et al., 1998). In the case of bipolar disorder, delays in diagnosis carry serious consequences for patients, their caregivers, and society, including high rates of suicide and increased economic burden (Dunner, 2003; Stang, et al., 2006). Correct diagnosis is pivotal to starting appropriate medication and treatment (e.g., mood stabilizers versus antidepressant medication, which may worsen outcome; cf. Joseph et. al, 2009).
Redelmeier (2005) recommends that instead of attempting to completely eliminate cognitive shortcuts (which often serve clinicians well), increasing awareness of common errors could improve patient care. Awareness alone may not be enough. Aegisdottir & colleagues (2006) recommend developing and testing more user-friendly heuristics for use in clinical settings to further aid judgment accuracy and to save time. Increasing the accuracy of clinical judgment by targeting specific deficits and equipping clinicians with effective
22
considerable public health contributions due to the combination of rapidly increasing diagnosis combined with the currently low accuracy of diagnostic decisions.
Overall, the literature on error in psychiatry is relatively small (Grasso, Rothschild, Genest, & Bates, 2003) with only a few studies having investigated the incidence, nature, predictors, and prevention of errors that may occur in mental health settings (Nath & Marcus, 2006). Yet, implications of failed cognitive shortcuts have dire consequences for patient care. Increasing knowledge about interventions to increase awareness and reduce faulty heuristics and biases can accomplish multiple goals, including: (a) improved education and training around assessing bipolar and potentially other disorders; (b) development of effective cognitive de-biasing strategies; and, (c) advancement of the extant literature on clinical decision-making for mental health (Croskerry, 2002). The study aims focused on these goals. Study and Hypotheses
Can training in cognitive de-biasing strategies increase judgment accuracy in the assessment of bipolar disorder? The proposed study explored the following primary aim: To test the efficacy of a new intervention designed to improve clinical judgment in the
23 Hypotheses
1.0 Overall diagnostic accuracy. Participants’ judgments in the treatment group will show higher decision accuracy than participants’ judgments in the control condition. Overall diagnostic accuracy will be a composite measure of participants’ judgments about diagnosis across case vignettes as well as the probability of disorder for one vignette. Participants’ diagnostic judgments in both groups will be coded as inaccurate, somewhat accurate, or accurate based on expert consensus. Risk of disorder will also be coded similarly as inaccurate, somewhat accurate, or accurate compared to the Bayesian posterior
probability. Somewhat accurate risk estimates will fall within a range of ± 5% of the Bayesian estimates (Sedlmeier & Gigerenzer, 2001) whereas accurate estimates will be the exact estimate. After all of these decisions are coded for accuracy, they will be compared between the treatment and control groups.
1.1 Base Rate Neglect. Participants in the treatment group are less likely to make decisions consistent with base rate neglect, as demonstrated by their inclusion of bipolar disorder as a probable diagnosis. We predict that without cognitive de-biasing training, clinicians will not routinely assess for hypomania or mania. This pattern of decision-making would be consistent with findings in the literature that suggest delays in diagnosis
(Hirschfeld, et al., 2003; Marchand, et al., 2006), as well as the possibility of underdiagnosis of bipolar disorder (Angst, 2007).
1.2 Search Satisficing. Participants in the control condition will be more likely to engage in search satisficing than participants in the treatment condition, resulting in
24
clinicians may stop after diagnosing one disorder when the youth may actually meet criteria for multiple psychiatric conditions. Educating clinicians about this tendency and training them in how to conduct a more comprehensive assessment (i.e., similar to the proposed intervention) will result in a decreased likelihood of search satisficing. Participants in the treatment condition will be more likely to make sensitive diagnostic decisions, accounting for symptoms of both ADHD and PBD in their probable diagnoses.
1.3 Diagnosis momentum. Participants in the treatment group will generate more accurate estimates of the probability of bipolar disorder than participants in the control group. Typical clinical decision-making becomes self-reinforcing, with information that contradicts the initial impression de-emphasized, and corroborating information counting more.
Participants in the treatment condition may correct for this tendency. In contrast, participants in the control condition will be more likely to endorse higher probabilities of PBD without adequate supporting evidence.
25
anticipate that participants’ diagnoses in the treatment group will be significantly less influenced by a youth’s race/ethnicity.
1.5 Confidence and Judgment Validity. There are mixed findings regarding the relationship between judgment accuracy and clinical confidence (see literature review). To further explore this relationship, we hypothesize that for participants in the present study, the discrepancy between accuracy and confidence will be significantly different depending on group status. Specifically, participants in the treatment group who learn de-biasing strategies are expected to demonstrate better agreement between accuracy and confidence. Participants in the control condition are more likely to show overconfidence bias as demonstrated by
discrepancies between accuracy and confidence in which the accuracy of their judgments is less than their confidence ratings.
1.6 Decision-Making Errors and Practice Implications. The effect or clinical implications of base rate neglect, search satisficing,diagnosis momentum, overconfidence
bias, and race/ethnicity bias will also be examined. We predict that the presence of a faulty
heuristic/bias (as demonstrated by inaccurate diagnoses or only somewhat accurate diagnoses) will affect clinicians’ decisions regarding next clinical action, suggesting that heuristics change treatment as well as assessment formulations.
26
1.8 Clinician Attitudes toward the Intervention. Clinicians who receive the intervention will find it helpful and informative.
METHOD
Overview
In the current study, a randomized controlled trial (RCT) tested the efficacy of a new intervention designed to improve decision accuracy. Study participants were randomly assigned to one of two conditions, the treatment or control group. The randomization process is discussed in more detail below. Participants in both groups received information about mood disorders via a 5 minute pre-recorded presentation, and instructed to read several case vignettes and respond to a series of questions after each vignette regarding judgments about probable diagnoses, next clinical actions, and/or decision confidence. Participants in the treatment group also received a training (20 minutes) on decision-making errors and
cognitive biasing strategies for assessing PBD (hereafter referred to as the cognitive de-biasing intervention) prior to responding to the case vignette exercise.
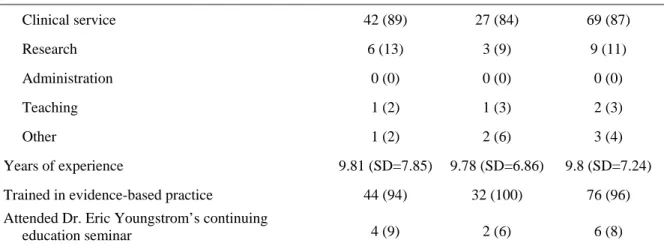
Participants
Participants were 79 mental health providers with 32 participants in the treatment group and 47 in the control group. Study recruitment consisted of providing study fliers and making study announcements via listservs (e.g., North Carolina Psychological Association) as well as electronic mail (e.g., contacting training directors, chief psychologists, trainees). Table 7 provides information about participant demographics including participants’ age, race/ethnicity, and current geographic location. Table 8 provides information about
28
including the ages and diagnostic groups of participants’ primary patient populations. The treatment and control groups evidenced no significant differences, p > .05, or significant
associations, p > .05, on any demographic, professional, or patient variables.
Procedure
Study administration was Web-based using Qualtrics, a provider of online survey software solutions, and an automated Powerpoint presentation with narration. Clinicians accessed the study through a Web address. When individuals entered the website, they were thanked for their interest in the study and were requested to answer two questions to
determine study eligibility. In order to be eligible to participate, clinicians needed to be: (a) licensed or currently supervised by a licensed mental health professional; and, (b) have experience treating child and adolescent patient populations for mental health issues. If participants respond “no” to either of these screening questions, they were thanked for their interest and informed that they were not eligible to participate, thus ending the survey.
Clinicians who responded “yes” to both screening questions were informed of their eligibility to participate and they were directed to the study informed consent page.
Individuals who chose not to participate either closed the browser window or clicked a box indicating that they did not want to participate in which case they were thanked for their interest in the study and exited from the survey. Individuals who reviewed the consent form and wanted to participate clicked a box to indicate agreement to participate in the present study.
29
question that they intentionally wanted to leave unanswered. Instead, Qualtrics has a feature that requested a response for any unanswered items (to help prevent participants from
unintentionally skipping items).
Following the demographic and background questionnaire, we programmed Qualtrics to randomly present participants with one of two possible URLs. Participants clicked on this link, taking them to a new window in which they either watched a brief presentation on mood disorders (i.e., control condition) or a brief presentation on mood disorders + the cognitive de-biasing intervention (i.e., treatment condition). At the end of both presentations,
participants returned to Qualtrics and continued on to the case vignette exercises.
We informed participants that they would be presented with four case vignettes and asked to read each vignette and respond to the questions that followed. We used only four vignettes to reduce the burden on participants and to maximize response rate. Qualtrics was programmed to present case vignettes to participants in a random order. More information about study vignettes is provided below. After completing the last vignette and
corresponding questions, we asked all participants to rate their experience of participating in the vignette exercise (see Appendix C for a copy of the questionnaire). Participants in the treatment group were also asked to complete a brief questionnaire about their attitudes toward the cognitive de-biasing intervention (see Appendix D for a copy of the
questionnaire). After completing their respective attitude questionnaires, all participants completed the Subject Numeracy Scale (Fagerlin, et al., 2007). This scale is described below; see Appendix G for a copy of the questionnaire items.
30
and selected their preferred gift card. They could choose from Target, iTunes, or Amazon. We used two Qualtrics databases to ensure that participants’ responses were kept separate from their email addresses. As noted, participants earned a $20 gift card for their time and effort. We also offered to provide all participants in the control condition a copy of the cognitive de-biasing intervention. Participants were thanked for their participation in this one-time online study.
Randomization process. Two variables were randomized using Qualtrics software including the treatment condition and the race/ethnicity of vignette characters. As described earlier, we programmed Qualtrics to randomly assign participants to either the control (i.e., presentation on introduction to mood disorders only) or treatment condition (i.e., presentation on introduction to mood disorders + cognitive de-biasing intervention) by randomly
presenting them with different website links. Qualtrics also randomized different versions of vignettes so that the different vignette characters were African American half of the time and Caucasian half of the time, all other case information identical. Also, the case vignettes were presented in random order to participants as well as the questions on the multiple choice test for the overconfidence vignette (see below).
Study Materials
31
Case vignettes. We crafted vignettes to examine specific decision-making errors. Study procedures varied slightly by case vignette in order to uniquely test for the specific decision-making error of interest. See Table 6 for an overview of the case vignettes and related procedures. For the vignettes testing for base-rate neglect and search satisficing, participants were instructed to read the case vignette and then: (i) make a determination of probable diagnosis; and, (ii) recommend next clinical action from a list of five options (e.g., more assessment; if yes, specify), psychotherapy or refer for psychotherapy (if yes, what type), medication or refer for medication (if yes, what type), no offer of treatment, or “other” (if yes, specify what “other” treatment do you recommend). Participants could select a maximum of two initial treatment methods (see methods from Currin et al., 2007). Note: Vignette instructions and questions for the vignettes testing for diagnosis momentum and overconfidence included additional questions; we present these additional instructions below with the actual vignette description. Brief descriptions and content of all case vignettes are also provided below. See Appendix E for a copy of each vignette.
Base rate neglect vignette. This vignette described a youth with current symptoms characteristic of a major depressive episode.
Search satisficing vignette. This vignette describes a youth with bipolar and attention-deficit hyperactivity disorder (ADHD) symptoms.
Diagnosis momentum vignette. This vignette portrays a youth with bipolar
32
For this vignette, we asked participants to: (i) make a determination of probable diagnosis; (ii) recommend next clinical action from a list of five options (e.g., more assessment; if yes, specify), psychotherapy or refer for psychotherapy (if yes, what type?), medication or refer for medication (if yes, what type), no offer of treatment, or “other” (if yes, what “other” treatment do you recommend?); and, (iii) report the probability of a bipolar diagnosis (from 0 to 100) on the basis of the available case information.
Overconfidence. This vignette focused on a youth, Lynda, with classic symptoms of mania including grandiosity, hypersexuality as an example of disinhibited and risky
behavior, psychomotor agitation, and distractibility – meeting criteria for at least four “B Criterion” symptoms in addition to the episodic disturbance of mood. Consistent with the episodic nature of mood disorders, her symptoms are described as intermittent. Lynda met duration criteria for a manic episode (e.g., 1 week or longer), and experienced impairment as a result of her symptoms.
This vignette was similar to those in Dubicka et al. (2008) (we received permission from study authors to use this vignette). For information regarding the assembly of the case vignette, see Dubicka et al. (2008). Similar to other vignettes, we asked participants to: (i) make a determination of probable diagnosis; and, (ii) recommend next clinical action from a list of five options (e.g., more assessment; if yes, specify), psychotherapy or refer for
33
to make confidence judgments. This process is described in more detail in the following
paragraphs.
In order to have a basis for determining the accuracy of the judgments, we
constructed a multiple-choice case-study test. We asked participants to respond to 5 multiple choice questions about the vignette character’s presenting problem, symptoms, and
diagnosis. See Appendix F for a copy of the questions. Per recommendations by Oskamp (1965), items were constructed only where there was fairly objective criterion information presented in the case. The incorrect alternatives for each item were constructed in such a way as to be clearly wrong, based on the published case material, but to be otherwise convincing and "seductive" alternatives. None of the items had their answers contained in the
summarized case material; instead, participants were expected to follow the usual procedure in clinical judgment (McArthur, 1954) by forming a diagnostic picture of the youth from the material presented and then imputing her symptoms from their case formulation of the youth.
For each question of the multiple-choice case-study test, we asked participants to provide a confidence judgment. In other words, we asked them to rate their confidence in the correctness of their response from 0 to 100%. Confidence judgments were made using Adams (1957) confidence scale. According to this scale, confidence is defined in terms of expected percentage of correct decisions. Thus, of those responses made with confidence p,
about p% should be correct. This scale has the advantage of facilitating a direct comparison
34 Measures
Independent variables.
Demographic and background information. We gathered the following demographic and background information from all study participants (see procedures above): age; gender; race/ethnicity; years of clinical experience; clinical setting; theoretical orientation(s); typical client caseloads; and, training in evidence-based practices. See Appendix B for complete information collected.
Treatment condition. Participants in the treatment condition received the cognitive de-biasing intervention (as described previously) whereas participants in the control condition did not. Participants in both groups received the same brief introduction to mood disorders.
Race/ethnicity. Vignette characters were experimentally manipulated so that the youths in each of the vignettes were African American half of the time and Caucasian the other half of the time.
Dependent variables.
Decision accuracy. Several methods for defining judgment accuracy exist in the literature (see Spengler, 2009). The present study employed dependent measures of high criterion validity. Examples of highly valid criteria include extensive a priori validation of written clinical vignettes (e.g., Spengler, Strohmer, et al., 1990) as well as post hoc
35
accuracy (i.e., a composite measure of (a) and (b) above); and, (e) confidence judgment accuracy (i.e., for the overconfidence vignette only).
Diagnostic accuracy. We asked participants to report the youth’s probable diagnoses after reading each vignette. These diagnoses were rated on a 3-point Likert scale of (1 = inaccurate diagnosis, 2 = somewhat accurate, and 3 = accurate diagnosis) using criteria established by the research team (which includes expert diagnosticians). In addition to selecting the most probable diagnosis, participants were able to indicate other diagnoses that they were considering.
Decision-making error status. Responses that earned “inaccurate” and “somewhat accurate” scores on diagnostic accuracy (see above) were classified as committing a
decision-making error; “accurate” responses indicated no decision-making error.
Risk estimate accuracy. For the vignette testing diagnosis momentum, participants’ estimates were compared to an objective, actuarial estimate--the Bayesian posterior
36
Gigerenzer, 2001), and a 1-point response fell outside of a ±5% range (less than 22 or greater than 32).
Overall diagnostic accuracy. Overall diagnostic accuracy was a composite measure of diagnostic accuracy and risk estimate accuracy across all of the case vignettes. This variable serves as a primary outcome measure.
Confidence judgments. The confidence judgments were made using a scale devised by Adams (1957) that defines confidence in terms of expected percentage of correct
decisions. In addition to providing a clearly understood objective meaning for confidence, this scale had the advantage of allowing a direct comparison between the level of accuracy and the level of confidence (Oskamp, 1965). The discrepancy between participants’ percent accurate and percent confident (i.e., the difference score) was the dependent variable that we examined across treatment and control groups.
Subjective Numeracy Scale. The Subjective Numeracy Scale (SNS) is an 8-item self-report measure that assessed respondents’ perceived ability to perform various mathematical tasks as well as their preference for numerical versus prose information 2. It required no mathematical computations and had no correct answers. Four questions asked respondents about their numerical ability in different settings, and four questions inquired about
respondents’ preferences for the presentation of numerical and probabilistic information. The SNS is both reliable and highly correlated with the Lipkus, Samsa & Rimer (2001) numeracy measure (Fagerlin et al., 2007). See Appendix G for a copy of the measure.
37
of the vignette exercise (e.g., how challenging it was to make diagnostic decisions), and required participants to make ratings on a 6-point scale: (1) strong agree; (2) agree; (3) somewhat agree; (4) somewhat disagree; (5) disagree; and, (6) strong disagree.
RESULTS
Power Analyses
Power is the probability that the analysis will reject the null hypothesis when indeed it should be rejected. There was adequate power to detect effects for all primary analyses. A sensitivity analysis was run for the Logistic regression, Polytomous Universal Model (PLUM) regression, Multiple Linear regression, Analysis of Covariance (ANCOVA), t-test,
and Chi-Square tests.
39
that the event rates are identical (Borenstein, Hedges, Rothstein, Cohen, & Schoenfeld,
2010).
PLUM regression modeled diagnostic accuracy for each vignette. Current power analysis programs do not include PLUM regression in their power calculations. The sensitivity analysis for the PLUM regression is an approximation based on the logistic regression: 80% power to reject the null hypothesis given effect size, sample size (79), and alpha (0.05, 2-tailed). Notably, using logistic regression as an approximation is an
underestimation of power (Hsieh, Bloch, & Larsen, 1998).
While logistic regression and PLUM regression tested participants’ performance on the individual vignettes, Multiple Linear regression (MLR) tested participants’ overall performance both in terms of the total number of decision-making errors committed and the sum accuracy of diagnostic decisions across all vignettes. For the MLR, we had 80% power to detect effect sizes of f2=.10 or larger (Cohen, 1988) for the given sample size (N = 79) and
alpha = .05, 2-tailed) (Faul, Erdfelder, Buchner, & Lang, 2009). Cohen described effect sizes of f2 ~.02 as “small,” .15 as “medium,” and .35 as “large.”
ANCOVA compared differences in Bayesian estimates, clinician confidence, and attitudes toward the vignette exercise across the treatment and control groups. The power sensitivity analysis indicated that we had 80% power to detect a medium effect size (f = .32)
(Cohen, 1988) for the given sample size (N = 78) and alpha (.05, 2-tailed). Cohen suggested
benchmarks of f ~.10 as “small,” .25 as “medium,” and .40 as “large.”
Next, t-tests compared the treatment and control group on continuous scores. Based
40
(Cohen, 1988) for the given sample size (N = 78) and alpha = .05, 2-tailed), corresponding to
somewhere between a medium (d ~.5) and large (d ~.8) effect.
Lastly, chi-square tests examined the association between decision-making error and practice implications. Results from this sensitivity analysis (based on the chi-square test with the highest number of degrees of freedom which was 5) indicated that we had 80% power to detect a critical χ2 = 12.59 for the given sample size (n = 78) and alpha (.05, 2-tailed).
Quantitative Preliminary Analyses
Prior to quantitative analyses, data were screened to ensure quality and to check standard statistical assumptions. Given that the amount of missing data was small (<2%), missing data were excluded listwise. This approach provides less bias than pairwise deletion and is adequately suited for small amounts of missing data (Allison, 2002). There was only missing data for one participant. Therefore, we did not need to create dummy codes to indicate the presence or absence of data and run correlations between missing data indicators and variables to examine for evidence of patterns or associations with relevant variables. We performed statistical analyses with standard software packages—IBM Statistical Package for the Social Sciences (IBM SPSS Statistics) Version 19.0.
Descriptive statistics, including means, standard deviations and frequencies,
quantified all major study variables. We checked the distributions of variables for normality and obtained plots of the data (e.g., box-plot, stem-and-leaf plot) to determine the necessity of data transformation and/or removal of extreme cases. Also, we examined bivariate correlations among the variables.
Overall Diagnostic Accuracy
41
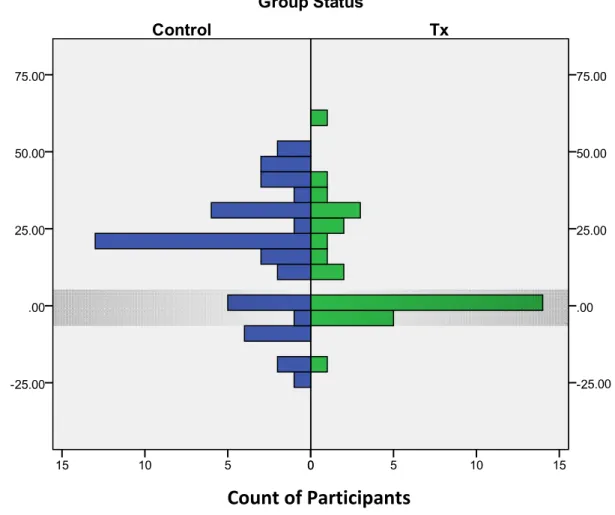
regression (MLR) models. In both models, we predicted that condition status (IV) would lead to enhanced decision-making across all four vignettes accounting for participants’ years of clinical experience. Tables 10 and 11 provide an overview of participants’ performance on the vignettes by condition status and across groups. Note that for Table 10 high scores
indicate more decision-making errors but for Table 11, high scores indicate greater accuracy. In the first model, we used MLR to test the hypothesis that participants in the
treatment condition would commit fewer decision-making errors than participants in the control condition. See Table 10 for an overview of the total number of errors committed per group. Participants ranged from 0 to 4 (i.e., high scores are bad, reflecting more errors). Results indicate a significant regression equation (F(2,75) = 10.37, p < .0005) with an R2 of
.22 using treatment condition and years of experience as predictors of errors. Assignment to the training condition predicted significantly lower numbers of errors, p < .0005; however,
years of clinical experience did not, p > .05.
In the second model, MLR tested the hypothesis that participants who received the cognitive de-biasing intervention would make more accurate diagnostic decisions. See Table 11 for an overview of the summary of diagnostic accuracy ratings; participant scores ranged from 5 to 12 (i.e., high scores are good). Results indicate a significant regression equation (F(2,75) = 10.86, p < .0005) with an R2 of .23, and assignment to the training condition made
a significant unique contribution even after controlling for years of experience. Years of clinical experience did not make a significant unique contribution, p > .05. As proposed in
the design, we included years of clinical experience in both regression models as a regression covariate, but it did not contribute a significant portion of the variance in either model, p >
42
Race/Ethnicity Bias: Are Clinicians’ Diagnostic Decisions Vulnerable to Race/Ethnicity Bias?
For each of the four vignettes, we performed chi-square tests to assess for any associations between vignette characters’ race/ethnicity (IV) and participants’ diagnostic accuracy. Results from chi-square tests indicated no significant associations or trends
between vignette characters’ race/ethnicity and judgment accuracy. Out of the four vignettes, the Lynda vignette (e.g., classic mania symptoms) produced the largest chi-square, χ2 (2) = 3.94, p = .14. Notably, even the largest chi-square did not approach significance, and the
pattern of observed versus expected frequencies showed higher rates of accurate decisions when Lynda was presented as African-American – in the opposite direction of what would have been predicted in a bias hypothesis. Because no associations were found between
race/ethnicity of vignette characters and diagnostic accuracy, we did not include vignette race as a covariate in the regression models presented.
Performance on Individual Vignettes
43
Base Rate Neglect: Does the Cognitive De-Biasing Intervention Increase Diagnostic
Sensitivity to Mania/Hypomania?
Logistic regression tested if participants in the treatment condition were less likely to commit base rate neglect, as demonstrated by their inclusion of bipolar disorder as a probable diagnosis. Decision-making error was a dichotomous variable, rated ‘0’ if no error was committed and ‘1’ if the participants committed an error (i.e., in this case, base-rate neglect
by not accounting for the possibility of mania or hypomania in a depressed phase of illness). Condition status (treatment or control) (IV) predicted decision-making error (absent or present) (DV). In the treatment group, 41% committed a decision-making error, versus 76% in the control group, χ2 (1) = 10.10,
p < .005.
Given the significant results of the logistic regression, the SPSS Ordinal Regression procedure, or PLUM regression--an extension of the general linear model to ordinal
categorical data--tested levels of judgment accuracy (inaccurate, somewhat accurate,
accurate) and included clinician demographic variables (e.g., years of clinical experience and professional title) as regression covariates. We included participants’ professional title as a dummy code, with non-psychologists coded as “0” and psychologists coded as “1”. In the treatment group, 56% were psychologists, versus 51% in the control group, χ2 (1) = .21, p =
.65.
44
possibility of mania/hypomania which were coded as somewhat accurate. Inaccurate responses missed depression and/or consideration of mania symptoms.
The overall chi-square for the PLUM regression was significant, χ2 (3) = 15.96, p <
.005, with a Nagelkerke R2 of .23. From the observed significance levels, treatment group status was significantly related to diagnostic accuracy in the expected direction, B = -1.64
(1), p < .005. As predicted, years of clinical experience did not make a significant unique
contribution, p > .05. Notably, professional title (i.e., psychologist: yes/no) approached
significance, p = .051, suggesting a trend in psychologists’ diagnostic decisions as being
more accurate than non-psychologists’ decisions.
Search Satisficing: Are Clinicians More Sensitive to the Possibility of Comorbid Conditions as a Result of the Cognitive De-Biasing Intervention?
Similar model building tested hypotheses related to search satisficing. Specifically, logistic regression tested if participants in the treatment condition were less likely to commit search satisficing as evidenced by their consideration of ADHD and mood symptoms. Again, decision-making error was a dichotomous variable, rated ‘0’ if no error was committed and ‘1’ if the participants committed an error. Condition status (treatment or control) (IV) predicted decision-making error (absent or present) (DV). In the treatment group, 41% committed a decision-making error, versus 68% in the control group. Logistic regression revealed a significant relation between condition status and decision-making error, χ2 (1) = 5.87, p < .05.