International Journal Advances in Social Science and Humanities
Available online at: www.ijassh.comRESEARCH ARTICLE
Attitudes of Secondary School Pupils towards the Teaching and Learning
of Science: A Zimbabwean Case
Gudyanga Ephias
*, Gudyanga Anna
Midlands State University, Faculty of Education, Department of Educational Foundations, Management & Curriculum Studies, Gweru, Zimbabwe.
*Correspondence Author: E-mail:[email protected]
Abstract
The study sought to investigate the attitudes of Zimbabwean secondary school pupils towards the teaching and learning of science. A randomized sample of 243 participants from eight (8) selected schools completed a 5 point Likert type scale. Factorial Analysis using principal components with Varimax Rotation, Kaiser Normalisation and Scree testing were used to determine validity of the scale. Variables with factor loading of 0.3 and above and Eigen values of 1 and above were considered to form main Attitude towards Science (ATS) scale. Data were analyzed using ANOVA and One way ANOVA. It was found out that pupils in lower classes (Forms 1 and 2) recorded a positive attitude towards science than pupils in the upper classes (Forms 3 and 4). There may be a need to re-examine the reasons why attitude declines with form level. Further studies may look at linkage between pupil’s attitude with their science performance in class, career aspirations and perceptions of the world of science at work.
Keywords: Anova, Attitude, Affective, Cognitive, Psychomotor, Science, Learning, Teaching.
Introduction
From 1980, the Zimbabwean Science Curricula has undergone several changes and up to today, it is still evolving. Of all the Ordinary Level subjects, Science alone has 14 distinct syllabi. The inspiration for this study of attitudes of pupils towards science teaching and learning arose from the authors’ observation that fewer pupils select science subjects, at Form 5. We observed as though attitude towards science appear to be changing negatively as we move from lower forms to higher forms. We therefore got interested in finding out whether this observation was true or not. When pupils’ attitudes are well understood, this helps curriculum developers [1] and science teachers, to be effective in implementing the science syllabi.
From classroom observations, it would seem that school pupils, who are bright, are the ones who are motivated to pursue some scientific work, even on their own. The not so bright ones seem to shun, or look down upon science. They appear not interested. They appear to have negative attitude.
Two studies, [2, 3] compared the perceptions of 9, 13 and 17 year old students with those of
young adults (age 25-35). Although these studies corroborated the conclusion that student interest in science decreases with years of formal education, perhaps an even more distressing finding was that the young adults were more negative about the quality of their science experiences than were any of the school age subjects.
Although there has been a considerable amount of attitude research in science education, much of it has been criticized by Science Education Research. In an effort to quantitatively integrate the results of 49 studies, [4] confirmed earlier reviews that showed such research was somewhat disorganized and chaotic [5] and they
concluded that “research on attitudes is diffuse
in focus as well as emphasis” (p. 577). Attitude research in Science Education has been plagued by problems in definition leading to a lack of conceptual clarity [6-9] and concerns over the psychometric quality of the instruments used [6-10].
scientific attitudes, whereas others are investigating attitudes toward science [8]. According to the distinction noted by Gardner [6], ‘scientific attitudes’ are predominantly cognitive in orientation, whereas “attitudes towards science” are predominantly affective. [7] has stressed the need in research to clearly identify which aspect of attitude is being addressed. Attitude as it relates to science teaching has been defined by [11, 12], in an effort to generate conceptually sound approaches to research design and attitude assessment in science education. This study considered the affective domain of attitudes as related to the learning of science.
The poor psychometric quality of many attitude assessment instruments is also a major problem. In an extensive review of attitude instruments, [8] found that the reliability and validity of many instruments were not verified. He also expressed concern that on some instruments, scientific attitude items were mixed with attitudes towards science items, underscoring the conceptual problems in the construction of attitude instruments.
Several researchers have shown that science students have more positive attitude towards science than non-science students, [13]. Positive attitude change was also reported by [14].
What
are
Attitudes?
The
Three
Components of Attitudes as Related to
Science
In view of this study, it is imperative to distinguish between “Attitudes Towards Science” (ATS) from “scientific attitudes” and to clearly specify the aspects under study [15].The construct “attitude” consists of three components which interact and apply toward the attitude object to varying extends [16]. These domains are the knowledge (cognitive), feeling (affective) and tendency to action (conative) [16]. The cognitive component of an attitude involved intellectual abilities that take into account the perceived relationships between the attitude object and / or concepts. The affective component indicated the degree of emotional attraction toward the attitude object while the conative refers to action or tendency to act in certain ways with regards to the object. This conceptual frame corroborates [15] independent conclusions with regards to the attitude construct. According to [15], attitudes involve cognition, are learned, predict behavior, are affected by social influence of others, and a readiness to respond, and attitudes are evaluative involving emotion.
In an attempt to differentiate, between “attitudes towards science” (ATS) and Scientific Attitudes, it is important to note that both are explicitly articulated in the official science curricula for various levels in Zimbabwe. For example Zimbabwe syllabus SS10 attempts to instill qualities of objectivity, impartiality, a critical approach to information and ideas, and a respect for virtues of incisiveness and the quality of evidence that is scientific attitudes. It also seeks to promote an appreciation of the role, importance and consequences of science both in the workplace and in the community, and thus purports to nurture ATS.
Attitudes toward science, which are the focus of this study, essentially and predominantly, have an effective orientation e.g. liking, enjoyment of the object “Science” unlike scientific attitudes
which have predominantly a cognitive
orientation e.g. objectivity, open-mindedness, etc. [15, 17].
It is against this background that we decided to study the attitudes of pupils in different forms towards the teaching and learning of science. The Null hypothesis under investigation which says there is no significant difference in attitudes amongst pupils at different form levels of school learning towards the learning and teaching of science was used.
Method
Descriptive survey was the main design. We used simple 5 point Likert type scale, based on strongly agree, agree, undecided, disagree and strongly disagree, as the main tool to find out the attitude of pupils towards the teaching and learning of science as they progress from Forms 1 to 4. (Form 1 is equivalent to year 8 of formal learning in other countries, Form 2 is year 9, Form 3 is year 10 and Form 4 is year 11). Participants were selected from schools in the proximity of the researchers to minimize costs. However, different strata were taken care of, the Government schools, church schools, day and boarding schools. Stratified randomization was applied. Out of the selected eight (8) schools
(two from each stratum), systematic
randomization which led to selection of 243 pupils (see Table 1) was used.
Table 1: Demographic profile of participants by sex by Form (N=243)
Form Males Females Total
1 27 22 49
2 20 14 34
3 42 51 93
4 39 28 67
Grand total 128 115 243
We asked participants to complete all the questions on the Likert scale, whether they strongly agreed, agreed, undecided, disagreed or strongly disagreed.
Factor Analysis was used, using Principal Component’s factor analysis with Varimax Rotation, Kaiser Normalisation and Scree Testing, to determine validity and reliability coefficients of instrument and categorization of factors. An item analysis was carried out to determine construct validity of the sixty-five items in the instrument. This was done to verify if indeed the instrument was measuring what it was supposed to be measuring. Variables with factor loading of 0.30000 and above and eigen values of 1 and above were considered for the
main research study [18]. Such factors accounted for 79% of the variance. A Factor Analysis for a three factor solution in line with the theoretical dimension of attitudes was sought. Table 2 shows the factor matrix and attitudes components identified to be measured by such items. Five (5) items were selected for each dimension and shown here as examples. There was no problem in identifying the factors within those predicted by the Inventory. Factor one (1) was clearly the Cognitive dimension or belief about science. Factor 2 was the affective (feelings) domain. Factor 3 was the psychomotor (action) domain or dimension. Table 2 shows the factor matrix of all the three psychological constructs (viz: - the cognitive, affective and psychomotor) and their factor loadings.
Table 2: Rotated factor matrix of scientific attitude inventory scalen construct factors
Cognitive (knowledge belief) domain
1 11 111
Science. knowledge is important .64409 .33937 .01698
We get most answers in science .62405 .29710 .21736
Science. is a battle of ideas .62065 .17286 .30049
Science help us to live comfortably .58912 -.11868 -.31570
Science. Solves our problems .55530 -.16093 -.21135
Effective (feelings) domain
I II 111
Scientists have high status in society .14655 .62748 .23645
Science is based on large words .21997 .58831 20306
I like my Science Teacher .08315 .55245 -.34412
Biology is easier than physics .22803 .52073 -.31546
Products of Scientific work are useful .17692 .41693 -.31747
Action (psychomotor) domain
I II 111
A 65 item attitude was considered long enough to keep the probability of random error low, yet not so long as to introduce data unreliability resulting from fatigue and boredom. The split half-alpha reliability and Cronbach reliability was .68, and .61 respectively. This suggests adequate reliability of the attitude toward
science (ATS) scale since the alpha and Cronbach values are relatively high enough.
Data were analyzed using the SPSS – PC program. The hypothesis was tested using Analysis of Variance statistics (ANOVA) and one way ANOVAs statistics. The independent variable was form level of the pupils. The
Class experiments is a waste of time -.12640 .34329 .67041
It’s hard to learn language of Science .19886 -.28320 .65098
I prefer another teacher -.03300 -.33280 .50815
Science. is laying up trouble for future generation .06905 -.11830 .45911
dependent variables were total attitude, cognitive domain, affective and psychomotor domains which were carried out in order to test the hypothesis. The power of a statistical test depends on: the level of significance adopted, viz, the probability of rejecting a true null hypotheses and accepting a false alternative hypothesis or Type 1 error, and the sample size. In this study the hypothesis was tested using 3 levels of significance. These were 0,05; 0,01 and 0,001. The 3 levels of significance cited above, are all relatively high levels of significance which increase the chances of committing type II errors in the decision making [18].
Analysis of variance (ANOVA) statistics were employed in order to examine the relationship
between the independent and dependent variables. It was also used to test the hypothesis that several population means are equal. On those that were found to be significant, one way ANOVA and a Multiple Comparison Scheffe test was used to determine which population means were different from each other and to protect against calling too many differences significant.
Results
Antecedent Variables by Pupil Total Attitude about Science
Table 3 shows the Analysis of Variance Statistics for total attitude of pupils towards teaching and learning of science by student’s demographic characteristics, (Antecedent Variables).
Table 3: ANOVA for pupil attitude antecedent variables by pupil total attitude about Science (N=243)
**Significant at p<.001 level
Table 3 shows the main effects for each of pupil form level (F=10.330; p=. 000<.001), was significant. Similarly, interaction effects for all the variance were significant, (F=5.738; p=.000<.00100. The demographic variable of form level reflected significant variance at .01 level, ETA values for above variable for form level of pupils was (.20) and main effects of (.36) was realized. These values for the above demographic variable accounted for the observed alphas at .05.
It is interesting to also note that the demographic variable of Form level is important in explaining the total pupil attitude towards the teaching and learning of science. It is observed that at .001 level, pupil form level is significant and also accounts for a large (comparatively) 4% of the variance of total attitude. The hypothesis that there is no significant difference in attitude amongst pupils of different form levels of school learning and teaching of science is therefore rejected.
Table 4: One way Analysis for total attitude by demographic variable (N=243)
Variable Source DF Mean F-Ratio F-Prob.
Pupil form level Between 3 37.96 6.6475 .0002**
**Significant at the p <.001 level
One Way Analysis for Total Attitude by Demographic Variable
Table 4 shows a one way analysis for total attitude by independent (demographic) variable of Form levels. It was observed that one way analysis only showed pupil form level introducing further variance. Pupil form level explained a significant proportion of the variance in total attitude (F=6.6475; P=.0002 <.001). This implies that there are differences in total attitude towards the teaching and learning of science amongst forms 1 to 4. Therefore the
hypothesis that there is no significant difference in attitudes amongst pupils of different form levels towards the learning and teaching of science, is rejected.
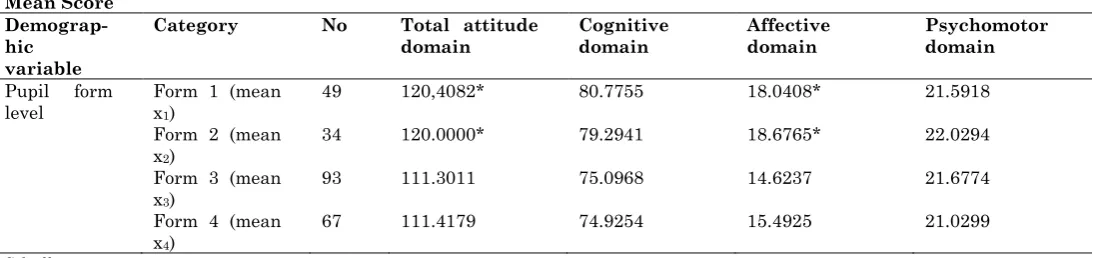
Pair-wise contrasts with Scheffe’s technique were computed to investigate further the observed differences in pupil total attitude, pupil knowledge and beliefs, pupil feelings and pupil practical orientation by the significant demographic variables of pupil form level.Table 5 shows the relevant mean score comparisons.
Table 5: Pairwise comparison for significant demographic variables by pupil total attitude, cognitive domain, affective domain and psychomotor domain (N=243)
Mean Score Demograp-hic
variable
Category No Total attitude
domain Cognitive domain Affective domain Psychomotor domain
Pupil form
level Form 1 (mean x1)
49 120,4082* 80.7755 18.0408* 21.5918
Form 2 (mean x2)
34 120.0000* 79.2941 18.6765* 22.0294
Form 3 (mean x3)
93 111.3011 75.0968 14.6237 21.6774
Form 4 (mean x4)
67 111.4179 74.9254 15.4925 21.0299
Scheffe p<. 05.
Source of variance Mean square DF Means F-Ratio Sign. of F Eta
Main effects 7151.549 6 84.567 5.738 .000** .36
As can be observed on Table 5, form 1 (mean x1 =
120.4082 and Form 2 (mean x2 = 120.0000)
tended to have a higher total attitude towards the teaching and learning of science than Form 3
(mean x3 = 111.3011) and Form 4 (mean x4 =
111.4179). It is interesting to note that the 2 lowest classes (Form 1 and Form 2) form the group of pupils indicating a positive attitude and the top 2 classes forming the group indicating negative attitudes. Similarly these two lower classes, tended to have positive feelings. (affective
domain), towards teaching and learning of
science, Form 1 (×1 = 18.04080 and Form 2 (×2 =
18.6765). It is interesting to observe that the 2 higher classes have a negative feeling towards
learning and teaching of science (×3 = 14.6237 and
(×4 = 15.49250. Therefore, Scheffe statistics also
show that form level of pupil was significantly related to total attitude of the pupils towards teaching and learning of science.
One Way Analysis for Cognitive Dimension Variable by Demographic Variable
Table 6: One Way analysis for cognitive dimension bydemographic variable (pupilform level) (N = 243)
Variable Source DF Mean F=Ratio F-Prob.
Pupils Form level Between
Groups 3 22.29 3.2403 .0228*
*Significant at the p<.05 level
Table 6 shows a one way analysis computed for cognitive domain by pupil form level variable. It was observed that pupil form level introduced some variance. Pupil form level explained a significant proportion of the variance in cognitive dimension (F = 3.2403; p = .0228 <.05). This implies that there are differences in cognitive dimension of pupil’s attitudes towards the teaching and learning of science amongst Forms 1 to 4. The hypothesis that there is no significant difference in attitudes amongst pupils of different
form levels towards the learning and teaching of science is rejected.
Antecedent Variables by Pupil Affective Domain about Science
Table 7 shows the Analysis of variance statistics for total feelings (Affective dimension) of pupils towards teaching and learning of science by
student’s demographic characteristics,
(antecedent variables).
Table 7: ANOVA for pupil attitude antecedent variable by pupil feelings about science (N = 243)
*** Significant at p<.001 level
As can be observed from Table 7, the main effects for form level (F =16.867; p =.000<.001), was significant. Interaction effects for the variance was significant, (F =9.804; p= 000<.001). Eta values for above significant variable (form level) is (.24). It is interesting to note that form level demographic variable is important in explaining the total pupil feelings towards the teaching and learning of science.
It is observed that at .001 level, pupil form level is significant and also accounts for a large (comparatively) 5,76% of the variance of total affective dimension. The hypothesis that there is no significant difference in attitude amongst pupils of different form levels of school learning and teaching of science is rejected.
Discussion and Conclusions
The study set out to investigate the attitude of
secondary school pupils towards the teaching and learning of science in Gweru district in Zimbabwe. The results of this study suggest that attitudes of pupils change as they progress from lower classes to upper classes. There was a significant relationship between pupil’s attitudes and pupil form level, towards the teaching and learning of science. Lower classes (Forms 1 and 2) had a positive attitude towards the teaching and learning of science. Forms 3 and 4 showed a negative attitude. This is consistent with the findings of many previous studies, including, [3 and 19-25]. There may be a need to re-examine the reasons why attitude declines with form level, in future studies.
In pursuing this study, it was not in the hope of finding out the practical solutions to problems, but rather in the hope that findings would be relevant to understanding of attitudes towards teaching and learning of science. It was not Source of variance Mean
square DF Means F- Ratio Sign. of F Eta
Main effects 125.390 6 11.198 9.840 .000*** .18
possible, in this study, to link pupil’s attitude with (i) their science performance in class, (ii) gender and (iii) career aspirations. Future study in this area is therefore called for, not only to seek answers to these questions but also to further investigate the relationships between pupils’ attitudes towards science subjects and pupils’ perceptions of the world of science at work.
Longitudinal assessments may also be carried out in future studies, starting possibly from year 5 6 through to year 13 or colleges, so that a consistent awareness on attitude towards science teaching and learning is maintained.
As like in any research in social sciences, the methodology used has its own limitations. Therefore, the results established in here are largely tentative and in need of replication. This study has therefore laid down the foundation and groundwork to further studies on learning research within the context of Zimbabwean Educational System.
Acknowledgements
This paper was a result of contributions made by the pupils of the schools visited and in this regard we would like to acknowledge the role they played individually and collectively in making this research a success.
References
1. Kind P, Jones K, Barmby P (2007) Developing attitudes towards
science measures. Int. J. Science Education, 29(7):871-893.
2. Yager RE, Bonnstetter RJ (1984) Student perceptions of science
teachers, classes and course content. School Science and Mathematics, 84:406-414.
3. Yager RE, Penick JE (1986) Perceptions of four age groups
toward science classes, teachers, the value of science. Science Education, 70:355-363.
4. Haladyna T, Shaughnessy J (1982) Attitudes towards science: A
Quantitative synthesis. Science Education, 66:54-563.
5. Peterson RW, Carlson GR (1979) A summary of research in
science education. Science Education, 63(4):429-53.
6. Gardner PL (1975) Attitudes to science: A review. Studies in
Science Education, 25:283-289.
7. Germann PJ (1998) Development of the attitude toward science
in school assessment and its use to investigate the relationship between science achievement and attitude toward science in school. J. Research in Science Teaching, 25(8):689-703.
8. Munby H (1983) An Investigation into the measurement of
attitudes in science education. SMEAC Information centre, Ohio State University. (Eric Document Reproduction service No. ED 237 347).
9. Schibeci RA (1989) Home, school and peer group influences on
student attitudes and achievement in science. Science Education, 73(1):13-24.
10.Krynowsky BA (1988) Problems in assessing student attitude in
science education: A partial solution. Science Education, 72(4):575-584.
11.Koballa TR (1988) Attitude and related concepts in science
education. Science Education, 77(2):115-126.
12.Shrigley RL, Koballa TR, Simpson RD (1988) Defining attitude
for science educators. J. Research in Science Teaching, 25:659-678.
13.Gabel D (1981) Attitudes toward science and Science teaching of
undergraduates according to major and number of science
courses taken and the effect of two courses. School Science and Mathematics, 1:70-76.
14.Baldwin TO, Bodeker RR (1975) Non science student attitudes
toward science, physics and two introductory science courses. J. College Science Teaching, 4(1):179-182.
15.Schibeci RA (1983) Selecting appropriate attitudinal objectives
for school science. Science Education, 67(5):495-503.
16.Johnstone AH (1982) Attitude Measurement in Science-pit falls
and pointers in Royal Society of Chemistry (1982) Chemical Education Research and its implications for teaching. Proceedings of a symposium, University of Aston, Birmingham.
17.Gogolin L, Swartz F (1992) A quantitative and qualitative
inquiry into the attitudes toward science of non-science college students. J. Research in Science Teaching, 29:487-504.
18.Rust J, Golombok S (1989) Modern Psychometrics, The Science of
Psychological Assessment, London and New York, Rutledge.
19.Francis LJ, Greer JE (2006) Measuring attitude towards science
among secondary school students: The affective domain. Research in Science and Technological Education. 17(2):219-226.
20.Simpson RD, Oliver JS (1990) A summary of major influences on
attitude toward and achievement in science among adolescent students. Science Education, 74:1-18.
21.Yager RE (1983) Elementary science teachers-take a bow.
Science and Children, 20:20-22.
22.Johnson RT (1981) Children’s attitudes toward science. Science
and Children, 18:39-41.
23.Ebenezer JV, Zoller U (1991) Teaching/Learning styles,
performance and students teaching Evaluation in science education. J. Research in Science teaching, 28(7):593-607.
24.National Assessment of Educational Progress. The third
assessment of Science. Denver, co: Education Commission of the States.
25.Yager RE, Penick JE (1984) What students say about science