Automated Student Result Analyzer
1P Surendra Varma,2S Sushma,3Satish Kumar Ch 1,2,3
Department of Computer & engineering
1
Raghu Engineering College,2,3Ideal Institute of Technology
1[email protected],2[email protected],3[email protected]
ABSTRACT
The faculty of various colleges are facing overhead analyzing the results of students. Excel sheets are being used for percentage calculation, counting the number of backlogs, listing students within a particular range of percentages given etc. There is an additional burden with the results of supplementary exams and revaluation results.
The statistics of any student belonging to a particular batch might change frequently from 1styear to 4th year because he/she is allowed to write supplementary examinations twice a year and so frequent modifications are required manually. To overcome all these problems faced we try to automate all the calculations possible.
Key words- automation, database, result analysis.
I. INTRODUCTION
Instead of using excel sheets, using a database for storing all the results reduces complexity since the user can easily query for any type of information he/she requires.
This automated result analyzer provides good Graphical User Interface for making all the analysis very easy and friendly for the user. Interaction with the analyzer is a very easy task ranging from entering marks of all the students to calculating statistics. Analysis of results provides various services including the following
Services provided on a single student:
Percentage Calculation
Counting No. of backlogs.
Percentage Calculation with and without including marks of Backlog subjects.
Total Credits
Services provided on a class of students:
Pass percentage of a class
Pass Percentage of a particular subject
List of students within given range of percentage.
List of students within given range of backlogs.
Services provided on an entire Department:
Pass percentage of Department
Pass percentage of a particular Year
Topper of the Department
List of students within given range of percentage.
List of students within given range of backlogs.
Services provided on an entire College:
Pass percentage of College
Department wise pass percentage
Topper of the College.
Department wise and year wise toppers.
List of students within given range of percentage.
List of students within given range of backlogs.
Automating all the above services avoids manual calculations, saving a lot of time.
Not only saving time, the analyzer also integrates the results of various years and departments which is almost impossible using excel sheets.
Improves correctness of the calculations since manual calculations are avoided.
IIEXISTING SYSTEM
result are found manually which consumes lot of time.
The need of analysis of result as a whole is very difficult. The limitations like time consuming, insecurity, loss of data aroused the need for the proposed system. The process which was manually done was responsible by the staffs who used to find it difficult to refer the result as a whole. So the existing system did not consist of any easy method of analysing the result as a whole. The administrator had to find manually how many students have got less than the marks required to pass.
The details of the faculty, students, subjects, semesters and departments are also difficult to be maintained. A lot of paper work, insecurity and time consuming process are the major disadvantages of
the existing system.
III PROPOSED SYSTEM
Proposed system encompasses study of present system thus finding out Drawbacks of the system, requirement analysis, planning and scheduling, design Development, testing, installation trails runs with small pieces of live data and Training the user to use and also to maintain the system for the better use. The proposed system maintains consistency of data throughout the system. It contains normalized data which is easy to store and retrieve from.
It can generate subject wise report, percentage wise report, practical report, overall result of class report, overall pass in each subject report and graphs for every report that are beneficial to take any action. It is secure and fast. The proposed system will require less manpower. From the proposed system we can save a lot of time which is a major factor. The login and password page also secures your system properly. The calculations are done accurately. Thus accuracy is a major advantage and there is no chance of having any duplicates.
IV IMPLEMENTINGAUTOMATON We try to automate the process of analysing the result by using data base management tools, here we use mysql, and for the interaction with the data base to we have used PHP and for user friendly interaction we used HTML, CSS, bootstrap.
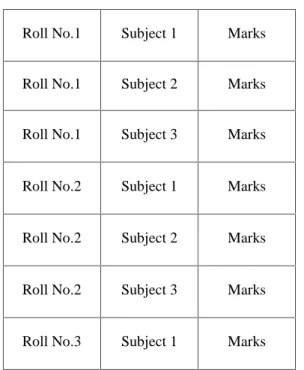
The process of automation starts with the excel sheet containing results. This excel sheet is imported into the database and while importing we create a view such that the format of data becomes easy for throwing various queries on it.
Following figures show the format of data before and after importing into database.
Roll No.1 Subject 1 Marks
Roll No.1 Subject 2 Marks
Roll No.1 Subject 3 Marks
Roll No.2 Subject 1 Marks
Roll No.2 Subject 2 Marks
Roll No.2 Subject 3 Marks
Roll No.3 Subject 1 Marks
Fig: Data in excel sheet before importing into Data Base
Roll No. Marks Marks Marks
Roll No.1 Subject 1 Marks
Subject 2 Marks
Subject 3 Marks
Roll No.2 Subject 1 Marks
Subject 2 Marks
Subject 3 Marks
Roll No.3 Subject 1 Marks
Subject 2 Marks
Subject 3 Marks
Roll No.4 Subject 1 Marks
Subject 2 Marks
Subject 3 Marks
Roll No.5 Subject 1 Marks
Subject 2 Marks
Subject 3 Marks
Roll No.6 Subject 1 Marks
Subject 2 Marks
Subject 3 Marks
Fig: Data in the form of data base view after importing
The results format before view being created is as shown below:
Fig: Screenshot before importing
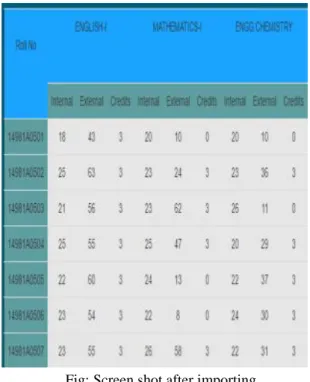
In the above figure, each roll number is present multiple times which becomes difficult to carry queries, so we try to avoid duplicate occurrences of roll number and then make it as a primary key. So after importing a view is created such that its data looks as shown below.
Fig: Screen shot after importing
If a supplementary exam result is declared later on, then there is a possibility of student
marks to be modified. So we provide option for modifying students marks as shown below:
Fig: Screen Short showing marks modification
The total backlog count for each subject can be found out as shown below:
Fig: Screen Shot for Backlog Count
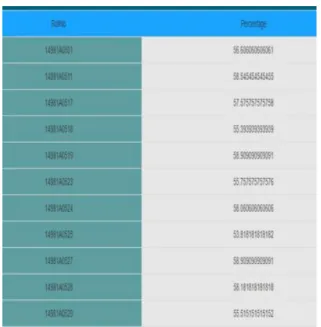
Fig: Screen shot showing group 51 to 60%
Fig: Screen shot showing group 61 to 70%
VI TEST CASES Test case-1:
We have to upload excel file. Result: success
Test case-2
• We have to enter the marks of the student into the
database.
• Two buttons are displayed on the page. 1.Submit 2.Refresh.
database.
• By clicking the refresh button after inserting data
we can directly view the marks. Result: success
Test case-3:
In this test case we will display all students data in the class.
• We can view data of the students marks like
percentage, backlogs, total marks, total credits, percentage without backlogs, etc..
Result: success
Test case-4:
• In this test case we will display the individual
student data.
•We can get the data of an individual student marks like credits of individual subjects, backlogs, total credits, percentage without backlogs, percentage with backlogs.
Result: success
Test case-5:
• We display the subject wise backlogs here that is
how many students failed in each subject and what is the pass percentage in each subject.
• By considering the internal and external marks of a
student we decide whether he/she passed in that particular subject or not.
• The student must obtain greater thanor equal to 26 marks in his external and the total marks must be greater than or equal to 40 to pass in a particular subject.
Result: success
Test case-6:
To check the student percentage within a particular range of
50-60 % 60-70% 70-80% 80-90% 90-100% Result: success
VII SCOPE FOR EXTENSION
The main purpose of this project is to make analysis easy, friendly for user and to automate all the calculations possible. When we enter a
student’s roll number, marks and percentage of that
student will be displayed automatically. There is no need of manual calculations as all the results will be
stored in the database. By entering a student’s roll
Entering results into database is the only thing which is not automated.Importing results
directly from pdf’s into database would be a very
useful extension to work on for this project. Presently
student’s revaluation /supply results is being
uploaded manually. Further scope is that it should be done automatically.
VIII REFERENCES 1.http://www.w3schools.com/
2.http://stackoverflow.com/
3.https://support.office.com/en-IE/Article/Create-a- PivotTable-to-analyzeworksheet-data-a9a84538-bfe9-40a9-a8e9-f99134456576
4. http://www.tutorialspoint.com/mysql/mysql-select-query.htm
5.https://www.apachefriends.org/index.html
6.http://tomcat.apache.org/
7. Data base Management System,5/e, ElmasriNavathe , PEA
8. Introduction to Database System , 8/e , C.J.Date , PEA
9. Database System Concepts, Peter ROB, Coronel, Ceeneage
10. Beginning Web Programming-John Duckett WROX
11. Web Technologies, Uttam K Roy
12. Head first Java-Kathy sierra–Orielly
13. An Introduction to Web Design and Programming