http://dx.doi.org/10.4236/ojmi.2015.54026
How to cite this paper: Karunanayake, N. and Kodikara, N.D. (2015) An Improved Method for Automatic Retinal Blood Vessel Vascular Segmentation Using Gabor Filter. Open Journal of Medical Imaging, 5, 204-213.
http://dx.doi.org/10.4236/ojmi.2015.54026
An Improved Method for Automatic
Retinal Blood Vessel Vascular
Segmentation Using Gabor Filter
Nalan Karunanayake1*, Nihal D. Kodikara21Department of Electrical and Computer Engineering, Sri Lanka Institute of Information Technology, Malabe, Sri Lanka
2Department of Computer Science, University of Colombo School of Computing, Colombo, Sri Lanka
Received 27 September 2015; accepted 5 December 2015; published 8 December 2015
Copyright © 2015 by authors and Scientific Research Publishing Inc.
This work is licensed under the Creative Commons Attribution International License (CC BY).
http://creativecommons.org/licenses/by/4.0/
Abstract
Early detection of Non-Proliferative Diabetic Retinopathy (NDPR) is currently a highly interested research area in biomedical imaging. Ophthalmologists discover NDPR by observing the configu-ration of the vessel vascular network deliberately. Therefore, a computerized automatic system for the segmentation of vessel system will be an assist for ophthalmologists in order to detect an early stage of retinopathy. In this research, region based retinal vascular segmentation approach is suggested. In the steps of processing, the illumination variation of the fundus image is adjusted by using the point operators. Then, the edge features of the vessels are enhanced by applying the Gabor Filter. Finally, the region growing method with automatic seed point selection is used to ex-tract the vessel network from the image background. The experiments of the proposed algorithm are conducted on DRIVE dataset, which is an open access dataset. Results obtain an accuracy of 94.9% over the dataset that has been used.
Keywords
Diabetic Retinopathy, Blood Vessel Segmentaion, Retinul Fundus Image, Gabor Filter, Region Growing, Point Operators, Illumination Variation
1. Introduction
The blood vessel system of the human retina is a complex network. The initial phase of diseases such as diabetic
*
retinopathy, hypertension, arteriosclerosis, cardiovascular disease and retinopathy of prematurity (ROP), can be diagnosed by monitoring the retinal vessel structure from time to time [1]-[3]. Among those diseases, diabetic retinopathy is the elementary cause of blindness, since 5.5% of the world population influence of diabetics and 10% among them are having diabetic retinopathy [4]. Diabetic retinopathy is a disease that occurs due to a com-plication of diabetic, which usually results in severe vision loss or permanent blindness. It occurs when high blood sugar levels damage the tiny blood vessels that nourish the retina. “Non-Proliferative Diabetic Retinopa-thy” (NDPR) is the early phase of the disease [5]. During this period, tiny bulges occur in the vessel walls. In order to observe the initial stage of retinopathy or “NDPR”, ophthalmologists need to closely monitor the blood vessel network in the retina. A methodical medicine of diabetic retinopathy can prevent 98% of serious vision loss. However, the patient has to go through a systematic eye screening process [6]. In the screening process, plenty of retinal images are inspected by the physician. The manual retinal blood vessel segmentation is intricate, expensive and time consuming, and irreproachable level of the segmentation will depend on the aptitude of the ophthalmologist [4][7]. Therefore, reliable automated computerized vessel segmentation system is an essential which can accommodate to the clinicians during the screening process [8].
There are various methods which have been used for segmentation of the vessels to date including rule based methods, vessel tracking methods, filter based methods and supervised methods [5][6][9]. In the automatic segmentation process, it is difficult to attain accurate results of the segmented vessels due to the uneven intensity variation of the retina (uneven background illumination) [1][4][5][10]. Therefore, thin vessels are impassable to distinguish from the retinal background. In this paper, a new approach based on point operator is used to mi-tigate the uneven illumination in order to enhance the vessel network and to adjust it preferably providing for segmentation process.
The green channel of the original fundus image has been used to obtain the traces of blood vessels and morpho-logical operations followed with enhancement and background exclusion. Thresholding has been used to extract the vessels in the approach taken by S. Joshi and P. T. Karule [11]. In “Vessel Segmentation in Retinal Images Using Graph-Theoretical Vessel Tracking”, a vessel tracking technique based on seed points is used to extract the vessel system out of the retinal image [12]. Otsu thresholding and Medial Axis Skeletonization based me-thod followed by pruning have been used in the research done by L. Sukkaew et al. [13]. Next a complex Gabor filter is used to enhance the vessels and the result is further purified by using entropic thresholding in the re-search done by P. C. Siddalingaswamy and K. G. Prabhu [14]. D. onkaew and B. uyyanonvara in “Automatic Extraction of Retinal Vessels Based on Gradient Orientation Analysis” [15] has used a gradient orientation me-thod to separate the vessel system. Applying matched filter and 2-D Gabor wavelet to the inverted image of the green channel and the vessels of the enhanced image is segmented using multilayered thresholding and adaptive thresholding methods with an accuracy of 94.85% are conducted by M. Usman and S. A. Khan [16].
This study is framed into four sectors. The proposed methodology explicated in order to provide necessary details for blood vessel segmentation is presented in Sector 2. In Sector 3, the experimental results and assess-ments of the algorithm using the DRIVE [17] database are explained and results are compared with the prior studies [18]-[22]. Finally, conclusion and reference are given in Sector 4.
2. Methodology
The proposed algorithm can be split into five stages.
2.1. Resizing the Fundus Images
Several distinct sizes of color fundus images are brought to one common 600 × 600 size in order to bring them in a common dimension to generalize the algorithm for all the images.
2.2. Correcting Intensity Variation
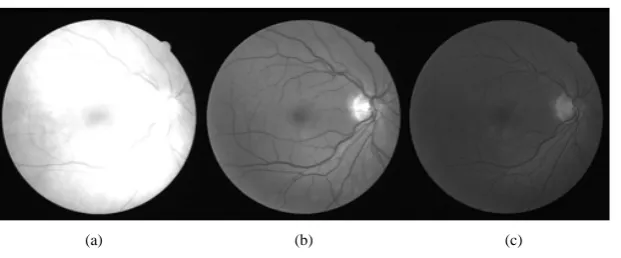
In the retinal images, there is an intensity variation due to the manifold illumination. Many research works has been experimented to restrain this issue [23]-[26]. The intensity variation of the red channel, which is the major factor causal to the illumination variation of the fundus images in Figure 1.
(a) (b) (c)
Figure 1. Extraction of RGB Image: (a) Red channel component; (b) Green channel
component; (c) Blue channel component.
combined with green and blue channels in order to obtain a color image with less non-uniform illumination
Figure 2(b).
The logarithmic point operator function is given by:
( )
, log 1(
( )
,)
Q i j = ⋅c + P i j (1)
where, Q(i,j) is the adjusted image and the P(i,j) is the input image. Furthermore, “c” is the scaling factor as fol-lows:
(
255)
log 1
c
R =
+ (2)
where R is the maximum pixel value of the input image P(i,j).
2.3. Pre Processing
The blood vessels appear a higher contrast in the green channel than the red or blue channels in the enhanced re-tinal image. Only the filtered green channel of the rere-tinal image will be more over processed [28]. A 2-D median filter with 3-by-3 neighborhood size is applied to obtain a clear image with a minimum extent of the noise of the green channel (Figure 3).
2.4. Apply 2-D Gabor Filter
The 2-D Gabor filter is a linear filter, that has been widely used for low level oriented edge detection and extrac-tion of texture features for discriminaextrac-tion purposes in image processing and computer vision fields. Frequency representation and orientation representation of the Gabor filter are identical to the human vision system. In the spatial domain, a 2-D Gabor filter is a Gaussian kernel function modulated by a sinusoidal plane wave [29]. En-hancement of the pixels of the blood vessels oriented along the various dimensions can be done due to the factor of directional selectivity of the Gabor filter. The response of the Gabor filter is a complex number with real and imaginary parts that are orthogonal and act as low level oriented edge discriminators [30][31]. The equalized image is complimented (inverted) and Gabor filter is applied to highlight the blood vessel vascular system, by ignoring the background noise. The filter has a real component as well as imaginary component expressing or-thogonal directions. The two components of a real part and imaginary part can be formed into a complex number represented by:
(
, ; , , , ,)
exp 2 22 2 exp 2π2
x y x
g x y λ θ ψ σ γ γ i ψ
λ σ
− ′ + ′ ′
= +
(3)
Individually the real component represented by:
(
, ; , , , ,)
exp 2 22 2 cos 2π2
x y x
g x y λ θ ψ σ γ γ ψ
λ σ
− ′ + ′ ′
= +
(a) (b)
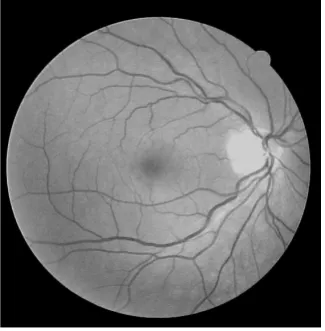
Figure 2. Non illuminated image processed as an equaly distributed
illumi-nated image: (a) Original image; (b) After adjusting the illumination variaton.
Figure 3. Filtered green channel image.
The imaginary component is given as:
(
, ; , , , ,)
exp 22 22 2 sin 2πx y x
g x y λ θ ψ σ γ γ ψ
λ σ
− ′ + ′ ′
= +
(5)
where,
( )
( )
cos sin
x′ = ⋅x θ + ⋅y θ (6)
( )
( )
sin cos
y′ = − ⋅x θ + ⋅y θ (7)
The Gabor filter depends on few parameters. The parameter θ exemplify the orientation of the filter. λ represents wavelength of the sinusoidal function and ψ is the phase offset. σ is the variance of the Gaussian envelope. When σ changes, Gabor filter with above parameters does not scale uniformly. Thus, it is better to use
parameter γ λ σ
= instead of λ. Where, γ is the spatial aspect ratio, which specifies the ellipticity of the sup-
port of the Gabor function by selectively changing the above parameters
(
γ θ σ, ,)
whilst a clear response of vessels could be obtained.2.5. Segmentation of Vessels
[image:4.595.233.396.288.454.2]the blood vessels from the image background. In this phase, global thresholding techniques cannot be applied due to the various gray levels in different areas in the image and noisy unconnected regions appeared as false vessels. The processed image is a matrix with M rows and N columns. Then the window concept is used to con-vert the processed image into the binary scale.
The region growing method is used to extract the vessel vascular system in the proposed methodology. The region growing segmentation method can be divided into two partitions as general purpose and knowledge based [32]. The region growing segmentation used to analyze of an image into connected regions based on a certain similar characteristic of the pixels within them [33].
The enhanced image after applying the Gabor filter is divided into 100 × 100 pixel blocks in order to apply the region growing segmentation method. Applying region growing method to blocks of the image is more ap-propriate than applying to the overall image to segment the vessel network due to their intensity variations and complexity. It is essential to choose a starting point (seed point), to initiate the segmentation process. The selec-tion of the seed point is pivotal to the overall success of the segmentaselec-tion depends on that point [34]. In the pro-posed research work, an automatic seed placement method is used according to the intensity variation of the pixels of the appertinent block. The block’s seed point value is calculated by using the maximum and the mini-mum pixel values of each block as follows:
( )
, 0.5(
max min)
P i j = I +I (8)
where, Imaxis the maximum pixel value and Imin is the minimum pixel value of each block.
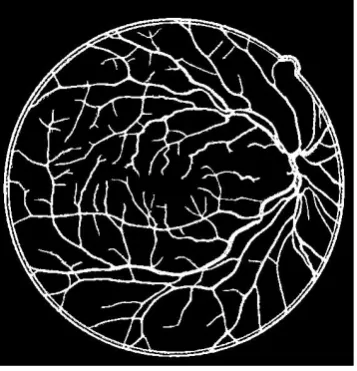
Then the seed point is determined by the nearest available pixel value to the P(i,j)in the block. The region is iteratively grown by comparing all unallocated neighboring pixels. It is necessary to remove the noise after the binarization process. Unconnected pixel areas smaller than in size of 30 are removed in order to obtain a clear response (Figure 4).
3. Experimental Results
The proposed algorithm was tested on open source data set named DRIVE [17]. This database contains 20 fun-dus images in the size of 565 × 584 pixels. The results were obtained using the images which are corrected illu-mination variation as seen in Figure 2. The thin vessels, which are mostly near the boundary of the retinal image were not clearly visible due to the illumination variation of the background. After adjusting the intensity varia-tion of the fundus images the thinnest vessels are mostly visible clearly than the original images. Therefore the Gabor filter function produces more accurate results as shown in Figure 5. In the segmentation process produce veritable results, withal there are still misclassified vessels which are very thin with meagre edges and two ves-sels appeared as a one in the area near to the optic disc due to the high intensity pixels in that area (Figure 6).
(a) (b)
Figure 4. Image window binarization (a)
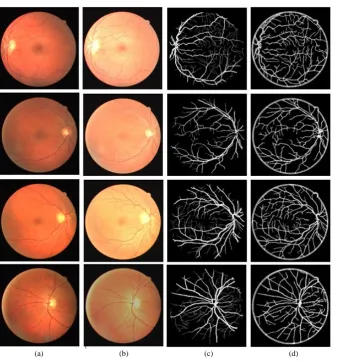
[image:5.595.227.404.501.699.2]Figure 7(a)shows four retinal images from DRIVE dataset and Figure 7(b)shows the images that illumina-tion variaillumina-tion is corrected, Figure 7(c)and Figure 7(d)shows the manual segmentation of the vessel system and the results of the proposed algorithm. The proposed algorithm denotes proper results than the formerly efforts [18]-[22]. The performance of the medical imaging algorithms are characterized by the statistical metrics such as sensitivity, specificity, positive predictive value, negative predictive value and accuracy [6]. The quantitative statistical data, such as sensitivity (Se), specificity (Sp), positive predictive value (Ppv), negative predictive val-ue (Npv), and accuracy (Acc) based on the ground truth data available in the DRIVE dataset. The four metric values for Se, Sp, Ppv, Npv, and Acc are given as follows:
True Positive (TP)-Sum of pixels identified as vessels similar to the ground truth image;
False Negative (FN)-Sum of pixels which are vessels in the ground truth image but identified as background;
True Negative (TN)-Sum of pixels which is identified as background just as in the ground truth image;
False Positive (FP)-Sum of pixels which are background in the ground truth image but identified as vessels. The calculations are done according to the following formulas:
TP Se
TP FN =
+ (9) TN
Sp
TN FP =
+ (10)
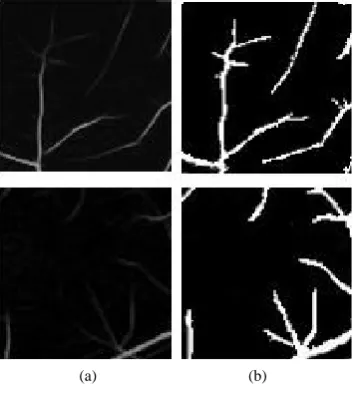
[image:6.595.156.473.245.497.2](a) (b)
Figure 5. Apply 2-D Gabor filter (a) Inverted input image; (b) Gabor response image.
[image:6.595.225.404.520.706.2](a) (b) (c) (d)
Figure 7. Retinal vessel segmentationprocess and results (a) Images from DRIVE dataset; (b) Images with adjusted illumination variation; (c) Manual segmentation; (d) Proposed
method results.
TP Ppv
TP FP
=
+ (11)
TN Npv
TN FN =
+ (12)
TP TN Acc
TP FP TN FN +
=
+ + + (13) The obtained results are compared with [18]-[22]. The statistical results of [18]-[22] and the proposed algorithm are represented in Table 1 and Table 2.
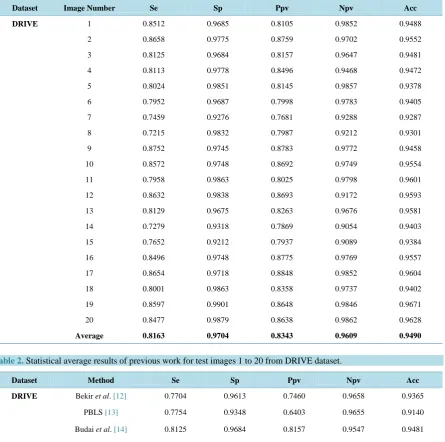
Table 1. Statistical results of proposed algorithm for test images 1 to 20 from DRIVE dataset, Se = percentage of correctly classified pixels compared to the ground truth image, Sp = percentage of the correctly classified background pixels, Ppv = percentage of the pixels that are correctly classified as vessel pixels, Npv = percentage of the pixels that are correctly
classi-fied as background pixels, Acc = percentage of correctly categorized pixels.
Dataset Image Number Se Sp Ppv Npv Acc
DRIVE 1 0.8512 0.9685 0.8105 0.9852 0.9488
2 0.8658 0.9775 0.8759 0.9702 0.9552
3 0.8125 0.9684 0.8157 0.9647 0.9481
4 0.8113 0.9778 0.8496 0.9468 0.9472
5 0.8024 0.9851 0.8145 0.9857 0.9378
6 0.7952 0.9687 0.7998 0.9783 0.9405
7 0.7459 0.9276 0.7681 0.9288 0.9287
8 0.7215 0.9832 0.7987 0.9212 0.9301
9 0.8752 0.9745 0.8783 0.9772 0.9458
10 0.8572 0.9748 0.8692 0.9749 0.9554
11 0.7958 0.9863 0.8025 0.9798 0.9601
12 0.8632 0.9838 0.8693 0.9172 0.9593
13 0.8129 0.9675 0.8263 0.9676 0.9581
14 0.7279 0.9318 0.7869 0.9054 0.9403
15 0.7652 0.9212 0.7937 0.9089 0.9384
16 0.8496 0.9748 0.8775 0.9769 0.9557
17 0.8654 0.9718 0.8848 0.9852 0.9604
18 0.8001 0.9863 0.8358 0.9737 0.9402
19 0.8597 0.9901 0.8648 0.9846 0.9671
20 0.8477 0.9879 0.8638 0.9862 0.9628
[image:8.595.94.540.133.575.2]Average 0.8163 0.9704 0.8343 0.9609 0.9490
Table 2. Statistical average results of previous work for test images 1 to 20 from DRIVE dataset.
Dataset Method Se Sp Ppv Npv Acc
DRIVE Bekir et al. [12] 0.7704 0.9613 0.7460 0.9658 0.9365
PBLS [13] 0.7754 0.9348 0.6403 0.9655 0.9140
Budai et al. [14] 0.8125 0.9684 0.8157 0.9547 0.9481 Marin et al. [15] 0.7067 0.9801 0.8433 0.9582 0.9452
Soares et al. [16] 0.7283 0.9788 - - 0.9466
[18]-[20] and the negative predictive value, which indicates the ratio of the pixels that are correctly classified as background pixels is better than previous studies [20][21].
The proposed algorithm is executed using MATLAB R2014a installed computer with a 2.53 GHz processor with 4 GB RAM. The computational runtime of the program is about 38 seconds.
4. Conclusion
images are represented by the proposed method. The performance of the proposed methodology is evaluated on the DRIVE database. The proposed algorithm segments the retinal vessels with a greater accuracy as compared to the previous attempts. There are two major problems with retinal fundus images. Whereas the illumination variation of certain areas in the fundus images and visibility of the vascular network is not clear of thin vessels and then an enhancement for retinal image is necessary to obtain better results of vessel segmentation. The illu-mination variation is adjusted using point operators and vessels are enhanced using a 2-D Gabor filter. Finally, vessel segmentation is done using region growing with automatic seed point selection. The proposed algorithm will help ophthalmologists in screening process of blood vessels to detect early stage of diabetic retinopathy.
References
[1] Onkaew, D., Turior, R., et al. (2011) Automatic Extraction of Retinal Vessels Based on Gradient Orientation Analysis. 8th International Joint Conference on Computer Science and Software Engineering (JCSSE), Thailand, 5 November 2011, 102-107.
[2] Rattathanapad, S., Uyyanonvara, B., et al. (2011) Vessel Segmentation in Retinal Images Using Graph Theoretical Vessel Tracking. Conference on Machine Vision Applications, Japan, 13-15 June 2011, 548-551.
[3] Hou, Y. (2014) Automatic Segmentation of Retinal Blood Vessels Based on Improved Multiscale Line Detection.
Journal of Computing Science and Engineering, 8, 119-128.http://dx.doi.org/10.5626/JCSE.2014.8.2.119
[4] Jeyasri, K., Subathra, P., et al. (2013) Detection of Retinal Blood Vessels for Disease Diagnosis. International Journal of Advanced Research in Computer Science and Software Engineering, 3, 6-12.
[5] Jahan, N. (2014) Detection and Segmentation Digital Retinal Blood Vessels Using Neural Network. International Journal of Engineering Research and Reviews, 2, 36-43.
[6] Osareh, A. and Shadgar, B. (2009) Automatic Blood Vessel Segmentation in Color Images of Retina. Iranian Journal of Science and Technology, 33, 191-206.
[7] Hamza, A., Taher, A., et al. (2013) An Improved Ant Colony System for Retinal Blood Vessel Segmentation. Fede-rated Conference on Computer Science and Information Systems,Poland, 8-11 September 2013, 199-205.
[8] Intriago, M., Uyaguari, F., et al. (2014) A Review of Algorithms for Retinal Vessel Segmentation. Latin American Journal of Computing, 1, 1140-1144.
[9] Kharghanian, R. and Ahmadyfard, A. (2012) Retinal Blood Vessel Segmentation Using Gabor Wavelet and Line Op-erator. International Journal of Machine Learning and Computing, 2, 593-597.
http://dx.doi.org/10.7763/IJMLC.2012.V2.196
[10] Dey, N., Bardhan, A., et al. (2012) FCM Based Blood Vessel Segmentation Method for Retinal Images. International Journal of Computer Science and Network, 1.
[11] Joshi, P.S. (2012) Retinal Blood Vessel Segmentation. International Journal of Engineering and Innovative Technolo-gy (IJEIT), 1, 175-178.
[12] Rattathanapad, S., Uyyanonvara, B., et al. (2011) Vessel Segmentation in Retinal Images Using Graph-Theoretical Vessel Tracking. Proceedings of the Conference on Machine Vision Applications,Nara, 13-15 June 2011, 548-551.
[13] Sukkaew, L., Uyyanonvara, B., et al. (2004) Automated Vessels Detection on Infant Retinal Images. Proceedings of the ICCAS, Bangkok, 25-27 August 2004, 321-325.
[14] Siddalingaswamy, P.C. and Prabhu, K.G. (2010) Automatic Detection of Multiple Oriented Blood Vessels. Journal of Biomedical Science and Engineering, 3, 101-107. http://dx.doi.org/10.4236/jbise.2010.31015
[15] Onkaew, D., Turior, R., et al. (2011) Automatic Extraction of Retinal Vessels Based on Gradient Orientation Analysis.
Proceedings of the Eighth International Joint Conference on Computer Science and Software Engineering (JCSSE), Nakhon Pathom, 11-13 May 2011, 102-107.
[16] Usman, M. and Khan, S.A. (2013) Multilayered Thresholding Based Blood Vessel Segmentation for Screening of Di-abetic Retinopathy. Engineering with Computers, 29, 165-173. http://dx.doi.org/10.1007/s00366-011-0253-7
[17] Niemeijer, M. and Van Ginneken, B. (2002) http://www.isi.uu.nl/Research/Databases/DRIVE/.
[18] Dizdaroglu, B., Cansizoglu, E., et al. (2014) Structure-Based Level Set Method for Automatic Retinal Vasculature Segmentation. EURASIP Journal on Image and Video Processing, 2014, 39.
http://dx.doi.org/10.1186/1687-5281-2014-39
[19] Lathen, G., Jonasson, J., et al. (2010) Blood Vessel Segmentation Using Multi-Scale Quadrature Filtering. Pattern Recognition Letters, 31, 762-767. http://dx.doi.org/10.1016/j.patrec.2009.09.020
Imaging, 2013, 1-11. http://dx.doi.org/10.1155/2013/154860
[21] Marin, D., Aquino, A., et al. (2010) A New Supervised Method for Blood Vessel Segmentation in Retinal Images by Using Gray-Level and Moment Invariants-Based Features. IEEE Transactions onMedical Imaging, 30, 146-158.
[22] Soares, J.V., Leandro, J.J., et al. (2006) Retinal Vessel Segmentation Using the 2-D Gabor Wavelet and Supervised Classification. IEEE Transactions on Medical Imaging, 25, 1214-1222.
[23] Marin, D., Kevin, J.C., et al. (2010) A New Supervised Method for Blood Vessel Segmentation in Retinal Images by Using Gray-Level and Moment Invariants-Based Features. IEEE Transactions on Medical Imaging, 30, 146-158.
[24] Walter, T. and Chutatape, O. (2002) A Contribution of Image Processing to the Diagnosis of Diabetic Retinopathy.
IEEE Transactions on Image Processing, 21, 1236-1243. http://dx.doi.org/10.1109/TMI.2002.806290
[25] Sinthanayothin, C., Boyce, J.F., Cook, H.L. and Williamson, T.H. (1999) Automated Localization of the Optic Disk, Fovea, and Retinal Blood Vessels from Digital Colour Fundus Images. British Journal of Ophthalmology, 83, 902-910.
http://dx.doi.org/10.1136/bjo.83.8.902
[26] Jiang, X. and Mojon, D. (2003) Adaptive Local Thresholding by Verification Based Multithreshold Probing with Ap-plication to Vessel Detection in Retinal Images. IEEE Transactions on Pattern Analysis and Machine Intelligence, 25, 131-137. http://dx.doi.org/10.1109/TPAMI.2003.1159954
[27] Jain, A. (1989) Fundamentals of Digital Processing. Prentice Hall, New York.
[28] Rossant, F., Badellino, M., et al. (2011) A Morphological Approach for Vessel Segmentation in Eye Fundus Images, with Quantitative Evaluation. Journal of Medical Imaging and Health Informatics, 1, 42-49.
http://dx.doi.org/10.1166/jmihi.2011.1006
[29] Bhattacharya, D., Devi, J., et al. (2013) Brain Image Segmentation Technique Using Gabor Filter Parameter. American Journal of Engineering Research (AJER), 2, 127-132.
[30] Yamani, L.S., Asif, K., et al. (2015) A Noval Method for Extraction of Retinal Blood Vessels Using Gabor Filter and Generalized Linear Model. Global Journal of Trends in Engineering, 2, 209-215.
[31] Gwetu, M.V., Tapamo, J.-R., et al. (2014) Segmentation of Retinal Blood Vessels Using Normalized Gabor Filters and Automatic Thresholding. South African Computer Journal, 55, 12-24.
[32] Kamdi, S. and Krishna, R.K. (2011) Image Segmentation and Region Growing Algorithm. International Journal of Computer Technology and Electronics Engineering, 2, 103-107.
[33] Dougherty, G. (2009) Digital Image Processing for Medical Applications. Cambridge University Press, New Delhi.