FUZZY CLUSTERING BASED ANT COLONY
OPTIMIZATION ALGORITHM FOR MR BRAIN IMAGE
SEGMENTATION
1P. HARI KRISHNAN, 2DR. P. RAMAMOORTHY
1
Research Scholar, Department of Electrical Engineering, Anna University, Chennai. 2
Dean-ECE, Electronics & Communication Engineering, SNS College of Technology, Coimbatore. E-mail: [email protected], [email protected]
ABSTRACT
The conventional methods for segmenting MR brain images with various noises were less effective. In this paper, we aimed for a novel method which intellectually determines the cluster centers before applying the (FCM) fuzzy c-means, thus increasing the iteration efficiency and reducing the computation time. The main
feature of this proposed method is to utilize Ant Colony Optimization Algorithm (ACOA) to initialize the
cluster centers and classification is made from thereafter using the initial values. Thus it helps to avoid the noisy pixel to be wrongly placed under any of the classes during the iterative process of FCM clustering algorithm, hence a better segmentation of MRI brain images which were scanned for detection of tumors was achieved. The methodology has been successfully carried out on Magnetic Resonance Imaging (MRI) images and efficient segmentation is was carried out on brain tumor images.
Keywords: Ant Colony Optimization Algorithm (ACOA), Fuzzy C-Means (FCM), Magnetic Resonance Imaging (MRI), Clustering and Brain Tumor.
1. INTRODUCTION
Image segmentation plays an important role in image analyses and was considered as one of the difficult and challenging problems in image processing technology [4]. It is a process of partitioning an image into non-overlapped and consistent regions which are homogeneous with respect to some image property such as intensity, color, texture and so on [8,9]. Image segmentation has a wide range of applications such as image content analysis, object recognition and computer-assisted medical diagnosis [7]. Related researches have been reported a considerable progress over the past decade. However, since in many cases images contain a significant amount of noise, causing the segmentation process a difficult one.
Image segmentation could be carried out through various modes of operations performed on a pixel or on different regions of an image. Off all the methods, Fuzzy based clustering method such as FCM algorithm [2] proved to be superior over the other clustering approaches in terms of segmentation efficiency. But the most important drawback of the FCM algorithm is the huge computational time required for convergence. In
this research, convergence rate is compared between the conventional FCM and the improved FCM. In the case of PCM [3], it relaxes the column sum constraint so that the sum of each
column satisfies the looser constraint
. 0
1
∑
= ≤< ci Uik c In other words, each element of
the kth column can be any number between 0 and
This paper is organized as follows. In Section 2, we review related works to our research. Section 3 describes our proposed ACOFCM clustering algorithm in detail and Section 4 shows results and comparison of our proposed algorithm. Finally, Section 5 contains discussion and conclusion.
2. RELATED WORKS
A series of researches were undertaken based on various clustering algorithms. The most reliable and better performing algorithms were discussed as follows.
2.1 Fuzzy C-Means (FCM)
Fuzzy clustering is also known as soft clustering, where the data elements can belong to more than one cluster, and associated with each element is a set of membership levels. The data points are given partial degree of membership in multiple nearby clusters. The central point in fuzzy clustering is always number of unique partitioning of the data in a collection of clusters. In this membership value is assigned to each cluster. Sometimes this membership has been used to decide whether the data points belong to cluster or not. The most widely used fuzzy clustering algorithm is FCM. The fuzzification parameter (m) in the range [1,n] was introduced, which determines the degree of fuzziness in the clusters. FCM is a method of clustering which allows one piece of data to belong to two or more clusters. The aim of FCM is to obtain the minimized objective function. The objective function is given equation (1)
∞ < ≤ =
=
∑
∑
−
=
m C
j
j i m ij N
i
m
X
C
J
1 1
2
1
||
||
µ
(1)Where m is the fuzzification parameter
and it is greater than 1. µij is a fuzzy membership
qualification indicating the membership of sample i to the j cluster. xi is the ith data point. cj is the
cluster center. || xi- cj || is the distance matrix from
a point xi to each cluster center to with taking the
Euclidean distance between the point and the cluster center. Although FCM was considered as a good clustering algorithm, the above algorithm also has some disadvantages. The computational time was more, Sensitivity to the initial guess, Sensitivity to noise. In order to enhance the outcome of the FCM, the algorithm is optimized using Ant Colony Algorithm based FCM.
2.2 Possibilistic C-Means Algorithm (PCM)
The Possibilistic C-Means method uses a Possibilistic type of membership function to demonstrate the degree of similarity. It is beneficial that the memberships for representative feature points are very high and unrepresentative points have low membership. The intention function, which suits the necessities, is as follows,
−
+
=
∑
∑
∑
∑
= = =
=
N
j
m ij c
i i N
j ij m ij c
i
m
x
c
d
J
1 1 1
2
1
)
1
(
)
,
,
(
min
µ
µ
η
µ
(2)Where, dij indicates the distance between the jth
data and the ith cluster center, µij represents the
degree of belonging, m indicates the degree of
fuzziness, ηi represents the appropriate positive
number, c represents the number of clusters, and
N represents the number of pixels. µij can be
found with the help of the following equation,
1 1 2
1
1
−
+
=
m
i ij ij
d
η
µ
(3)The value of ηi finds the distance at
which the membership values of a point in a cluster happen to be 0.5. The major merit of this Possibilistic C-Means method is that the value of
ηi can be set or modified based upon each
iteration. This can be achieved by modifying the
values of dij and µij. The Possibilistic C-Means
technique is highly robust in the occurrence of noise, in determining suitable clusters and in providing a robust approximation of the centers. Updating the membership values are based on the distance measurements.
However, as pointed out by Nikil et al. [3], the price PCM pays for its freedom to ignore noise points is that PCM is very sensitive to initializations, and it sometimes generates coincident clusters. Moreover, typicality can be very sensitive to the choice of the additional parameters needed by the PCM model. Timm et al. [13]–[15] proposed two possibilistic fuzzy clustering algorithms that can avoid the coincident cluster problem of PCM. The Euclidean distance performs better when a data set is dense or isolated and Mahalanobis distance considers the correlation in the data with the help of inverse of the variance-covariance matrix of data set which
is described as below,and xi, and yi represents the
mean values of two different sets of parameters, X
and Y. σi2 and σj2 represents the corresponding
variances, and ρij indicates the coefficient of
2.3 Ant Colony Optimization Algorithm (ACO)
Ant Colony Optimization (ACO) is a meta-heuristic scheme was first proposed by Marco Dorigo in 1992 [15] and Dorigo et al. [14]. Originally, it was used just for solving discrete swarm optimization problems [11]. ACO is based on the inspiration observed from the natural behavior of ant species [6]. ACO is a heuristic algorithm which has been proven a successful technique and applied to a number of combinatorial optimization problems. The ants deposit pheromone [5,6] on the ground for foraging at each pixel position of the image, according to the movements of a number of ants which are dispatched to move on the image. Furthermore, the movements of these ants are driven by the local variation of the image’s intensity values. Experimental results are provided to demonstrate the superior performance of the proposed approach on the cluster analysis based on the ant colony algorithm, data can be seen as different attributive ants and the cluster center can be seen as ants’ feeding source. Theoretically, if the quantity of pheromone remained the same over time on all edges, no route would be chosen. However, because of feedback, a slight variation on an edge will be amplified and thus allow the choice of an edge. The algorithm will move from an unstable state in which no edge is stronger than another, to a stable state where the route is composed of the strongest edges. Thus, data clustering process is just like the process of food source searched by ants [4].
The Ant Colony Optimization techniques has emerged recently as a relatively novel meta-heuristic for hard combinational optimization problems. It is designed to simulate the ability of ant colonies to determine shortest paths to food. Although individual ants possess few capabilities, their operation as a colony is capable of complex behavior. Real ants can indirectly communicate by pheromone [6] information without using visual cues and are capable of finding the shortest path between food sources and their nests. The ant deposits pheromone on the trail while walking, and the other ants follow the pheromone trails with some probability which are proportioned to the density of the pheromone. The more ants walk on a trail, the more pheromone is deposited on it and more and more ants follow the trail. Through this mechanism, ants will eventually find the shortest path. Artificial ants imitate the behavior of real ants how they forage the food, but can solve much more complicated problems than real ants can. A search algorithm with such concept is
called Ant Colony Optimization. Figure1 shows how the ants find the shortest path [18].
The algorithm usually consists of following steps:
Step 1: Initialize all parameters, n fault symptom samples can be regarded as n classes.
Step 2: Compute weighted Euclidean distance between samples Xiand Xj.
2
1
2
(
)
||
)
(
||
∑
=
−
=
−
=
m
k
jk ik k j
i
ij
D
X
X
P
x
x
d
(5)Pk is weighted factor which can be defined
according to every component’s contribution in clustering.
Step 3: Compute the pheromone quantity of trail, r is described as cluster center and
(
t
)
ij
τ
isintensity of the pheromone trail between Xiand Xj
at time t, set the intensity of pheromone trail to 0 at time 0.
{
d rr d ij
ij ij ≤ >
=
10τ
(6)Step 4: Compute the probability of mergering class Xiand Xj.
β α
β α
η
τ
η
τ
∑
=
=
S s
is is
ij ij
ij
t
t
t
t
t
P
)]
(
.[
)]
(
[
)]
(
.[
)]
(
[
)
(
(7)Where
S
{
s
|
d
r
,
s
1
,
2
,...,
n
}
is
≤
=
=
and ηij(t)is weight coefficient. It can reflect expectation of mergering class Xiand Xj.
Step 5: If Pij (t) ≥ P0 mergering Xi and Xj,
computing cluster center after mergering.
∑
=
∈
=
J
k
j k k
j
X
X
C
J
c
1
)
(
1
(8)
Step 6: Compute the biased error of the jth clustering.
∑ ∑
= =
−
=
J
k m
i
ji ki
j
x
c
D
1
2
1
)
(
(9)Where cji is the ith component of the jth cluster
center.
Step 7: Compute overall error
0
1
,
ε
ε
ε
=
∑
≤
=
D
if
kJ J , the whole process will
pause. Please output the number of clustering m
and cluster center
c
j .Otherwise, jumping step 3and continuing iteration.
3. PROPOSED ACOFCM ALGORITHM
that efficiency will be discounted. Thus, they cannot do clustering learning work in data mining. Secondly, most of clustering algorithm needs clustering numbers which are given by users. Consequently, clustering results are sensitive to clustering numbers. However, it is very difficult to assert the clustering numbers. Finally, it can drop into local optimization and find global optimum difficultly.
Using ant colony algorithm linked with FCM does fuzzy cluster. One aspect is the robustness of ant colony algorithm can endure the sensibility of FCM initialization. On the other hand, the parallel and distributed computing of ant colony algorithm accelerates convergence and increases clustering efficiency. FCM clustering is one of the fuzzy clustering algorithms and can give degree of membership of each sample. Matrix of degree of membership U can show the result of fuzzy clustering. U=[uij], where
=
<
<
=
=
∑
∑
= = m j ij n i ijc
i
n
U
n
j
U
1 1,....,
2
,
1
,
0
,...,
2
,
1
,
1
(10)Objective function of FCM is 2 1 1
||
||
)
(
∑ ∑
= =−
=
N j i j c i mij
x
w
U
J
(11)where wi is the ith clustering center, i=1,2,…,c;
j=1,2,…,N; m∈(1,∞) is weighted index. Objective function shows the sum of squares of weighted distance from each data member to relevant clustering center. Defining degree of membership as follows:
Step 1: Clustering numbers which are obtained from ant colony clustering algorithm can be regarded as classification c. Set allowable Emax and t=1.
Step 2: Clustering centers which are obtained from ant colony clustering algorithm can be regarded as FCM initialization clustering center wi(t), t=1,2,…,c.
Step 3: Compute degree of membership uij, where
i=1,2,…,c and j=1,2,…,n.
[
]
∑
= −=
c r m ir ij j ik
d
k
d
k
U
1 ) 1 /( 2))
(
/
)
(
(
1
)
(
(12)Where, m is weight coefficient.
Step 4: Amend all clustering center wi(t+1),
t=1,2,…,c.
∑
∑
= ==
+
n i m ij i m ij ni
U
k
x
k
U
k
w
11
(
)
)
(
)
1
(
(13)Step 5: Reduce the noise in a image Segment.
∑
=−
+
=
c i i it
w
t
w
e
1 2||
)
(
)
1
(
||
(14)If e<emax, the algorithm is over. Otherwise, t=t+1,
jumping step 3 and continuing iteration.
The FCM algorithm results in local optimal solution and hence the method is optimized using ACO. The FCM is integrated with ACO and is known as ACOFCM.
Algorithm for ACOFCM 1) Initialize input parameters (i,j) 2) For each ant k (currently in state i)
do Append the chosen move to the k-th ant's set. Until ant k has completed its solution
3) Determine the cluster center using ACOFCM. 4) For each ant move (ij)
do compute Dtij update the trail matrix.
5) Terminate when global optimal solution is reached or at end of iteration.
6) Else go to step (2).
4. EXPERIMENTAL RESULTS
(a) (b)
(c) (d)
(e)
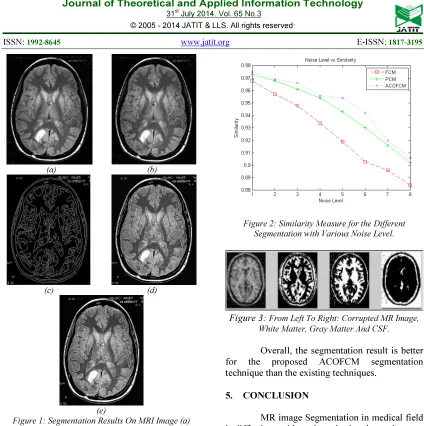
Figure 1: Segmentation Results On MRI Image (a) Original MRI Image (b) Segmented MRI Brain Image
Using FCM(c) Segmented MRI Brain Image Using ACO (d) Segmented MRI Brain Image Using PCM (e)
Segmented MRI Brain Image Using ACOFCM
When the noise level is 1, the similarity measure by using FCM is 0.969, PCM is 0.971 and 0.975 for using ACOFCM that us little higher than FCM and FCM techniques. When the noise level starts increasing, the difference will also start increasing. When the noise level is 5, the similarity measure is 0.947 for FCM, for the proposed ACOFCM. For the noise level of 10, the similarity measure is 0.864 for FCM, 0.896 for the proposed ACOFCM and 0.927 which is higher than the existing FCM and PCM segmentation techniques. The image, fig.3 shows the extraction of different regions (three regions) from the corrupted input image.
[image:5.595.85.509.73.499.2]Figure 2: Similarity Measure for the Different Segmentation with Various Noise Level.
Figure 3:From Left To Right: Corrupted MR Image, White Matter, Gray Matter And CSF.
Overall, the segmentation result is better for the proposed ACOFCM segmentation technique than the existing techniques.
5. CONCLUSION
MR image Segmentation in medical field is difficult to achieve the noise less image because of the noise occurrence in the captured image because of some faults in the capturing device. The new proposed algorithm developed by us will help the doctors for better diagnostic inferences in the case of brain tumors scanned through MRI or CT techniques.
[image:5.595.87.297.106.486.2]REFERENCES:
[1] Z. Yu, O. C. Au, R. Zou, W. Yu and J. Tian,
“An adaptive unsupervised approach toward
pixel clustering and color image
segmentation”, Pattern Recognition, vol.43,
no.5, pp.1889-1906, 2010.
[2] Jianzhong Wang, Jun Kong, Yinghua Lu,
Miao Qi and Baoxue Zhang, “A Modified FCM Algorithm for MRI Brain Image Segmentation Using Both Local And
Non-Local Spatial Constraints”, Elsevier
Computerized Medical Imaging and
Graphics, Pp. 685-698, 2008.
[3] Nikhil R. Pal, K. Pal, J.M. Keller and James
C. Bezdek, “A Possibilistic Fuzzy c-Means
Clustering Algorithm”, IEEE Transactions
on Fuzzy Systems, VOL. 13, NO. 4,
Pp.517-530, 2005.
[4] E. J. Pauwels and G. Frederix, “Finding
salient regions in images”, Computer Vision
and Image Understanding, vol.75, pp.73-85,
1999.
[5] S. L. Ho, S. Yang, H. C. Wong, K. W. E.
Cheng and Guangzheng Ni, “An Improved Ant Colony Optimization Algorithm and Its Application to Electromagnetic Devices
Designs”, IEEE Transactions on Magnetics,
Vol. 41, No. 5, pp.1764-1767, 2005.
[6] S.M.G. Rajkumar, K.Ramkumar and
S.Sarma O.V, “Real Time Application of
Ants Colony Optimization”, IJCA, Vol.
3,No.8, Pp.34-46, 2010.
[7] F. Klauschen, A. Goldman, V. Barra, A.
Meyer-Lindenberg and A. Lundervold, “Evaluation of auto-mated brain MR image segmentation and volumetry methods”,
Human Brain Mapping, vol.30, no.4,
pp.1310-1327, 2009.
[8] M. A. Jaffar, A. Hussain, A. M. Mirza and
A. Chaudhry, “Fuzzy entropy and
morphology based fully automated
segmentation of lungs from CT scan
images”, International Journal of Innovative
Computing, Information and Control, vol.5, no.12 (B), pp.4993-5002, 2009.
[9] G. Dong and M. Xie, “Color clustering and
learning for image segmentation based on
neural networks”, IEEE Trans. on Neural
Networks, vol.16, no.4, pp.925-936, 2005.
[10] Wenbing Tao, Hai Jin, Liman Liu, “Object
segmentation using ant colony optimization
algorithm and fuzzy entropy”, Elsevier,
pattern recognition Vol 28 2007, pp. 788-796.
[11] Hesam Izakian, Ajith Abraham, “Fuzzy
C-means and fuzzy swarm for fuzzy clustering
problem”, Expert Systems with Applications,
38 (2011) , 1835–1838.
[12] M. Barni, V. Cappellini, and A. Mecocci, “A
Possibilistic Approach to Clustering,” IEEE
Transaction on Fuzzy System, Vol. 4, No. 3,
Pp. 393–396, 1996.
[13] S. Ruan, C. Jaggi, J. Xue, J. Fadili, and D.
Bloyet, “Brain Tissue Classification of Magnetic Resonance Images Using Partial
Volume Modeling”, IEEE Transactions on
Medical Imaging, Vol. 19, No. 12, PP.
1179-1187, 2000.
[14] M. Dorigo, G. D. Caro, and L. M.
Gambardella, “Ant algorithms for discrete
optimization” Artificial Life, 5(2):137–172,
1999.
[15] M. Dorigo (1992) Optimization, “Learning
and Natural Algorithms”, Ph.D.
thesis,Dipartimento di Elettronica,