Journal of Theoretical and Applied Information Technology
10th January 2016. Vol.83. No.1 © 2005 - 2015 JATIT & LLS. All rights reserved.
ISSN: 1992-8645 www.jatit.org E-ISSN: 1817-3195
100
ICTAL EPILEPSY AND NORMAL EEG FEATURE
EXTRACTION BASED ON PCA, KNN AND SVM
CLASSIFICATION
SISWANDARI NOERTJAHJANI1, ADHI SUSANTO2, RISANURI HIDAYAT3, SAMEKTO WIBOWO4
1PhD Student at Electrical Engineering and Information Technology Dept. Faculty of Engineering Gadjah Mada UniversityYogyakarta Indonesia
23 Electrical Engineering and Information Technology Dept.Faculty of Engineering Gadjah Mada University Yogyakarta Indonesia
4Neurology Dept.Faculty of Medicine Gadjah Mada University Yogyakarta Indonesia
1
Departmentof Electrical Engineering and Information Technology Muhammadiyah Semarang University
Semarang, Indonesia
E-mail: [email protected]/[email protected], [email protected],[email protected], [email protected]
ABSTRACT
Driven by a deep interest to find some spesific epilepsy EEG signal features as compared with normal ones. An array of electrodes, normaly the FP1, FP2, F7, F3, F2, F4, F8, C3, CZ, C4, T3, T4, T5, T6, P3, P4, PZ, O1, and OZ. The recorder signals were than processed and the standard sets of statistical quantities of means, variances, skewnesses, kurtosises, entropies, minima and maxima. Principal Component Analysis (PCA) were applied to these quantities to acquire two major one representing each quantity which separate best between epilepsy ictal and normal persons resorting to the SVM and KNN classification algorithms. The results show that the PCA elevates accuracy significantly and KNN achieves the mission better than SVM.
Keywords : Ictal, Normal, PCA, KNN, SVM
1. INTRODUCTION
Epilepsy is a neurological disorder in human brain which can affect persons of all ages. Report by the World Health Organization (WHO), worldwide over 50 million people sufferfrom epilepsy [1–3], while over the course of a life time, 100 million people will experience an epileptic episode and Globally about 59 millions epileptic patients [5], the majority are from the developingcountries[4].EEGsignals are used to monitor and evaluate brain neurological activities as well as disturbances normally in epilepsy persons. Early detections are carried out to normal people who are potential to epilepsy signals. Therefore, a variety of EEG signal processings have been developed to early detect epileptic phenomena. This research is intended to find the right signal processing scheme with high sensitivity to epilepsy signals, so that medication can be done with minimum risk of brain damage. Feature extraction plays important role in recognizing the signal specific patterns, especially in finding the expected ictal
signals apart from the normal ones.
A number of time-domain methods have been proposed to detect and classify the attack types.Classificationof seizure and seizurefreeEEG signals using localbinary patterns [7],Epileptic seizure detection using different transformation techniques[6].Detection of temporallobe epilepsy using support vector machines[7][12][14], wavelet[11][13][15][16].New feature extraction approach for epileptic EEG signal detection using time-frequency distributions[10], using artificial neural networks [9].
2. MATERIAL AND METHOD
Semarang, under the supervision of Prof. Dr. dr. Zaenal Muttaqin, Ph.D.,Sp.BS(K), and 50 normal patients as well.Figure 2 show original EEG signal for normal (a) and ictal epilepsy (b).Before data recordings, the Epilepsy Patients must refrain from medication, and the data recordings proceeded for a number of days. The 19 electrodes were placed on
the head skin of the patients according to the International 10-20 Electrode Position System and the data sampling frequency is 256 Hz.Specifically the Intracranial was carried out under epilepsy neurosurgery and the measuring chip was placed in the brain.
2.1 Principle Component Analysis (PCA)
PCA can be used to reduce the dimension of the data without sacrificing significantly the intended characteristics of the data.
[image:2.612.75.269.317.717.2]P
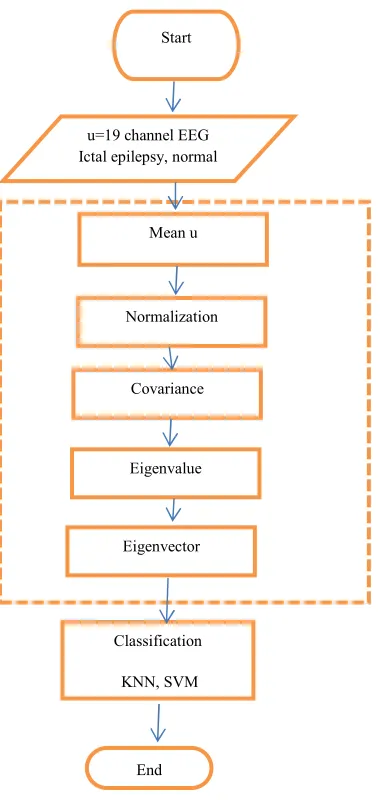
Figure 1. The flowchart of research the overall
PCA steps
The raw data are represented in an nxm matrix. namely = [ , , . . . , ]
1. Mean vector
= 1 ,
2. Finding the normalizationdata matrix (norm data).In this step the norm data are found by subtracting the original matrix elements by the respective means
Norm = −
3. Obtaining the covariance matrix
The covariance matrix, as slated earlier, is obtained by vector multiplication below;
=
4. Recording the related Eigenvalues ∝ ; of the covariance matrix, so that
∝ >∝ > . . . >∝
5. Registering the respective eigenvectors:
, , . . . ,
2.2 K-Nearest Neighbour (KNN)
KNN is a classification method for a set of data based onleast distances from each data points to the existing representative class points, including those determined through Query instance according to the preceding classification work under nearest majority distance categorization.
2.3 SVM (Support Vector Machine)
Let’s assume we can separate the data perfectly[8]. Then we can optimizethe following:
Minimize ‖ ‖ , subject to
( + ) ≥ 1, if = 1
( + ) ≤ −1, if = −1
The last two constraints can be compacted to ( + ) ≥ 1
3. RESULT
3.1 Pre-Signal Processing
The one second EEG Recording covers the Ictal signal where the Spike Epileptic Form presents. The Medical Doctor decides clinically the one second position of specific interest backed up by video recording of the seizure. At the beginning of this 256 data sample intensive observation is focused on the semiology of the following time
u=19 channel EEG Ictal epilepsy, normal
Mean u
Classification
KNN, SVM Eigenvector
Normalization
Covariance
Eigenvalue Start
102 span times sample frequency. Mark the position of the electrodes for intracarnial and clinical condition of the patient. For every ictalcondition the seven statistical parameters, namely the means, variances, skewnesses, kurtosises, entropies, minima, and maxima values, for each patient were recorded.
Figure2 Original EEG signal for normal (a) and ictal epilepsy (b)
3. 2. Feature Extraction
The 19 channel electrode signal features were computed from 50 signals with the respective means, variances, skewnesses, kurtosises, entropies, minima, maxima, to get 50x19 matrix of signal features or feature vectors. The raw number 1 to 25 signals of ictal, raw number 26 to 50 signals of normal
persons.! "# , !$#% # &",
!' "( "'', ! % )' ', !" %)*+, !
#,, ! #- #,
.
! #- #,are ordered in the following matrix format
. / / /
0FP1FP1 FP2FP2 … Pz… Pz O2O2
… … … … …
… . … . … … …
FP178 FP278 … Pz78 O2789
: : : ; . / / /
0297 222 … 890 725380 740 … 243 270
… … … … …
39 29 … 178 162
47 25 … 156 1119:
: : ;
Then the Covariance matrix is
. / / /
08317089350 111810 … 112810 11917089350 … 94370 97780
… . … … … …
94370 112810 … 133390 141010
97780 119170 … . 141010 1807109:
: : ;
And the Eigenvector matrix is
. / / /
0 0.1663 0.1701 0.2923 … 0.2004 … 0.2261 0.0901 −0.2714 0.2622
… . … … … …
−0.0020 0.1268 … 0.0434 −0.0773
0.1150 0.5686 … . −0.0178 −0.05179:
: : ;
Then eigenvalueare in decreasing order
/ / / / / / / / / / / / / / / / / / 0 DE1DE2
DE3 DE4 DE5 DE6 DE7 DE8 DE9 DE10 DE11 DE12 DE13 DE14 DE15 DE16 DE17 DE18 DE19:: : : : : : : : : : : : : : : : : ; = . / / / / / / / / / / / / / / / / /
0 2426200108800 43100 18700 13200 10300 6000 5200 3700 3500 2100 1600 1200 700 600 300 300 100
100 9:
: : : : : : : : : : : : : : : : ; 3.3Features Selection
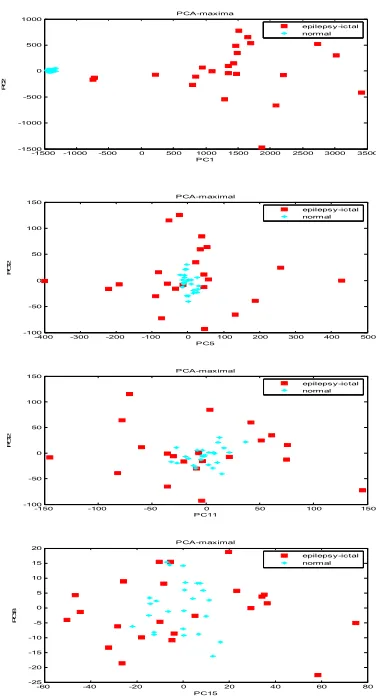
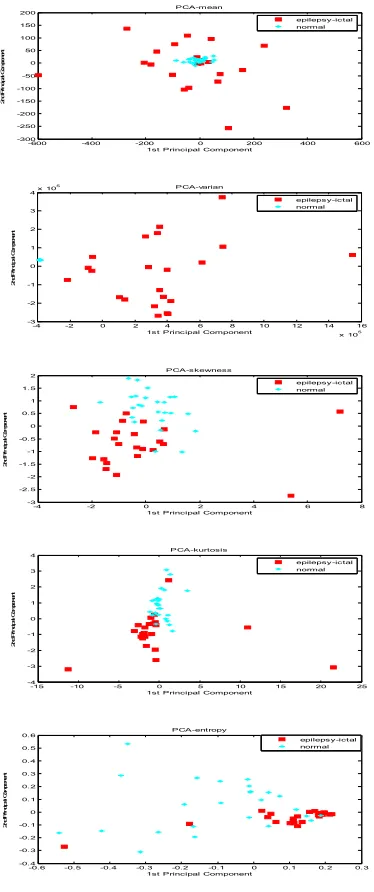
After features extraction process, the best representing ones are chosen for the following step where the classification prosesses are practical to carry out.Figure 3 shows the ictal epilepsy and normal signals and their spesific values of the assosiated means, variances, skewness, kurtosis, entropies, minima and maxima. The eigenvalues PC1 up to PC19 are listed in the decreasing order. In percentage the recorded data are shown in table 1. Figure 4 shows the points spreads representing the effectiveness of the PC’s for class discriminations and Figure 5 shows the Dots Plots for each statistical parameters.
X = mean
0 200 400 600 800 1000 1200
-600 -400 -200 0 200 400 600 a m p lit u d e samples
0 200 400 600 800 1000 1200
Y= variance
Z=skewness
R= kurtosis
U=entropy
P=minima
[image:4.612.318.506.365.715.2]Q= maxima
Table 1 percentage variance PC1 – PC19
X %
Y %
Z %
R %
U %
P %
Q %
PC1 67 89 49 67 40 94 92
PC2 18 7 19 8 23 3 4
PC3 8 1 6 7 12 1 2
PC4 3 1 5 5 10 1 1
PC5 1 1 4 3 4 0 0
PC6 1 1 3 2 3 0 0
PC7 1 0 3 2 2 0 0
PC8 0 0 2 1 1 0 0
PC9 0 0 2 1 1 0 0
PC10 0 0 2 1 1 0 0
PC11 0 0 1 1 1 0 0
PC12 0 0 1 1 1 0 0
PC13 0 0 1 1 1 0 0
PC14 0 0 1 0 0 0 0
PC15 0 0 1 0 0 0 0
PC16 0 0 0 0 0 0 0
PC17 0 0 0 0 0 0 0
PC18 0 0 0 0 0 0 0
PC19 0 0 0 0 0 0 0
Figure3Percentage graphical comparation of the effectivenes of the statistical parameters in terms of the PC’s
-1500 -1000 -500 0 500 1000 1500 2000 2500 3000 3500
-1500 -1000 -500 0 500 1000
PC1
P
C
2
PCA-maxima
epilepsy-ictal normal
-400 -300 -200 -100 0 100 200 300 400 500
-100 -50 0 50 100 150
PC5
P
C
1
2
PCA-maximal
epilepsy-ictal
normal
-150 -100 -50 0 50 100 150
-100 -50 0 50 100 150
PC11
P
C
1
2
PCA-maximal
epilepsy-ictal normal
-60 -40 -20 0 20 40 60 80
-25 -20 -15 -10 -5 0 5 10 15 20
PC15
P
C
1
8
PCA-maximal
104
Figure4 The points spreads representing the effectiveness of the PC’s for class discriminations
Figure5 The Dots Plots for each statistical parameters.
3.4Classifications based on KNN and SVM
The 100 raw data consist of 50 for training, where 25 are ictal and 25 are normal, and the other 50 are for testing where 25 are ictal and 25 are normal as well.
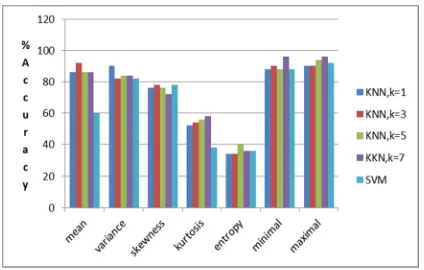
[image:5.612.98.285.218.664.2]Figure 6 shows maximum values for KNN k=7, which are 96% and with SVM the highest is 92%. This high accuracy of 96 % is also reached with respect to the minima and maxima where KNN k = 7. On the other hand the accuracies of kurtosis and entropies with KNN as well as SVM drop to bellow 60 %. Likewise for skewness the accuracies with KNN and SVM are above 70 %, likewise for mean, variance the accuracies with KNN and SVM are above 80% while with SVM mean is 60 %.
Figure 7 shows maximum values for KNN k=3,5,7, which are 92% and with SVM the highest is 100%. This high sensitivity of 92 % is also reached with respect to the mean and maxima. On the other hand the sensitivity of kurtosis and entropies with KNN as well as SVM drop to bellow 70 %. Likewise for skewness the sensitivity with KNN and SVM are above 70 %, likewise for mean, variance the sensitivity with KNN and SVM are above 80% while with SVM mean is 100 %.
-25 -20 -15 -10 -5 0 5 10 15 20
-20 -15 -10 -5 0 5 10 15 20 25 PC18 P C 1 9 PCA-maxima epilepsy-ictal normal
-600 -400 -200 0 200 400 600
-300 -250 -200 -150 -100 -50 0 50 100 150 200
1st Principal Component
2 n d P ri n c ip a l C o m p o n e n t PCA-mean epilepsy-ictal normal
-4 -2 0 2 4 6 8 10 12 14 16
x 105
-3 -2 -1 0 1 2 3 4x 10
5
1st Principal Component
2 n d P ri n c ip a l C o m p o n e n t PCA-varian epilepsy-ictal normal
-4 -2 0 2 4 6 8
-3 -2.5 -2 -1.5 -1 -0.5 0 0.5 1 1.5 2
1st Principal Component
2 n d P ri n cip a l C o m p o ne n t PCA-skewness epilepsy-ictal normal
-15 -10 -5 0 5 10 15 20 25
-4 -3 -2 -1 0 1 2 3 4
1st Principal Component
2 n d P ri n c ip a l C o m p o n e n t PCA-kurtosis epilepsy-ictal normal
-0.6 -0.5 -0.4 -0.3 -0.2 -0.1 0 0.1 0.2 0.3
-0.4 -0.3 -0.2 -0.1 0 0.1 0.2 0.3 0.4 0.5 0.6
1st Principal Component
2 n d P ri n c ip a l C o m p o n e n t PCA-entropy epilepsy-ictal normal
-4000 -3000 -2000 -1000 0 1000 2000
-1000 -800 -600 -400 -200 0 200 400 600 800
1st Principal Component
2 n d P ri n c ip a l C o m p o n e n t PCA-minima epilepsy-ictal normal
-1500 -1000 -500 0 500 1000 1500 2000 2500 3000 3500
-1500 -1000 -500 0 500 1000
1st Principal Component
Figure 6.Result of selected feature (1st Principle Component and 2nd Principle Component) accuracy
KNN, SVM
Figure7.Result of selected feature (1st Principle Component and 2nd Principle Component) Sensitivity
KNN, SVM
4. CONCLUSION
We concluded our research based on experiment and performance test result feature reduction using PCA assure that selected feature is the most principal feature of signal ,the best representivepresentageparameters are variance, minima, maxima shown in tabel 1,the ictal and normal signal accuracies of KNN are much higher than SVM.
REFERENCES
[1] WHO (World Health Organization) Report http://www.who.int/mediacentre/ctssheetsfs99 9 / en/index.html_(accessed February 2011). [2] ILAE IBE, WHO, Atlas Epilepsy Care in
theWorld2005: GlobalCampaign Against Epilepsy, World Health Organization,2005 [3] E.H Reynolds, The ILAE/ IBE/ WHO, global
campaignagainst epilepsy out of the shadows,Epilepsy Behav. 1 (2000) S3–S8 [4] Siuly Siulyi, Yan Li,” Designing a robust
feature extraction methodbased on optimum
allocation and principalcomponent analysis for epileptic EEG signalclassification,” journal of computer methods and programs in biomedicine 119 (2015) 29-42
[5] Mohammad ZavidParvez, ManoranjanPaul, ”Epileptic seizure detection by analyzing EEGsignals using Different transformation techniques “, journal of Neurocomputing 145 (2014) 190-200.
[6] T. Sunil Kumar, Vivek Kanhangad, Ram Bilas Pachori, ‘‘Classificationof seizure and seizurefreeEEG signals using localbinary patterns’’, Journal of Biomedical Signal Processing and control 15 (2015)33–40 [7] Diego Cantor-Rivera, Ali R Khan, Maged
Goubran, et al, ‘‘Detection of temporallobe epilepsy using support vector machinesin multi-parametric quantitative MR imaging,’’ Journal Computerized Medical Imaging and Graphics 41(2015) 14-28.
[8] Jason Weston, Support Vector Machine Tutorial, NEC Labs America 4 Independence Way, Princeton, USA
[9] Ling Guo , Daniel Rivero, Julián Dorado, Juan R. Rabun˜ al, Alejandro Pazos, ‘‘Automatic epileptic seizure detection in EEGs based on line length feature and artificial neural networks ’’, Journal of Neuroscience Methods 191 (2010) 101–109
[10] Carlos Guerrero-Mosquera et al,”New feature extraction approach for epileptic EEG signal detection using time-frequency distributions,” journal of Med Biol Eng Comput (2010) 48:321–330
[11] Shengkun Xie, Sridhar Krishnan,”Wavelet-based sparse functional linear model with applications to EEGs seizure detection and epilepsy diagnosis,” journal Med Biol Eng Comput (2013) 51:49–60
[12] Nicoletta Nicolaou,JuliusGeorgiou,“Detection of epileptic electroencephalogram based on Permutation Entropy andSupport Vector Machines “, journal of Expert Systems with Applications 39 (2012) 202–209
[13] Guangyi Chen, “Automatic EEG seizure detection using dual-tree complex Wavelet Fourier features, “ journal of Expert Systems with Applications 41 (2014) 2391–2394 [14] Abdulhamit Subasi a, M. Ismail Gursoy b,
“EEG signal classification using PCA, ICA, LDA and support vector machines “, journal of Expert Systems with Applications 37 (2010)
8659–8666
106 journal of Clinical Neurophysiology 122 (2011) 656–663