ISSN: 1992-8645 www.jatit.org E-ISSN: 1817-3195
UNBIASED ASSESSMENT METHOD FOR VOICE
COMMUNICATION IN CLOUD VOIP-TELEPHONY
KONSTANTIN SERGEEVICH LUKINSKIKH
Company NAUMEN (Nau-service), Tatishcheva Street, 49a, 4th Floor, Ekaterinburg, 620028, Russia
ABSTRACT
This paper covers the issues of unbiased assessment of voice communication quality in cloud VoIP-telephony. For the solution of this task, the main quality criteria from the point of view of a common user are as follows: unnatural voice (robot voice); delays in voice transmission one way or other way; echo; signal interruptions (both long and any short stirs); amplitude changes (overloaded or too quiet voice); extraneous noise caused by environment and equipment of connecting subscribers, transmitting medium or digital signal processing methods. Also, basic requirements related to cloud are: the solution applied should not create extra load in the network and it should be able to automatically control the quality at the section between client and service. Existing quality assessment methods are compared, namely E-model, PSQM, PSQM+, PESQ, P.563, finally it is chosen to develop a methodology based on P.563. The developed expansion of the methodology is oriented at problems elimination due to a sequence of assessments: analysis of signal’s statistical parameters; analysis of vocal track consistency; analysis of timing errors instead of a single aggregate assessment, as well as extra assessments of echo and volume level assessment.
Keywords:Voip Cloud Service, Quality Of Voice Communication, P.563, Voip, Echo Assessment, Volume
Level Assessment.
1.
INTRODUCTIONAlong with the widespread of broadband Internet, VoIP technologies are gaining more and more popularity. Such trend is caused by various reasons including relatively low cost of communication services (especially international) with acceptable quality, simple use and flexible infrastructure, ability for integration with various information systems and Internet services.
The success of Skype may be illustrative, in 2013 some 36% of international communications market were taken up [1]. Such result was caused by a number of factors, the main are free communication between Skype clients, free, available and simple client’s software, ability to work in network infrastructure limited conditions are important as well.
But, being de facto a standard in consumer sector of international communications, Skype in corporate sector is often losing to more centralized VoIP solutions built on a number of technologies established around SIP protocol [2]. In particular, such centralized solutions allow for collecting statistics, control and adjustment from a single point, building centers for distributed processing of incoming and outcoming voice traffic based on a single information system. It is logical that such technologies are becoming the basis of most
modern call-centers, large corporate sales departments and remote support centers.
Growing popularity of VoIP in corporate sector together with another contemporary trend in information technologies – cloud computing – created a great number of products granting end-user the advantages of centralized IP-telephony system but not requiring much investments in building and support of own infrastructure. The range of solutions offered on that market varies greatly from cloud PBX [3], [4] offering only IP-telephony functions, to complex CRM [5] and other information systems which functions include voice communication via Internet. Depending on those functions, the solutions offered on that new market are niched and competition is exercised mainly due to the attempts in getting the best communication quality at maximally possible low costs. Thus it is obvious that any cloud platform of IP-telephony regardless from its other functions having no regard to communications should employ a number of efficient technologies and methods ensuring maximal voice transmission quality.
ISSN: 1992-8645 www.jatit.org E-ISSN: 1817-3195 The general level of quality from end user’s point
of view is determined by the three basic factors:
quality of voice information transmission;
availability of communication functions at a random moment;
quickness of client’s needs processing.
From those needs, final quality criteria of modelling system follow:
realization of the required range of functions;
ensuring maximal quality of voice transmission;
high productivity;
stability to various faults.
The criterion reflecting the range of functions realized for end user is hard to apply for the whole aggregate of IP-telephony systems available in the market due to its subjectivity. Therefore most attention in this paper will be paid to control and ensuring quality of voice transformation.
1. Voice communication quality control in cloud IP-telephony
Before describing the methods applied in cloud IP-telephony to ensure optimal quality of voice transmission it is needed to consider which criteria determine that characteristic, which factors cause quality degrading and see the specifics of cloud architecture which should be accounted for while adapting the existing methods of assessment and optimization of quality in IP-telephony networks.
1.1 Quality criteria
As a rule, the models built for assessment of communication quality in VoIP networks do not specify biased quality criteria, being focused on some or other parameters of digital signal. However those criteria are obvious and are based first of all on the absence of distortions and noises in transmitted voice like:
unnatural voice (robot voice);
delays in voice transmission in one or another direction;
echo;
signal interruptions (both long and any short stirs);
amplitude changes (overloaded or too quiet voice);
extraneous noise caused by environment and equipment of connecting subscribers, transmitting medium or digital signal processing methods.
It is logical that an adequate model of unbiased assessment of voice quality should to some extent reflect all those biased criteria, but in case of IP-telephony services built on cloud architecture part of the issues specified above is caused by the factors staying beyond the medium of hardware, automated system or service staff. The impact of those factors may be possible to estimate but such assessment is excessive and will not assist to the quality management while may complicate it in some cases. From that point of view, it is important to consider the specifics of cloud architecture in developing communication quality management methods.
1.2 Quality degradation factors
[image:2.612.313.525.478.548.2]Voice transmission via digital networks depends on a lot of factors. The highest effect is exercised as a rule by the number of channels transmitting signals between clients and web service’s switches. Meantime, geographic distance between connecting subscribers may not play any part if an optimal route of signal is chosen, and simultaneously geographically close subscribers may experience difficulties in communication when communication station (service point) is remote from them and the route is a loop. Voice signal transmission scheme is shown on Figure 1.
Figure 1. Voice Signal Transmission Scheme
Non-optimal network conditions in dashed line may cause problems like interruptions and voice delays. Interruptions appear when jitter in the network (transit time spread of packets delivery within the network) reaches the values exceeding the buffer of commutator in time. Delays as a rule are conditioned by slow delivery of packets or their slow processing due to low productivity of client’s computer.
ISSN: 1992-8645 www.jatit.org E-ISSN: 1817-3195 include wrong codec or communications protocol
use.
Accounting for those two groups of factors the task on optimization of voice transmission is divided into two subtasks capable for automation:
search for signal processing methods ensuring maximal possible voice quality in current network conditions;
search for ways to improve network conditions (change of route by changing client’s binding to another communication station).
In case if the problem is not solvable automatically, service administrators should receive statistical information sufficient for making infrastructure decisions (placing a new communication station) or consulting users on the matters of communication conditions improvement on their side.
However, first of all it is required to find objective presence of a problem. That is solved by a number of methods among which the most suitable for the architecture should be specified and adapted.
2.
CHOOSING OPTIMAL METHOD OFVOICE COMMUNICATION QUALITY ASSESSMENT
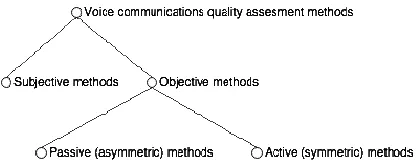
Voice communication quality assessment methods have already been studied in various sources. All they are divided into subjective and objective. Subjective (biased) methods need for expertise at the final destination. The most widespread method is MOS (Mean Opinion Score) – building the final assessment as arithmetic average of expert assessments [6].
Subjective assessment is easy to realize within a web service but is often senseless. For instance, new service users tend to compare service quality with the best other services, lowering the assessment and marking problems when they do not exist objectively. Besides, often users are not interested in putting marks and may just stop using a service in case of problems. Thus, it is very important to exclude end user from voice quality assessment tool or make his/her participation minimal and not compulsory.
2.1 Review of existing objective assessment
methods
Methods for objective assessment of voice communication quality in packet based networks may be divided into methods analyzing network conditions, e.g., E-model (G.107), [7] and methods analyzing resulting audio stream: PSQM/PSQM+ (Perceptual Speech Quality Measure) [8], PESQ (Perceptual Evaluation of Speech Quality) [9], P.563 [10]. Based on the above methods, a lot of proprietary algorithms and finished products were made for the analysis of voice communication quality in a network, such as Cisco Network Analysis Module [11].
Methods for assessment of voice communication quality analyzing the final audio stream may be divided into passive and active [12]. Active methods are built on comparing system’s input and output audio stream principle. Those methods ensure high accuracy but create extra network traffic and make objective assessment impossible if the beginning of signal pathway is outside the system and initial signal cannot be taken or is hard to take.
Passive methods, on the contrary, analyze audio signal in one of system’s points (as a rule, in the final) by detecting some or other defects, not comparing with the initial signal. Such methods are less accurate compared to active but they do not create extra load on the network and are less dependent on service architecture.
[image:3.612.313.522.513.597.2]Voice communication quality assessment methods are shown on Figure 2.
Figure 2. Voice Communication Quality Assessment Methods
ISSN: 1992-8645 www.jatit.org E-ISSN: 1817-3195
2.2 Specifics of IP-telephony cloud service
Accounting for relative youth of cloud computing technologies it is obvious that most of existing analysis methods for voice information transmission via VoIP networks were developed not considering possible use in the services based on cloud architecture.
It is required to take into account the specifics of such services and form a number of criteria which will help to choose the optimal solution and improve it.
One of the core specific features of cloud services is their remoteness to end user which will inevitably effect the communication quality [13]. While the number of channels between a cloud service and its providers is strictly limited and information transmission quality is significantly subject to control and management via direct cooperation between cloud service staff and communication provider, the number of channels formed between end user and a cloud service as a rule is constantly growing while their quality is often insufficient and quality control is hard or impossible.
That specific feature creates two requirements to the solution in connection with voice communication control:
1. the solution should not create extra traffic in the network between a cloud service and end user;
2. the solution should be capable for automated quality control at the network section between client and service, as other sections are manually controlled.
Besides that, remoteness of a cloud service implies using standard web browsers [14]. Thus, the process of quality analysis should fully be exercised on cloud service servers, requiring no installation of extra software by customers and no extra computing load for his/her computer.
As the required solution should fully function on service’s side, it should be highly productive so that not to prevent servers from main operations.
One more specific feature of cloud architecture is its distribution. The solution applied should take into account that specific feature for making recommendations or automated solutions regarding quality, therefore it should have access to information about cloud service’s structure, i.e., be integrated into service’s information system on service’s database and application programming interfaces level.
Finally, psychological aspect should be taken into account. Part of service’s clients will inevitably find the available quality non-optimal, therefore it is required to change threshold levels of quality at which notifications are sent to administrators and automated quality control tools are activated. If that specific feature is taken into account, it becomes clear that the chosen solution should analyze the resulting audio file but not, for example, network parameters as the problems observed by clients are more simple for analysis of audio file.
2.3 Choosing prototype accounting for specifics
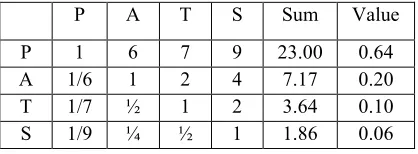
For assessment of available analogues, Saati’s criteria pairwise comparison method was used [15]. In that case, the integral assessment is represented as a sequence:
(1)
In (1), I – integral assessment of solution, P – assessment in connection with criterion of operation ability in packet based network, A – assessment in connection with asymmetric operation of solution (operation only at one of connecting sides), T – assessment of no extra network traffic criterion, S – analysis ability of the resulting audio file, R – coupling matrix. That model does not consider productivity and integration criteria as those parameters greatly depend on exact software implementation of the method rather than on the method itself.
[image:4.612.314.523.559.636.2]Pairwise comparison scale is ranked from 1 to 9, where 1 is equality, 9 – full superiority. Pairwise comparison matrix is in Table 1.
Table 1. Distribution Of Assessment Criteria’s Relative Values
P A T S Sum Value
P 1 6 7 9 23.00 0.64
A 1/6 1 2 4 7.17 0.20
T 1/7 ½ 1 2 3.64 0.10
S 1/9 ¼ ½ 1 1.86 0.06
Similar methods are assessed by criteria in Table 2 where 1 means the availability of the characteristic in question and 0 – its absence. Integral assessment I is calculated as follows:
ISSN: 1992-8645 www.jatit.org E-ISSN: 1817-3195 In (2), αi — relative value of assessment
[image:5.612.90.299.180.271.2]criterion, si — assessment by criterion, n — number of criteria.
Table 2. Assessment Of Similar Methods Taking Into Account Assessment Criteria Weights
P A T S I
E-model 1 1 1 0 0.94
PSQM 0 0 0 1 0.06
PSQM+ 1 0 0 1 0.70
PESQ 1 0 0 1 0.70
P.563 1 1 1 1 1.00
As seen from the assessment taking into account assessment criteria weights, asymmetric method of audio stream analysis P.563 should be taken as the prototype.
3. ADAPTATION OF PROTOTYPE TO
IP-TELEPHONYCLOUDSERVICE
For realization and implementation of the solution in connection with voice information transmission quality control in cloud IP-telephony it is required to consider the prototype selected at the previous stage in detail, based on models of the most important tools used in its work.
3.1 Modelling and criticizing prototype
P.563 standard describes the stages of voice signal analysis including preliminary processing and formatting of signal and generation of final assessment. Simplified algorithm of P.563 is shown on Figure 3.
Figure 3. Algorithm Of P.563 Method Operation
As seen from the scheme on Figure 3, the basic stages of analysis are assessment of unnaturalness, finding background noises and temporary distortions of signal.
Unnatural voice is analyzed by three parallel stages:
• analysis of statistical characteristics of signal;
• analysis of consistency of vocal track;
• analysis of time base errors.
Statistical analysis uses linear prediction factors to find deviation of signal from the normal distribution and the conclusion on voice unnaturalness is made based on average factor of cepstrum asymmetry:
(3)
where γn— factor of cepstrum asymmetry for audio
frame n, found as follows:
(4)
where m = 1…M — number of cepstrum factor, σn — standard deviation for n-th audio frame. Lower values of factor of cepstrum asymmetry (0 – 1) inform about higher level of voice distortion while values within the range 2 – 4 are deemed acceptable.
The next stage is analysis of vocal track consistency: audio stream is divided into crossing sections with pre-set pitch of sound transmitted. At each such stage 8 elements long, surface area for various reflection factors µ:
(5)
Reflection factors correspond to the eight sections of vocal track from larynx to lips; the areas so obtained are reduced to three cavities: m = 1..3 — back, m = 4..6 — middle, m = 7, 8 — front. To make voice natural, for each audio frame the difference between adjacent cavities in modulus should not exceed 0.25.
[image:5.612.91.299.534.713.2]ISSN: 1992-8645 www.jatit.org E-ISSN: 1817-3195 are detected: if audio frames are cycling on a
section under 160 ms long, such section is considered unnatural signal peak.
Analysis of background noise includes the assessment of static noise and segment ratio signal/noise (multiple noise).
Analysis of static noise depends on voice activity determined at the stage of pre-processing of voice activity and works differently depending on its level (Figure 4).
Figure 4. Finding Voice/Noise Ratio
Multiple noises occur in the course of modulation and coding a signal. Their specifics is that they are present only on voice activity sections.
To find the effect of multiple noises on communication quality, the analysis mechanism pre-processes the original signal with frequency and amplitude filters divided into frames 512 samples long. If sampling frequency is 8 kHz one frame is 64 ms long. Then, enveloping function is found by calculating signal power for each frame:
(6)
where En — signal power for n-th frame, M — frame length (512 samples), n — frame’s order number, x(m) — signal value in m-th sample of n-th frame.
Then, enveloping function is transformed to signal level’s range of values by normalization:
(7)
where MaxVal — maximal value of amplitude range. In the series, percentile 20% corresponds to voice frames and 80% to frames with pauses between words. The difference between percentiles determines statistical ratio voice/noise and threshold value to determine voice in altered signal is found as L20% – 4.0 dB.
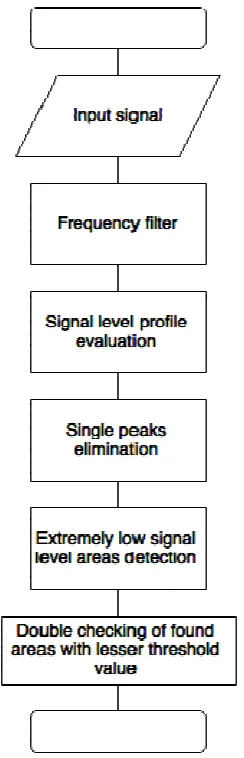
The last stage of audio analysis is the search for time base errors like sound faults and interruptions. To find them, the algorithm shown on Figure 5 is used. The frequency filter is used to eliminate from the initial signal the distortions arising in case of faults. Signal level profile is built based on frames 4 ms long, then single peaks differing from the previous and next value in a series 30 dB at least are excluded from the series of levels. Audio faults are limited on both sides, their beginnings and ends are marked by difference in levels exceeding the threshold values by modulus, between frames i and i±2. As the threshold value, the difference in levels 30 dB in the first passage and 20 dB in the second passage.
The final conclusion on quality level in analyzed audio file (stream) is made based on integrated assessments obtained at various stages of analysis.
Thus, P.563 method is oriented at, first of all, search of such signal degradation factors as voice distortions, time base errors and background noises. Meantime that method, first of all, does not account for such widespread phenomenon like echo, most often caused by the way of connecting audio devices on end user’s side. To eliminate echo from service side is as a rule impossible but the information about it should be advised to user together with recommendations on its elimination. Such automation will enable to free the first line of service support from individual echo claims.
ISSN: 1992-8645 www.jatit.org E-ISSN: 1817-3195 search and recommendations will enable to free the
[image:7.612.135.257.131.510.2]service support department.
Figure 5. Sound Failure Search Algorithm
3.2 Modified version’s modelling
To eliminate the faults of the initial method it is required to add the function of detecting acoustic echo and comparing signal levels on various ends of communication session. It should be noted that the functions added do not need to be integrated in the process of building final objective quality assessment, also described in P.563. Besides, there is some point to exclude that function from the suggested method as integrated assessment is not informative directing only some problem’s existence but not its source.
Thus, for adaptation of quality assessment method offered in recommendation P.563 to the needs of cloud telephony service, two more
modules realizing analysis processes occurring simultaneously with those described above should be added.
One of them is acoustic echo detecting module [16]. Echo detecting algorithm is an important component of echo suppressing realized by multiple modern software and hardware related to voice communication. Echo detection algorithm DTD (double talk detection) prevents the influence of subscriber’s voice A (close party) to adaptive filter which adjusted to les intensive signal from remote party reproduced by speaker and caught by close party’s microphone.
The basic requirement to that algorithm is maximally low computation ability allowing to work in real time. Accounting for that remark, cross-correlation based algorithms should be abandoned [17], [18] due to their computation inefficiency. One of the methods which may be applied in this case was offered in [19] and is based on the method using signals coherency function [20].
The point of that method is in finding the value of statistical variable ξ(n) ∈ [0, 1] for n-th frame which is the base for conclusion on acoustic echo (ξ close to 1) or on simultaneous activity of both connecting parties (ξ close to 0):
(8)
where η — threshold value chosen experimentally, δη — hysteresis preventing ringing during the moments of sound attenuation and growth from close side. The value of ξ for n-th frame is calculated as subsum weighted using cutoff values of frequency filter K:
(9)
where γ — coherency function found out of values of spectral densities S for frequency k:
(10)
ISSN: 1992-8645 www.jatit.org E-ISSN: 1817-3195 levels, voice detection tool may be used described
as a stage of preliminary processing of signal in P.563 recommendation. Such method will be inapplicable in a situation when quiet sound problem is observed on both connecting sides but such situations are rather rare. Thus, low signal level is found as follows:
(11)
where L — signal levels for streams corresponding to A and B subscribers, η — threshold value of difference chosen experimentally.
As a result of analysis the final assessment should be represented as a sequence of values or sequences like <S, ST, N>, where S — assessment in test, ST — threshold level used in test, N — test identifier. Exceeding S over ST in that case will tell about some problem or a class of problems while ST value will allow to use the above model in comparative tests.
4. CONCLUSIONS AND SUMMARY
The package of models described in this paper contains enough information to begin with the realization of software analyzer of voice communication capable to detect problems without participation of connecting parties or service engineers.
Besides the models described may be used as a part of system of a higher level simulating various aspects of VoIP-telephony cloud service. The resulting quality data may be used in that case as a feedback for optimization of simulating device.
At the next stage it is required to realize the tools described in this paper as a software product and empirically verify their application to cloud service’s conditions.
5. ACKNOWLEDGMENTS
This paper was prepared with financial support of Ministry of education and science of the Russian Federation. Original ID of applied scientific research RFMEFI57914X0009.
REFERENCES:
[1] TeleGeography. (2014, January 15). Retrieved
July 17, 2015, from
https://www.telegeography.com/products/comm supdate/articles/2014/01/15/skype-traffic-continues-to-thrive/.
[2] Rosenberg, J., Schulzrinne, H., Camarillo, A., Johnston, A., Peterson, J., Sparks, R., Handley, M., & Schooler, E. (2002, June). SIP: session initiation protocol. RFC 3261, IETF.
[3] Cloud PBX, Enhanced VoIP Communications Inc. (2015). Retrieved June 15, 2015, from http://www.easyofficephone.com/resources/clou d-pbx.
[4] The First Cloud PBX for the Channel – 3CX Phone System, 3CX. (n.d.). Retrieved June 15, 2015, from http://www.3cx.com/phone-system/cloud-pbx-server/.
[5] Call center software, 3C Logic. (n.d.). Retrieved June 15, 2015, from http://www.3clogic.com/. [6] ITU-T, ITU-T Recommendation P.800: Methods
for subjective determination of transmission quality. (1996a). Retrieved June 15, 2015, from http://www.itu.int/rec/T-REC-P.800-199608-I/en.
[7] ITU-T, ITU-T Recommendation G.107: The E-model, a computational model for use in transmission planning. (2014). Retrieved June 15, 2015, from Internet.
[8] ITU-T, ITU-T recommendation P.861: Objective quality measurement of telephone band (300-3400 Hz) speech codecs. (1996b). Retrieved June 15, 2015, from Internet.
[9] ITU-T, Perceptual evaluation of speech quality (PESQ): An objective method for end-to-end speech quality assessment of narrow-band telephone networks and speech codecs. (2001). Retrieved June 15, 2015, from Internet.
[10] ITU-T, ITU-T recommendation P.563: Single-ended method for objective speech quality assessment in narrow-band telephony applications. (2004). Retrieved June 15, 2015, from Internet.
[11] Cisco, Monitoring VoIP with Cisco Network Analysis Module. (n.d.). Retrieved June 15,
2015, from
http://www.cisco.com/c/en/us/products/collatera l/interfaces-modules/branch-routers-series-
network-analysis-module-nme-nam/white_paper_c11-520524.html.
ISSN: 1992-8645 www.jatit.org E-ISSN: 1817-3195 [13] Chen, J., Wuy, S., Larosa, Y., Yang, P., & Li,
Y. (2011). Wireless Communications and Mobile Computing Conference (IWCMC), IMS cloud computing architecture for high-quality multimedia applications.
[14] Johnston, J., & Singh, K. (2013). Taking on WebRTC in an Enterprise. Communications Magazine, IEEE, 51.4, 48-54.
[15] Saati, T. (1993). Decision making with the analytic hierarchy process.
[16] James, J., Chen, B., & Garrison, L. (2004). Implementing VoIP: a voice transmission performance progress report. Communications Magazine IEEE, 42.7, 36-41.
[17] Benesty, J., Morgan, D., & Cho, J. (2000). A New Class of Doubletalk Detectors Based on Cross-Correlation IEEE Transactions on Speech and Audio Processing.
[18] Benesty, J., & Gänsler, T. (2006). The fast cross-correlation double-talk detector. Signal Processing.
[19] Tashev, I. J. (2012). Coherence based double talk detector with soft decision. Acoustics, Speech and Signal Processing (ICASSP), 2012 IEEE International Conference on. IEEE. [20] Gänsler, T., Hansson, M., Invarsson, C.-J., &