RELIABILITY AND VALIDITY OF A QUESTIONNAIRE TO
EVALUATE DIABETIC PATIENTS' INTENTION TO ADOPT
HEALTH INFORMATION TECHNOLOGY: A PILOT STUDY
1BARROON ISMA'EEL AHMAD, 2ABD RAHMAN AHLAN
1Student, Department of Information Systems, IIUM Gombak, 50728 Kuala Lumpur, MALAYSIA
2Assoc. Prof., Department of Information Systems, IIUM Gombak, 50728 Kuala Lumpur, MALAYSIA
E-mail: [email protected], [email protected]
ABSTRACT
All the efforts put in developing questionnaire by a researcher are in vain if it measures what is not intended to measure. A questionnaire can only be useful if it produces meaningful and trustworthy data. The aim of this study was to develop and assess the validity and reliability of an instrument to measure the perception and attitude of diabetic patients toward acceptance of Health Information Technology (HIT). An extended Technology Acceptance Model (TAM) based questionnaire was distributed to a sample of 80 diabetic patients. The content validity was assessed by experts, while Exploratory Factor Analysis (EFA) was used to measure the construct validity. Cronbach's alpha was used to measure the internal consistency of the questionnaire. The response rate of the questionnaire was 93%. In the exploratory factor analysis, seven factors that correspond with the constructs were extracted using principal component analysis. The factors examined using varimax rotations explained 72.15%, 74.21%, 72.67%, 80.84%, 72.72%, 74.22% and
74.84% variance in the respective constructs. Construct validity was measured using convergent and
discriminant validity. Most of the variables load in the range of 0.60 - 0.98, which shows a good convergent validity, and the significant loading of the variables on one factor without cross-loadings is an evidence of the discriminant validity. Similarly, the average Cronbach's alpha coefficient of the seven extracted components was 0.822 indicating a good internal consistency or reliability. This study presents the result of reliability and validity of the extended TAM based instrument for assessing the perception and attitude of diabetic patients toward acceptance of HIT. The findings of this study showed the feasibility of using the questionnaire, since it has high reliability and validity.
Keywords: Health Information Technology (HIT), Technology Acceptance Model (TAM), Developing Countries, Diabetic Patients, Questionnaire
1. INTRODUCTION
Health Information Technology (HIT)
applications such as Electronic Health Record (EHR) and Clinical Decision Support System (CDSS) assists clinicians, patients, and staff with decision making tasks related to diagnosis, analysis of patient data, medication, prediction, reminder, etc. at the right time. EHR makes patient's record available any time which help to provide more effective and coordinated care, similarly CDSS improves physician's performance and patient outcomes while at the same time reduces healthcare cost as reported in previous literatures [1-6]. This presents EHR integrated with CDSS as a technology that can be used for diagnosis and management of chronic diseases such as diabetes in order to enhance the healthcare of the patients. On the other hand, diabetes is one of the chronic diseases that require urgent attention due to their spread nature and
associated complications. According to WHO [7],[8] about 346 million people are diabetic with more than three-quarter in developing countries where there are economic and healthcare challenges.
However, the instruments used to assess people's perception or attitude about a particular concept need to be evaluated first before administering. This is to make sure that the instrument is measuring what is supposed to measure. Reliability and validity are two key areas that researchers always talk about when dealing with measurement [15]. Validity "describes how well one can legitimately trust the results of a test as interpreted for a specific purpose" [16]. Validity is not considered as the property of an instrument by some researchers, but rather of its score and interpretation. It is suggested that the validity of an instrument must be assessed for each interpretation, since an instrument designed for a particular purpose may be adopted and used for another different purpose. So, the instrument may be valid for the latter case but invalid for the former. Different forms of validity exist, they are: face, content, criterion, and construct validity [16]. Reliability on the other hand is defined as "the extent to which a questionnaire, test, observation or any measurement procedure produces the same results on repeated trials" [15]. One of the most widely used estimate of reliability is internal consistency which is measured using Cronbach's alpha [17-19].
Reliability is one of the conditions for validity; this explains the relationship between the two. In other words for anything to be valid, it must be reliable and measure what is intended in addition. This shows the importance of reliability since even the validity cannot be proved without it [20]. When a questionnaire is both reliable and valid, researcher will have confidence in the results obtained using the instrument as a data collection medium. Hence, the purpose of this study is to develop an instrument to evaluate patients’ perceptions and factors that may lead to or improve the acceptance of HIT in developing countries.
2. MATERIALS AND METHODS
2.1 Context of the Study
This work is part of a study conducted to examine the perception of patients on HIT for diabetes care, and identify factors that contribute to its adoption in developing countries. This study was conducted at Aminu Kano Teaching Hospital (AKTH) and Murtala Mohammed Specialist Hospital (MMSH) both in Kano, Nigeria. Kano is a capital city of Kano state which is located at the north western part of Nigeria (latitude 11059'59.57 - 12002'39.570N of
the equator and longitudes 8033'19.69 -
8031'59.690E). Kano metropolis is the second most
populous city in Nigeria with an estimated population of 2,163,225 [21],[22].
The study was approved by Kano State Hospitals Management Board (HMB/GEN/488/VOL.I) to conduct the research at Murtala Muhammad Specialist Hospital (MMSH); likewise Aminu Kano Teaching Hospital research ethical committee
(AKTH/MAC/SUB/12A/P-3/VI/1214) gave the
approval for conducting the research at Aminu Kano Teaching Hospital (AKTH). The respondents were requested to sign on an informed consent form attached with the questionnaire which will serve as an evidence of their voluntary participation in the study. The data collection process lasted from December, 2013 to January, 2014.
2.2 Theoretical Framework
The theoretical framework is based on Davis's Technology Acceptance Model (TAM). TAM was designed for modelling and understanding user's perception on acceptance of new technology. The factors that influence the acceptance of new technology are identified so that the acceptance of the technology will be promoted, this will have an effect on the use of the new technology [23-26]. TAM was also extended from Theory of Reasoned Action (TRA), a popular theory for predicting human behaviour [27]. In the TAM, perceived usefulness and perceived ease of use were considered as the major factors that determine the user acceptance of technology. These two factors influenced the user's intention through another factor called attitude. In essence the TAM variables are perceived usefulness, perceived ease of use, attitude toward using, intention to use, actual use, and non defined variable called external variables [23]. However, additional factors were defined by researchers in order to improve the predicting value of TAM. This resulted to development of TAM2 and TAM3 from the original TAM. Several works were carried out on the application of TAM in different areas; some of these works use the model as their framework while others extend the model and use it as the framework. Similarly, TAM has been applied in healthcare to study the perception of people on adopting new technologies [28-31].
factors like the quality and cost of healthcare are mostly not included in the existing models. The variables of the widely used TAM were assumed to be factors that can affect the users’ acceptance of IT, but additional variables are needed in order to study and explain users’ behaviour towards accepting HIT for improving quality and reducing cost of diabetes care. The choice of TAM over the new extended TAM is because there is lack of studies that assess the original TAM on diabetic patients in developing countries. In addition, the two major TAM constructs (perceived usefulness and perceived ease of use) appear in almost all the extended versions.
The proposed framework is a TAM with three additional constructs perceived output quality, perceived cost-effectiveness, and trust as shown in Figure 1. Davis et al. [35] proposed output quality as the perceptions of people on how well the system performs its tasks [25],[26]. In our context output quality can be referred to as the perception of people on how well the system provides healthcare services to patients. In Davis et al. [35], the relationship between perceived output quality and perceived usefulness was shown. This relationship with additional relationship between perceived output quality and perceived cost effectiveness will be examined in our proposed model [36],[37].
Literatures related to cost analysis, and factors that determine the cost of healthcare were reviewed in order to define how cost-effectiveness will be measured. In our study we identify medication, transportation, loss of time, loss of productivity as the factors that determine the cost of healthcare [38-41]. Perceived cost-effectiveness was added to measure the perception of the users regarding the
cost-effectiveness of the system [34],[42].
Therefore, perceived cost-effectiveness can be defined as the perception of an individual on using a system and achieving the required result at a lower cost compared to its alternative. Trust has been used by many researchers especially in the area of e-commerce; it can be defined as "the extent to which one is willing to ascribe good intentions to, and have confidence in, the words and actions of other people (or systems)" [43]. Health information needs to be controlled and protected carefully because of its sensitivity. This information is confidential in most cases and has to do with the life of those involved. For any system that handles such information to be welcomed by users it has to be trustworthy. Trust was incorporated into the proposed framework as antecedents of perceived usefulness, in contrast to
other studies that hypothesized it to directly influence behavioural intention [43-45].
3. DATA COLLECTION
This study utilized the developed extended TAM questionnaire as shown in Appendix A. A self-administered questionnaire was distributed to 80 randomly selected diabetic patients from the two hospitals (AKTH and MMSH). This study is at the exploratory phase, hence the choice of small sample. Most of the questions in the instrument were adopted from the TAM related researches. The questions were rephrased in order to fit our research context and objectives. The items in the questionnaire were rated on a 5-point likert scale from totally disagree to totally agree. The respondents provided information on their gender, age, marital status, current educational status, current work status, and income. The questionnaire items were developed based on the literatures reviewed and advices from medical experts, in order to achieve content validity.
The questionnaire is divided into two sections: the demographic information and the main questions related to users perception. The second section contains 40 questions related to the seven key areas identified in the model.
4. DATA ANALYSIS
IBM Statistical Package for the Social Sciences (SPSS version 20.0) was used for the analysis of the data, in which descriptive statistics was utilized to determine the mean and standard deviation of the scores for each construct. The content validity was assessed by considering different instruments available and compares the items with the developed instrument. This type of validity was further evaluated by experts from endocrinology and technology assessment. The experts were contacted
during questionnaire development; and the
questionnaire was edited accordingly using the experts' feedback. Exploratory Factor Analysis (EFA) was used to evaluate the sampling adequacy as well as the construct validity, and validate items loading.
sample is considered adequate to carry out the factor analysis [46]. Furthermore, related to Bartlett's test of sphericity is a null hypothesis that the correlation matrix is an identity matrix. When the value is significant (p < 0.05) then the matrix is not an identity matrix, otherwise it is an identity matrix. There are various methods of extracting factors or components; these include principal axis factoring, principal component analysis, maximum likelihood, etc. In this case, the components were extracted using principal component method based on the eigenvalues. Varimax rotation method was utilized to identify variable with a factor and controls variables with high loadings [46-48].
The reliability was evaluated using Cronbach's alpha. Generally, the accepted Cronbach's alpha value start from 0.5 upwards, but for clinical related research the value is suggested to be between 0.90 and 0.95 [49],[50].
5. RESULT
Out of 80 patients who received the
questionnaire, 74 responded which makes the response rate 93%. From Table 1, it can be seen that 51.4% of the respondents were male. Also, more than half of the respondents (52.7%) were under the age of 50, the respondents were mostly married (58.1%), 35.1% of the respondents attended at least high school, and 29.7% are those that can neither read nor write. Even though 55.4% of the respondents were unemployed, about 77% earn below ₦15,000 ($ 92) monthly.
5.1 Reliability
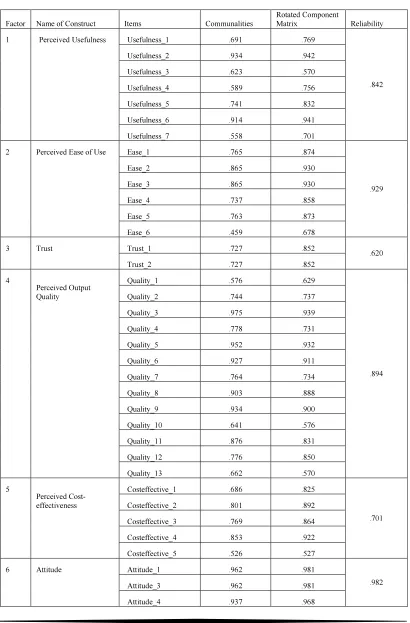
The reliability of the instrument was measured using Cronbach's alpha coefficient. The instrument was initially tested for reliability before the validity check, and found it to be a reliable instrument. The Cronbach's alpha coefficient for all the 40 items is 0.947. None of the items was deleted because from the Item-Total Statistics table if any of the items is deleted there would be no significant change in the Cronbach's alpha value. Similarly, after the factor analysis, the constructs were formed and reliability was evaluated for each construct. The Cronbach's alpha coefficient for the constructs is shown in Table 2 with a mean 0.822. The Cronbach's alpha values indicate good internal consistency.
5.2 Validity
Exploratory Factor Analysis (EFA) was
conducted to measure the construct validity.
Principal Component Analysis (PCA) and Varimax with Kaiser Normalization were used as the extraction and rotation methods respectively. The factor analysis result revealed that most of the items have correlated on at least .3 with Kaiser-Meyer-Olkin (KMO) measure of sampling adequacy of .772, .776, .500, .731, .675, .786 and .574 for perceived usefulness, perceived ease of use, trust,
perceived output quality, perceived
cost-effectiveness, attitude and intention to use respectively above the recommended value of 0.5 [46],[51],[52].
However, the Bartlett’s test of sphericity for the
respective constructs were also significant (χ2 (21) =
353.458, p < .05), (χ2 (15) = 519.854, p < .05), (χ2
(1) = 16.458, p < .05), (χ2 (78) = 950.111, p < .05),
(χ2 (10) = 123.206, p < .05), (χ2 (6) = 351.676, p <
.05) and (χ2 (3) = 204.440, p < .05). Since the
Bartlett's Sig. value is less than 0.05, the null hypothesis is rejected which means the matrix is not identity matrix. The diagonals of the anti-image correlation matrix, communalities and component matrix/rotated component matrix as can be seen from Table 2 were all above .5 indicating that most of the items shared some common variance with other items. With these indicators the analysis was further carried out with only one item deleted from attitude with low communality loading of .109. Therefore, the high loading values satisfy the condition for convergent validity which is one of the evidence of good construct validity.
The principle components analysis was used in computing the factor analysis primarily to identify and compute composite involvement scores for the factors underlying the questionnaire. The initial eigenvalues showed that the first factor explained 5.05% of the variance, the second factor 4.453% of the variance, the third factor 1.453% of the variance, fourth factor 10.509%, fifth factor 3.636%, sixth factor 2.969% and the seventh 2.245% of the total variances in of the construct. The seventh factor solutions were examined, using varimax rotations of the factor loading matrix and each explained 72.15%, 74.21%, 72.67%, 80.84%, 72.72%, 74.22% and 74.84% variance in the respective constructs.
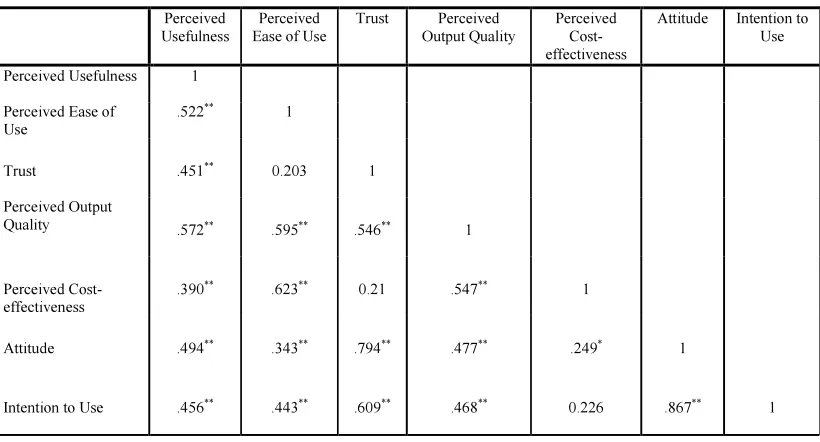
A Pearson moment correlation was computed in order to examine the relationship among the variables in the model. A positive correlation was found between perceived usefulness and perceived
ease of use (r = .522, p < .01), indicating a
for them. Similarly, positive relationships was also found between perceived usefulness and trust (r =
.451, p < .01), demonstrating the perceived
usefulness influences trust of the system. In addition, positive correlation was also found between perceived usefulness and perceived output quality (r= .572, p < .01), depicting that perceived usefulness influences output quality of the HIT system. A strong positive correlation was found between attitude and intention to use (r =.867, p < .01), indicating a significant correlation that attitude of the HIT users influences intention to use the system; then trust and attitude (r = .794, p < .01), demonstrating a significant relationship that HIT trust by the users influences their attitude towards it.
However, positively weak correlations were found between perceived usefulness and perceived
cost-effectiveness (r = .390, p < .01); perceived ease
of use and attitude (r = .343, p < .01) and perceived
cost-effectiveness and attitude (r = .249, p < .05). Remarkably, from Table 3 it can be seen that all the correlations between the variables were at 0.01 level of significance with exception of relationship of perceived cost-effectiveness and attitude which at 0.05 level of significance.
6. DISCUSSION
Currently, Health Information Technology (HIT) applications such as EHR, CPOE, CDSS, etc. are lacking in developing countries. The available ones are not properly utilized as a result of users' failure to adopt the technology. There are limited works that focused on patients' acceptance of technology, despite the fact that they have significant role to play in the success of these technologies. There are factors like cost and trust, which may influence the acceptance of technology by patients in developing countries. Therefore, in this study we developed and measure the psychometric properties of an instrument used to measure the perception and attitude of diabetic patients toward acceptance of HIT. This process of evaluating the reliability and validity of a questionnaire is very useful as it will give the researcher confidence in the quality of the data that can be used to solve a particular problem [15].
Although selecting validated instrument will save the researcher's time, but finding instruments that suit the researcher's objectives may be difficult sometimes; and also the settings where a questionnaire was validated may be different from the researcher's context [16]. In our case we want to
measure the perception of diabetic patients toward accepting HIT system in developing countries, so finding a validated instrument for this purpose is difficult as so many factors need to be considered in this context.
We developed an instrument that will suit our research aims and objectives, but as highlighted earlier the instrument needs to be evaluated in order to get valuable data. The questionnaire developed is based on TAM which on its own has been severally validated in different areas. For instance, Davis et al. [35] present the reliability and validity of the scale using two different studies. Principal components analysis with varimax rotation and Cronbach's alpha were used to assess the validity and reliability respectively. In their first study four factors were extracted that accounted for 74.1% of the variance and Cronbach's alpha coefficients were 0.78, 0.81, 0.88, and 0.91. Four factors were also extracted in the second study with 85.2% variance explained, and 0.69, 0.92, 0.95, and 0.97 as the Cronbach's alpha coefficients for the factors. Similarly, in our study as reported in Table 2 seven factors were extracted using principal component method. There are several studies that report the reliability and validity of questionnaire for studying the perception of users on using a system or technology in different settings [2],[25],[46],[53-58].
However, correlation coefficient analysis was conducted in order to find the relationship between the constructs. We found a positive relationship between perceived usefulness and perceived ease of use; perceived usefulness and trust; perceived usefulness and perceived output quality. Similarly, strong positive correlation was found between attitude and intention to use; trust and attitude. Conversely, a positively weak correlations was found between perceived usefulness and perceived cost-effectiveness; perceived ease of use and attitude; perceived cost-effectiveness and attitude. The result of the correlation indicated that there is a significant relationship between the constructs.
Finally, in this study Cronbach's alpha
coefficients of the constructs were found to be high. Likewise; the convergent validity was assessed using the items loading which in this case is high, this result implies good construct validity. Hence, the questionnaire can be used to assess the perception of diabetic patients on adoption of HIT system in developing countries.
We presented the psychometric properties of a new extended TAM based questionnaire for assessing diabetic patients' perception of HIT system. The instrument was developed after
reviewing relevant literatures and experts'
consultation. The findings demonstrate that the instrument has adequate psychometric properties and it is fit to be used for the main study. Further validity test is required using large sample size. Also the relationship between the variables should be further analyzed using confirmatory factor analysis.
This study has some limitations that may affect the significance, generalization and validity of the result. These include the population, study context and small sample size used in the study.
8. ACKNOWLEDGEMENT
Our special thanks to the staff and diabetic patients from Murtala Mohd Specialist Hospital and Aminu Kano Teaching Hospital, Dr. Buhari Muhd Abubakar, Dr. Jameel Isma'il Ahmad, Dr. Ibrahim D. Gezawa, Dr. Murtala Jibrin, Dr. Hamza Muhammad, Auwal Isma'il Ahmad, and Shehu Nasiru for their participation and contribution toward the success of this study.
REFRENCES:
[1] M. P. Johnson, K. Zheng, and R. Padman,
“Modeling the longitudinality of user
acceptance of technology with an evidence-adaptive clinical decision support system,” Decision Support Systems, vol. 57, pp. 444-453, 2014.
[2] S. Dünnebeil, A. Sunyaev, I. Blohm, J. M. Leimeister, and H. Krcmar, “Determinants of physicians’ technology acceptance for e-health
in ambulatory care,” International Journal of
Medical Informatics, vol. 81, no. 11, pp. 746-760, 2012.
[3] K. Zheng, K. Fear, B. W. Chaffee, C. R. Zimmerman, E. M. Karls, J. D. Gatwood, J. G.
Stevenson, and M. D. Pearlman,
“Development and validation of a survey instrument for assessing prescribers' perception of computerized drug–drug interaction alerts,” Journal of the American Medical Informatics Association, vol. 18, no. Suppl 1, pp. i51-i61, 2011.
[4] P. Y. Chau, and P. J. Hu, “Examining a model of information technology acceptance by
individual professionals: an exploratory
study,” Journal of Management Information
Systems, vol. 18, no. 4, pp. 191-230, 2002. [5] M. P. Gagnon, E. Orruno, J. Asua, A. B.
Abdeljelil, and J. Emparanza, “Using a modified technology acceptance model to evaluate healthcare professionals' adoption of a
new telemonitoring system,” Telemed J E
Health, vol. 18, no. 1, pp. 54-9, Jan-Feb, 2012. [6] T. Kortteisto, J. Komulainen, M. Mäkelä, I.
Kunnamo, and M. Kaila, “Clinical decision support must be useful, functional is not enough: a qualitative study of computer-based clinical decision support in primary care,” BMC health services research, vol. 12, no. 1, pp. 349, 2012.
[7] X. Debussche, M. Balcou-Debussche, S. Besancon, and S. Traore, “Challenges to
diabetes self-management in developing
countries,” Diabetes Voice, vol. 54, no.
Special, pp. 3, 2009.
[8] A. Hassol, J. M. Walker, D. Kidder, K. Rokita, D. Young, S. Pierdon, D. Deitz, S. Kuck, and E. Ortiz, “Patient experiences and attitudes about access to a patient electronic health care
record and linked web messaging,” J Am Med
Inform Assoc, vol. 11, no. 6, pp. 505-13, Nov-Dec, 2004.
[9] E. Kilsdonk, L. Peute, S. Knijnenburg, and M.
Jaspers, “Factors Known to Influence
Acceptance of Clinical Decision Support
Systems,” Studies in health technology and
informatics, vol. 169, pp. 150-154, 2010.
[10] K. Zheng, “Clinical Decision Support
Systems,” Management, Types and Standards,
vol. 36, pp. 501-509, 2012.
[11] M. El Din, “Physicians’ use of and attitudes toward electronic medical record system implemented at a teaching hospital in saudi
arabia,” Journal of the Egyptian Public Health
Association, vol. 82, no. 5/6, pp. 347-346, 2007.
[12] C. K. Or, and B.-T. Karsh, “A systematic review of patient acceptance of consumer
health information technology,” Journal of the
American Medical Informatics Association, vol. 16, no. 4, pp. 550-560, 2009.
[13] S. P. Sood, S. N. Nwabueze, V. W. A. Mbarika, N. Prakash, S. Chatterjee, P. Ray, and S. Mishra, "Electronic medical records: a review comparing the challenges in developed and developing countries." pp. 248-248. [14] M. Kortemann, "Cultural Background and
Projects that Bridge the Digital Divide." pp. 151-158.
[15] M. Miller, “RES 600: Graduate Research
Methods: Reliability and Validity,” Western
International University http://michaeljmillerphd.
com/res500_lecturenotes/Reliability_and_Vali dity. pdf, 2012.
[16] D. A. Cook, and T. J. Beckman, “Current concepts in validity and reliability for
psychometric instruments: theory and
application,” The American journal of
medicine, vol. 119, no. 2, pp. 166. e7-166. e16, 2006.
[17] N. L. Ritter, “Understanding a Widely Misunderstood Statistic: Cronbach's" Alpha",” Online Submission, 2010.
[18] M. Tavakol, and R. Dennick, “Making sense of
Cronbach's alpha,” International journal of
medical education, vol. 2, pp. 53-55, 2011.
[19] I. McDowell, Measuring health: a guide to
rating scales and questionnaires: Oxford University Press, 2006.
[20] J. Nunnally, and I. Bernstein, “Psychometric
Theory (3) McGraw-Hill,” New York, 1994.
[21] B. Nabegu, "Municipal Solid Waste
Characteristics in three Residential Zones of
Kano Metropolis: Implications for
Management."
[22] O. J. Okunola, A. Uzairu, C. Gimba, and G. Ndukwe, “Assessment of Gaseous Pollutants along High Traffic Roads in Kano, Nigeria,” International Journal of Environment and Sustainability (IJES), vol. 1, no. 1, 2012. [23] F. D. Davis, “Perceived usefulness, perceived
ease of use, and user acceptance of information
technology,” MIS quarterly, pp. 319-340,
1989.
[24] F. D. Davis, R. P. Bagozzi, and P. R. Warshaw, “User acceptance of computer technology: a comparison of two theoretical
models,” Management science, vol. 35, no. 8,
pp. 982-1003, 1989.
[25] V. Venkatesh, and F. D. Davis, “A theoretical extension of the technology acceptance model:
four longitudinal field studies,” Management
science, vol. 46, no. 2, pp. 186-204, 2000. [26] R. J. Holden, and B. T. Karsh, “The
technology acceptance model: its past and its
future in health care,” J Biomed Inform, vol.
43, no. 1, pp. 159-72, Feb, 2010.
[27] M. Fishbein, and I. Ajzen, Belief, attitude,
intention and behavior: An introduction to theory and research, 1975.
[28] P. J. Hu, P. Y. Chau, O. R. L. Sheng, and K. Y. Tam, “Examining the technology acceptance
model using physician acceptance of
telemedicine technology,” Journal of
management information systems, vol. 16, no. 2, pp. 91-112, 1999.
[29] R. Hess, C. L. Bryce, S. Paone, G. Fischer, K. M. McTigue, E. Olshansky, S. Zickmund, K. Fitzgerald, and L. Siminerio, “Exploring challenges and potentials of personal health
records in diabetes self-management:
implementation and initial assessment,”
Telemedicine and e-Health, vol. 13, no. 5, pp. 509-518, 2007.
[30] W. J. Winkelman, K. J. Leonard, and P. G. Rossos, “Patient-perceived usefulness of online electronic medical records: employing grounded theory in the development of information and communication technologies for use by patients living with chronic illness,” J Am Med Inform Assoc, vol. 12, no. 3, pp. 306-14, May-Jun, 2005.
[31] A. A. Morton, “Examining Acceptance of an Integrated Personal Health Record (PHR),” University of Maryland, Baltimore, 2011. [32] A. R. Ahlan, and B. I. Ahmad, “User
Acceptance of Health Information Technology (HIT) in Developing Countries: A Conceptual
Model,” Procedia Technology, vol. 16, pp.
1287-1296, 2014.
[33] A. M. Wong, W.-H. Chang, P.-C. Ke, C.-K. Huang, T.-H. Tsai, H.-T. Chang, W.-Y. Shieh, H.-L. Chan, C.-K. Chen, and Y.-C. Pei, “Technology acceptance for an intelligent comprehensive interactive care (ICIC) system for care of the elderly: A survey-questionnaire
study,” PloS one, vol. 7, no. 8, pp. e40591,
2012.
[34] J. Asua, E. Orruño, E. Reviriego, and M. P. Gagnon, “Healthcare professional acceptance of telemonitoring for chronic care patients in
primary care,” BMC medical informatics and
decision making, vol. 12, no. 1, pp. 139, 2012. [35] F. D. Davis, R. P. Bagozzi, and P. R.
Warshaw, “Extrinsic and intrinsic motivation
to use computers in the workplace,” Journal of
applied social psychology, vol. 22, no. 14, pp. 1111-1132, 1992.
applications: the user acceptance perspective," Advanced Computational Intelligence Paradigms in Healthcare-2, pp. 49-78: Springer, 2007.
[37] J. Kim, and H. A. Park, “Development of a health information technology acceptance model using consumers' health behavior intention,” J Med Internet Res, vol. 14, no. 5, pp. e133, 2012.
[38] R. M. Coffey, T. L. Matthews, and K.
McDermott, Diabetes care quality
improvement: a resource guide for state action: Agency for Healthcare Research and Quality, 2004.
[39] P. Cosgrove, M. Engelgau, and I. Islam, “Cost-effective approaches to diabetes care and
prevention,” Diabetes voice, vol. 47, no. 4, pp.
13-17, 2002.
[40] C. S. Goodman, “Introduction to health
technology assessment,” The Lewin Group.
virginia, USA, 2004.
[41] L. A. Khowaja, A. K. Khuwaja, and P. Cosgrove, “Cost of diabetes care in out-patient
clinics of Karachi, Pakistan,” BMC Health
Services Research, vol. 7, no. 1, pp. 189, 2007. [42] R. G. Boone, “Factors impacting innovation
acceptance in a product development
organization: Utilizing technology acceptance model,” CAPELLA UNIVERSITY, 2011. [43] J.-H. Wu, W.-S. Shen, L.-M. Lin, R. A.
Greenes, and D. W. Bates, “Testing the technology acceptance model for evaluating healthcare professionals' intention to use an
adverse event reporting system,” International
Journal for Quality in Health Care, vol. 20, no. 2, pp. 123-129, 2008.
[44] D. Gefen, E. Karahanna, and D. W. Straub, “Trust and TAM in online shopping: an
integrated model,” MIS quarterly, vol. 27, no.
1, pp. 51-90, 2003.
[45] S. Terrizzi, S. Sherer, C. Meyerhoefer, M. Scheinberg, and D. Levick, “Extending the technology acceptance model in healthcare: Identifying the role of trust and shared information,” 2012.
[46] B. Williams, T. Brown, and A. Onsman, “Exploratory factor analysis: A five-step guide
for novices,” Australasian Journal of
Paramedicine, vol. 8, no. 3, pp. 1, 2012. [47] D. Hooper, “Exploratory factor analysis,”
2012.
[48] J. Walker, and S. Maddan, Statistics in
criminology and criminal justice: Analysis and interpretation: Jones & Bartlett Learning, 2008.
[49] D. L. Streiner, “Starting at the beginning: an introduction to coefficient alpha and internal
consistency,” Journal of personality
assessment, vol. 80, no. 1, pp. 99-103, 2003. [50] P. Panayides, “Coefficient Alpha: Interpret
With Caution,” Europe’s Journal of
Psychology, vol. 9, no. 4, pp. 687–696, 2013. [51] H. F. Kaiser, “An index of factorial
simplicity,” Psychometrika, vol. 39, no. 1, pp.
31-36, 1974.
[52] J. F. Hair, Multivariate Data Analysis: A
Global Perspective: Pearson Education, 2010. [53] R. K. Henson, and J. K. Roberts, “Use of
exploratory factor analysis in published research common errors and some comment on
improved practice,” Educational and
Psychological measurement, vol. 66, no. 3, pp. 393-416, 2006.
[54] A. Khan, I. M. Shah, F. Khan, and S. Suhail, “Reliability and Validity Assessment of 12 Items General Health Questionnaire (GHQ: 12) among Pakistani University Teachers,” World Applied Sciences Journal, vol. 24, no. 5, pp. 603-608, 2013.
[55] E. K. Kintner, and A. Sikorskii, “Reliability and construct validity of the Participation in Life Activities Scale for children and adolescents with asthma: an instrument
evaluation study,” Health Qual Life Outcomes,
vol. 6, pp. 43, 2008.
[56] M. J. Rho, I. Choi, and J. Lee, “Predictive factors of telemedicine service acceptance and
behavioral intention of physicians,”
International Journal of Medical Informatics, 2014.
[57] C.-H. Tsai, “Integrating Social Capital Theory, Social Cognitive Theory, and the Technology Acceptance Model to Explore a Behavioral
Model of Telehealth Systems,” International
journal of environmental research and public health, vol. 11, no. 5, pp. 4905-4925, 2014. [58] P.-Y. Yen, D. Wantland, and S. Bakken,
Figure 1: Proposed Theoretical Framework
Table 1: Demographic Characteristics of the Respondents
Variable Frequency Percentage
Gender
Male 38 51.4
Female 36 48.6
Age
18 - 29 9 12.2
30 - 49 30 40.5
50 - 69 29 39.2
> 70 6 8.1
Marital Status
Single 8 10.8
Married 43 58.1
Separated 14 18.9
Divorced 1 1.4
Widowed 6 8.1
Missing data 2 2.7
Current Education Status
Cannot read and write 22 29.7
Can read and write 11 14.9
Attended primary school 15 20.3
Attended secondary school 18 24.3
Attended college/university 8 10.8
Current Work Status
Employed 19 25.7
Unemployed 41 55.4
Retired 14 18.9
Income
Less than 2000 39 52.7
2000 - 4999 12 16.2
5000 - 9999 5 6.8
10000 - 14999 1 1.4
15000 - 19999 4 5.4
20000 or more 11 14.9
[image:9.595.134.467.374.727.2]Table 2. Constructs with their Reliability and Validity Indicators
Factor Name of Construct Items Communalities
Rotated Component
Matrix Reliability
1 Perceived Usefulness Usefulness_1 .691 .769
.842
Usefulness_2 .934 .942
Usefulness_3 .623 .570
Usefulness_4 .589 .756
Usefulness_5 .741 .832
Usefulness_6 .914 .941
Usefulness_7 .558 .701
2 Perceived Ease of Use Ease_1 .765 .874
.929
Ease_2 .865 .930
Ease_3 .865 .930
Ease_4 .737 .858
Ease_5 .763 .873
Ease_6 .459 .678
3 Trust Trust_1 .727 .852
.620
Trust_2 .727 .852
4
Perceived Output Quality
Quality_1 .576 .629
.894
Quality_2 .744 .737
Quality_3 .975 .939
Quality_4 .778 .731
Quality_5 .952 .932
Quality_6 .927 .911
Quality_7 .764 .734
Quality_8 .903 .888
Quality_9 .934 .900
Quality_10 .641 .576
Quality_11 .876 .831
Quality_12 .776 .850
Quality_13 .662 .570
5
Perceived Cost-effectiveness
Costeffective_1 .686 .825
.701
Costeffective_2 .801 .892
Costeffective_3 .769 .864
Costeffective_4 .853 .922
Costeffective_5 .526 .527
6 Attitude Attitude_1 .962 .981
.982
Attitude_3 .962 .981
7 Intention to Use Intention_1 .908 .953
.789
Intention_2 .413 .643
[image:11.595.105.515.221.442.2]Intention_3 .924 .961
Table 3. Correlation between the Constructs
Perceived
Usefulness
Perceived Ease of Use
Trust Perceived
Output Quality
Perceived Cost-effectiveness
Attitude Intention to
Use
Perceived Usefulness 1
Perceived Ease of Use
.522** 1
Trust .451** 0.203 1
Perceived Output
Quality .572** .595** .546** 1
Perceived Cost-effectiveness
.390** .623** 0.21 .547** 1
Attitude .494** .343** .794** .477** .249* 1
Intention to Use .456** .443** .609** .468** 0.226 .867** 1
APPENDIX A: SURVEY QUESTIONS
Perceived Usefulness
• Using the HIT system will make it easier to manage my health
• HIT system will make my health information more accessible
• Using the HIT system will give me greater control over my disease
• Using the HIT system will allow me to quickly accomplish tasks related to managing my disease
• I believe it will be helpful to have an electronic copy of my medical record
• HIT system will make obtaining health information more convenient
• Overall, I will find the HIT system useful in managing my disease
Perceived Ease of Use
• Learning to use the HIT system will be easy for me
• My interaction with the HIT system will be simple
• I will find my interaction with the HIT system clear and understandable
• I can easily become skilful at using the HIT system
• It will be easy to remember how to use the HIT system
• Overall, i will find the HIT system easy to use
Trust
• In my opinion, the HIT system is trustworthy
• I can rely on the HIT system
Perceived Output Quality
• I expect the quality of the information that will be obtained from the HIT system to be high
• The HIT system will perform well
• The HIT system will offer good information
• The HIT system will offer accurate information
• The HIT system will offer up-to-date information
• The HIT system will offer relevant information
• Using the HIT system can improve the level of my adherence to the guidelines
• The use of HIT system will ensure promptness in taking drugs and other diabetes related activities
• The HIT system can help me follow doctor’s advice properly
• Using the HIT system can result to improvement of my glycaemic control
• Using the HIT system will enhance the monitoring of my disease
• HIT system can reduce my rate of hospitalization
• Overall I expect the HIT system to improve the quality of my care
Perceived Cost-effectiveness
• Using the HIT system will save me a lot of time. (travelling, consultation, waiting, etc.)
• Using the HIT system will reduce my medication, transportation, and consultation cost
• HIT system will increase my productivity (work)
• Using the HIT system will reduce the rate of taking leave from work
• Overall, I anticipate the use of HIT system to reduce the cost related to my care
Attitude
• I believe it is a good idea to use the HIT system to manage my disease
• I believe the HIT system will support the physician in providing me with better care
• I need the HIT system to provide me with effective care
• Overall, my attitude about the HIT system usage will be positive
Intention
• I will strongly recommend others to use the HIT system
• I intend to use the HIT system when it becomes available