184
MODEL OF WIRELESS TRANSMISSION OF BIOMEDICAL
PARAMETERS FOR THE MONITORING OF PATIENTS IN
INTENSIVE CARE UNITS
1K. ROJAS, 2P. ROMERO, 3C. ROMERO
1Universidad de la Costa, Facultad de Ingeniería, Programa de Ingeniería en Sistemas, Barranquilla.
Colombia.
2Universidad de la Costa, Facultad de Ingeniería, Programa de Ingeniería Eléctrica, Barranquilla.
Colombia.
3Universidad de la Costa, Facultad de Ingeniería, Programa de Ingeniería Industrial, Barranquilla.
Colombia.
E-maiL1[email protected] , 2[email protected] , 3[email protected]
ABSTRACT
The present study aimed to design a model for monitoring and transmission of biomedical parameters based on wireless technology. This responds to a latent need in terms of improving the efficiency of the operation of the intensive care units (ICU), so progress in wireless transmissions, provides an emerging alternative to the medical-care personnel can monitor the condition of a patient in that unit. The methodology corresponds to a Feasible Project, developed through five stages: a) analysis of the situation under study, b) characterization of biomedical signals, c) establishing requirements and transmission monitoring system, d) design model and, e) model evaluation. As a result the model monitoring and transmission of biomedical parameters based on wireless technology is presented. In addition, the study failed to prove its feasibility by simulation in MatLab Software, establishing in a virtual environment system transmitter performance, through the calculated parameters.
System Keywords:System; Monitoring; Wireless; Biomedical Signals.
1. INTRODUCTION
With the passing of the years, technology has experienced a progressive and unstoppable progress. Daily designs and develop new products and services aimed at the improvement of the quality of life of the human being among those who are engineering solutions to the health care service.
Telemedicine is the example worthy of the issues raised above, since it is simply the practice of medicine at distance through the use of communications and information technologies. Has become a need to improve the process of monitoring vital signs of patients in intensive care units; fast, effective and efficient way in order to provide a reliable response to any event that occurs in the ICU, based on these needs arises as a solution the implementation of a system for monitoring wireless.
In this sense, if set as purpose the design of a system of monitoring medical parameters based on wireless technology that allows to keep a remote monitoring constant of these medical parameters and vital signs of patients said, allowing early diagnosis by the medical professionals.
2. METHODOLOGY
A. - Analysis of the Situation under Study.
This phase consisted in studying different biomedical measurement systems used in the different centers of care, specifically in the area of (intensive care) for the monitoring of the vital signs of patients in State of gravity, achieving in this way verify the functioning and structure for such data transmission system.
185 have both analog and digital equipment able to collect, send, and in some cases storing data that correspond to the vital signs of patients undergoing observation. Although some assistance centers remain completely analog measuring equipment such as electrocardiographs that do not offer any kind of alternative to data transmission.
B. - Characteristics of the Biomedical Signals.
Teams of monitoring vital signs in this room, have outputs of data, depending on the model of the equipment and the same update level. Typically used ports serial, USB and network ports. Being one of the fundamental technical specifications for the correct design of the network of remote monitoring of critically ill patients vital signs, since these ports make it possible to connect those computers to a wireless data network, through which health specialists can access and monitor the patient's vital signs in real time. These teams also possess the characteristics of being self- sustaining, i.e., that at the time of a situation of contingency as in the case of a failure of the electrical service in the hospital, the team of monitoring has its own alternative source of energy to continue monitoring the patient.
It was determined that generally signals more essential in intensive care units are blood pressure (systolic, diastolic and mean), heart rate, body temperature, respiratory rate, spo2. In addition, technical equipment operation manuals, used as it is the case of the electrocardiogram, in order to learn more regarding the characteristics and operating parameters which possess such apparatus and the ability to send biomedical signals through a local network.
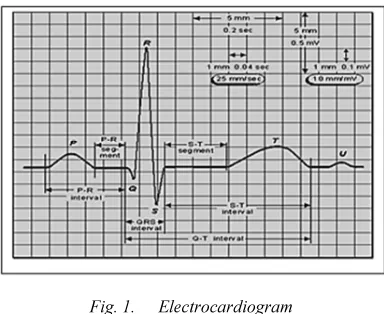
In this sense [1], are handled theoretically current values and vital signs voltage are expressed in ranges the micro amps (µA) and millivolts (mV), the amplitude peak of a signal is in the range of 1mV. With respect to the ECG frequency range, this author indicates that range is covered from 0.05-100 Hz, divide at the same time this bandwidth in three ranges, according to the different applications [2].
For applications of monitoring of patients in intensive care, the bandwidth is limited to 0.5 - 50 Hz, in this environment the arrhythmias are
enough interest, mainly by subtle in the waveform changes. This signal consists of several waves that occur in a normal heartbeat, which consists of a P wave, a QRS complex, a T wave and a wave U, which is normally invisible.
These are electrical events that should not be by any reason confused with the corresponding mechanical events, i.e. the contraction and relaxation of the Chambers of the heart, thus with mechanical systole or ventricular contraction begins just after the beginning of the QRS complex and culminates just before end of the T wave. Diastole, which is relaxation and filling ventricular, begins after that culminates the systole to correspond with the contraction of the Atria, just after the P wave.
The P wave is produced by the electrical potential generated when the Atria is depolarized before the start of the atrial contraction. The QRS complex corresponds to the electric current that causes contraction of the right and left ventricles and it usually lasts from 60 to 100 milliseconds, it consists of Q wave representing the small horizontal current action potential traveling through the ventricular septum, and the waves R and S that indicate contraction of the myocardium.
[image:2.595.315.507.555.712.2]The T wave represents the re polarization of the ventricles, it should be noted that the majorities of the derivations of the T wave is positive, the T waves that are negative are taken as anomalies in the patient. Wave U is a small positive wave that is marked at times then the T-wave, especially in adolescents and young adults, but if meaning is not properly cleared up.
Fig. 1. Electrocardiogram
186 transmitted over a local network, so it would be necessary to do a treatment of this signal, in a manner such that the same be amplified withholding its original pattern. However, thanks to recent advances in technology, monitors or measuring equipment of vital signs present in the majority of centers, have the advantage to make that adjustment to the signal, amplifying, filtering and carrying out the conversion of the analog biomedical signals in binary data that are easily handled and understood by the current network communication protocols.
C. - Establishment of the requirements of the monitoring and transmission system.
In the first instance, treatment of wave process began with the selection of filters [4] [5], based on proposed by equation (1), where it is suggested that the analysis this type of waves to be preceded by a purification and amplification of the wave. The signal is filtered by a bandpass filter second order Butterworth, which only passed the frequencies that are in the range 0.01-1.0 KHz in order to vital waves within the
operating range of the filter.
(1)
Where:
ω: angular frequency (rad/seg). ωc: System cut-off frequency N: N th order
For the case in question was calculate the maximum in the in equation (2), the value of magnitude product of the filtering i.e. when ω = ωc, around 1 KHz.
(2)
Then, carry out the scanning process, selected a sampler amplitude of pulses(PAM), [6] single
peak-peak amplitude (1 V) and to which it took time values of sampled experimental equivalent to 0.0006 seconds, with a duration of pulses of 0.0003 seconds, based on the theorem of Nyquist. Values in the equations (3) and (4).
(3)
(4)
Where:
A: Wave amplitude. P: Wave form (pulse) T: Duration of the pulse.
k: Number of times that the sampler where taken.
T: Sampling time.
Continuing with successive approximations [7] A/D conversion, applies a coding M-aria, equation (5). This allows approximating the sample to one of the levels of a designated scale. The range of quantification will be 1/256, since this format originally characters ASCII type [8], which would facilitate the process of transmission and interpretation of the data generated by the model.
(5)
Where:
M: Number of symbol. n: Number of bits by symbol.
187
TABLE 1. Coding Sequence
Nivel VOLTAJE (mV) SIMBOLO
(ASCII)
0 0 00000000
1 4 00000001
2 8 00000010
3 12 00000011
4 16 00000100
5 20 00000101
A modulator is then selected M-PSK, [6] whose "M" parameter will be 256, this modulator is characterized because the phase of the carrier signal represents each symbol information of the modulating signal, with an angular value modulator chooses among a discrete set of "M" values, while the amplitude and frequency of the wave remain constant and are values that are determined by the standard that governs the M-PSK modulation for the purposes of the model A = 1 Vp. Then M is the number representing the number of conditions or possible combinations for the binary group that is considered, i.e., the number of points in the signal's constellation, which is defined by the equation (6).
(6)
Where:
A: amplitude of the carrier signal.
ωc: angular frequency of the carrier signal. ϴi(t): fase N th of the carrier.
As shown in equation (7), the value of the phase ϴi (t), represents the ASCII symbol that is generated at the time of transmission.
θit ଶ ; M 1,2,3, … . ,256 (7)
Where: M 256 ; θit 0.0007 rad
The transmission channel will be simulated in MatLab, through the channel of noise additive white Gaussian, which will have a relationship signal-noise of 80dB that although it seems to be a little high it is suggested by the MatLab for systems with almost ideal characteristics and a power input of 1watts, this channels commonly used to represent the environment noise and any kind of interference that may occur in the same.
D.- System Design
At this stage we proceeded to make a schematic diagram showing the interconnections, components and equipment used for the design of the system of remote monitoring. On the other is present in a diagram the specifications needed to encode and transmit wirelessly the signals produced by the teams of monitoring of the intensive care unit.
Likewise, this diagram provides the necessary support for the analysis of faults that may arise, as well as for the design optimization. This diagram is of the most importance since it allows the tracking of different levels and stages in the architecture [9] where the signals produced by the measuring equipment will flow. Therefore, signal processing would be composed in the following manner:
Initially, there will be a sensor for measurement of signals, which captured the different type of biomedical signals which are collected from patients [10]. Inside the sensor are also manages filtering of waves in order to filter out the interference that produce other signs of the same patient, as for example brain impulses [11], saturation, among others.
Then the sensor output went through a process of sampling [12], this form the input signal becomes a square signal, this process having the multiplier is accomplished through a modulation of the amplitude of the pulses (PAM), [6] it has the feature of changing the amplitude of a signal, fixed frequency, function of the symbol to transmit.
Then, already sampled and quantified signal entering an analog digital converter, within this you will need to encode the signal and then have that happen to be converted integer bits, and the output will have already digitized signal.
Subsequently, the digitized signal entering a modulator, which will wrap to the signal which came in bits to through a carrier so that this digitalized signal crossed the channel without losing any data, the output of the modulator will be an analog signal that will continue towards the transmitting antenna [8].
188 demodulator, it will have the purpose of eliminate the carrier that enveloped the signal, so it can follow the process of receiving.
Similarly, of the decoder output which will be a digital signal, you will need that to be led through a digital-analog converter [9], to retrieve biomedical signal, however, the output of this converter will be accompanied by undesired high frequencies biomedical signal. Moreover, these unwanted frequencies will have to be eliminated through a filter lowpass, which features prevent the passage of only and high frequencies giving way to frequency low within a range.
Finally, filter lowpass mentioned above, output the original biomedical signal which was sent, will give the signal from reaching a receiver.
This can be examined by interested parties in the monitoring of the patient as medical doctors, nurses or specialists in the area.
A D
Rx
SENSOR DE SEÑALES
CONVERTIDOR ANALOGICO
DIGITAL
CONVERTIDOR DIGITAL-ANALOGICO
MODULADOR
DEMODULADOR
FILTRO
PUNTOS DE ACCESO INALAMBRICOS
SEÑAL TRANSMITIDA
RECEPTOR
Multiplicador
A D
TX
RX
v
Fig. 2System Architecture
E.- Evaluation of the Design
Finally evaluates the proposal, through the MatLab which is the suitable software, since it allows simulating the model and checking the operation of the system.
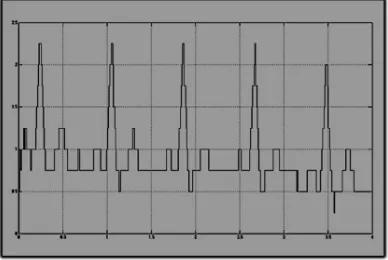
1) Transmission: In the first instance was to simulate a biomedical signal, with the help of an electrocardiogram was achieved to represent the signal the heart rate of a patient. This signal was created taking 136 samples with a time of 0.006 seconds manually.
[image:5.595.316.512.290.423.2](2) Next, was coupled with a signal to generate the interference caused by other signals of the body which was emulated with the MatLab Simulink signal generator.
[image:5.595.89.286.390.529.2]Fig. 3 Heart rate signal seen from MatLab
Fig. 4 Heart Rate Signal to Interference.
[image:5.595.317.511.556.686.2]Immediately, was to eliminate this interference with the heart rate signal, for sampling in its original representation. The interference was eliminated by half two filters, a bandpass filter of second order with a range from 0.01 to 150 Hz frequency, and another from grade eight-type rechazabanda which operates in the frequency range between 55 to 65 Hz.
Fig. 5 Filtered and sampled signal (PAM).
189 similar to the original waveform of signal the heart rate, but of quadratic form, to then be encoded for the binary output for your modulation.
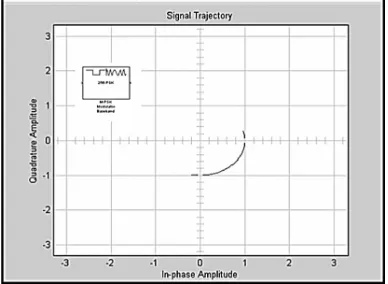
[image:6.595.306.517.73.256.2]After sampling and coding, the marked signal is subjected to a process of phase modulation (M-PSK) of 8 bits, which throws a constellation of 256 possible symbols of data with constant amplitude and phase variations. These symbols are subjected to an analog transmission process, which will directly respond to the phase of the symbol is generated.
Fig. 6 Constellation diagram of the transmission process.
After the process of modulation wave is subjected to a wireless medium, simulated conditions of noise and energy of bit (Eb/No) [4] [6], according to the present to a hospital setting, this was the tool of the MatLab AWGN Channel, which represents the signal transmission channel.
[image:6.595.87.281.282.424.2](3) Reception: The reception system is governed by a process of coherent detection and recovery of carrier [13] which starts with the filtering of received wave, in order to guarantee the working of the system frequency band. Subsequently becomes a product detection and recovery of carrier to separate en the message of the carrier signal, this is achieved through an envelope element detector is a filter lowpass of order eight with a frequency range from 4 Hz.
Fig. 7 Received Signal
After separating the interest of the carrier signal is processed a carry out the initial process of sampling, retention and coding in order to reconstruct the original signal (heart sign). Below is the signal received in a definitive way.
3. CONCLUSIONS
The approaches described in this research allowed demonstrating, it is theoretically possible to create a model that matches the methodology proposed by [14] in monitoring and transmission of parameters or biomedical signals, although measuring equipment in the hospitals of the country is not designed to this end.
Biomedical signals in study were characterized by work on low ranges of frequency and amplitude. What I represent an obvious advantage in establishing model, for the reason that these ranges of operation easy sampling, retention and subsequent codification of waves generated by the human body.
He is accomplished to verify the model through the proposal of a simple architecture from the point of view of the number of elements that make it up, but complex by the method of modulation and transmission of data, which I involved the approach of a M-PSK modulation scheme, by its immunity to interference and noise levels in the transmission channel.
190 services [15] and likewise to the prevention of risks in the rooms intensives care.
REFERENS
[1] BAILEY, J. Recommendations for standardization and specifications in automated electrocardiography American Heart Association (USA), 1990, vol 81, 730-739.
[2] J. Bailey, “Recommendations for standardization and specifications in automated electrocardiography: Bandwith and digital signal processing”. American Heart Association (USA), 1990, vol 81, 730-739.
[3] Electrocardiografia.es. Ondas Componentes del ECG. España, 2009. http://www.electrocardiografia.es/ondas_ec g.html.
[4] V. Alonso, “ECG beat detection using filter banks”. IEEE Trans. Biomed. 1992, vol. 39, pp. 317-329.
[5] Rojas K, Romero C, Romero P. Modelo de procesamiento digital de señales cardiacas desarrollado en MatLab. Telematique 20131221-36. Disponible en: http://www.redalyc.org/articulo.oa?id=784 28243004. Fecha de consulta: 23 de octubre de 2014.
[6] PROAKIS, J. Tratamiento Digital de Señales. 3ra ed. México: Prentice Hall, 2007. ISBN 978-84-8322-347-2.
[7] TOCCI, R “Sistemas Digitales: Principios y Aplicaciones”. 8va ed. México: Person Education, 1993.ISBN 970-26-0297-1. [8] TOMASI, W. Sistemas de Comunicación
Electrónica. 4ta ed. México: Prentice Hall, 2003. ISBN 970-26-0316-1.
[9] FOROUZAN, B. Transmisión de Datos y Redes de Comunicaciones. 1ra ed. España: Mc Graw Hill, 2002. ISBN 84-481-3390-0.
[10] SÁNCHEZ, D. Transmisión Inalámbrica de Señales Biomédicas para el Diagnostico de Trastornos y Enfermedades del Sueño. Actas del I Congreso Español de Informática. Granada, 2005. ISBN 84-9732-452-8.
[11] SANCHEZ MORILLO, D. Procesado y transmisión de señales biomédicas para el diagnóstico de trastornos y enfermedades del sueño. Directores: Juan Rojas, Wilhelm Stork. Cádiz: Universidad de Cádiz, Departamento de Ingeniería de Sistemas y
Automática, Tecnología y Electrónica, 2008.
[12] CARLSOM, B “Communication Systems”. 4ta ed. USA: Mc. Graw Hill, 2007. ISBN 0-070112175-1.
[13] COUCH, L. “Sistemas de comunicaciones digitales y analógicas”. 7ma ed. México: Prentice Hall, 2008. ISBN 978-970-26-1216-2.
[14] Romero D. PA. Fundamentos para la aplicación de sistemas ópticos inalámbricos (FSO) como solución de telecomunicaciones en áreas metropolitanas. Telematique
20043112-115. Disponible en:
http://www.redalyc.org/articulo.oa?id=784 30209. Fecha de consulta: 23 de octubre de 2014.
[15] Romero Díaz, Carmen Helena (2009). La prevención de riesgos laborales y el sentido social responsable desde la gerencia médico-asistencial. ID 1247. VII Congreso Internacional