ORIGINAL RESEARCH ARTICLE
ASSESSMENT OF VULNERABILITY TO SALTWATER INTRUSION IN THE CONTEXT
OF CLIMATE CHANGE
*1
Ngoc Tuan Le and
2Xuan Hoang Tran
1
University of Science – Vietnam National University Ho Chi Minh City
2
Institute of Meteorology Hydrology Oceanology and Environment
ARTICLE INFO ABSTRACT
Research aims to assess the vulnerability (V) to saltwater intrusion (SI) in the context of climate change (CC) by index method based on integrated calculating exposure (E), sensitive (S), and adaptive capacity (AC) indices. Accordingly, 40 indicators for assessing V to SI were established by the expert adjustment method, and then applied to a case study in DongNai province (Vietnam). Calculation results for the period of 2014 - 2030 showed the decrease in V over the years mainly due to the increase in AC and the decrease in S. NhonTrach district was the most vulnerable area to SI, followed by LongThanh and BienHoa. This index method showed the superiority when being able to identify defective links of the system, and then suitable and feasible coping solutions. This work also pointed out the important role of AC measures to minimize damage resulted from SI.
Copyright © 2018,Ngoc Tuan Le and Xuan Hoang Tran This is an open access article distributed under the Creative Commons Attribution License, which permits unrestricted use, distribution, and reproduction in any medium, provided the original work is properly cited.
INTRODUCTION
In the context of climate change (CC) increasingly going strong, river flow has been greatly influenced, indirectly affecting the saltwater intrusion (SI), thereby, altering water quality, affecting most of relevant activities in the riparian areas. Recently, many studies on CC consider SI as one of the most concern issues, especially in the estuaries and coastal areas (Abd-Elhamid and Javadi 2011; CISA 2012; PEIDELJ 2011; Pham and Nguyen 2012; Rasmussen et al. 2013; Tran et al. 2012; Vu and Luong 2009). Most researches on SI have been focused on assessing salinization current, simulating, warning, and then proposed solutions, etc. However, this approach soon showed the inadequacy for not taking into account the characteristics of affected objects like the sensitivity and adaptive capacity. In other words, the vulnerability to SI of different regions or sectors in the context of CC almost has not been fully forecasted and assessed yet. That vulnerability (V) to SI is entirely considered in the
*Corresponding author: Ngoc Tuan Le
University of Science – Vietnam National University Ho Chi Minh City
relationship among the level of exposure (E), sensitivity (S) and adaptive capacity (AC) (via related indicators) (IPCC 2001, 2007) will provide a basis for planning suitable policies, strategies, and coping measures in each specific condition, contribute to minimize risks, and ensure the sustainable development of concerned socio-economic sectors (Nguyen et al. 2012; Preston et al. 2007; Vo 2014). This is considered as one of the outstanding characteristics of the evaluation approach. However, indicators used to assess vulnerability to SI in general and each part (E, S, and AC) in particularly have not been detailed established. DongNai province is in DongNai - Saigon River basin, despite the landlocked area (the nearest point from the sea about 9km), but with the characteristics of water reserves distribution (approximately 20% in the dry season) and a semi-diurnal tide, rivers here are still at a high risk of SI. In recent years (2007- 2014), the salinization in DongNai province was negatively changed, salinity had increased significantly, especially from March to May. Thus, the SI in DongNai province is increasingly serious and should be concerned. Many studies on SI were carried out in downstream DongNai River (Dau 2007; Lam 2006), but there is hardly one on vulnerability to SI. Accordingly, this study
ISSN: 2230-9926
International Journal of Development Research
Vol. 08, Issue, 04, pp.19801-19807, April, 2018
Article History: Received 19th January, 2018
Received in revised form 28th February, 2018
Accepted 06th March, 2018
Published online 30th April, 2018
Key Words: Saltwater intrusion, Exposure, sensitivity, Adaptive capacity, Vulnerability, Climate change.
Citation: Ngoc Tuan Le and Xuan Hoang Tran, 2018. “Assessment of vulnerability to saltwater intrusion in the context of climate change”, International
Journal of Development Research, 8, (04), 19801-19807.
aims to evaluate the V to SI in the context of CC in DongNai province till 2030 by the index method (based on related E, S, AC indicators), detailed to communes (wards) in the investigated areas (BienHoa city, LongThanh and NhonTrach districts), serving coping to SI in the context of CC in particular and local environmental management in general.
MATERIALS AND METHODS
Professional adjustment: was applied in conjunction with the analytic hierarchy process (AHP) to identify V indicators and calculate their weights. There were 30 experts from 17 prestigious universities and institutes participating in the survey.
The analytic hierarchy process - AHP: was used to calculate weights of E, S, and AC indicators. Expert opinions were synthesized by geometric average method. Priority weight of each indicator was resulted from the multiplication between its weight and the weight of the group that it belongs to. Professional adjustments consistent when the consistency ratio (CR) is less than 0.1.
Sociological investigation method: The survey of adaptive capacity (awareness, attitudes, and behaviors of communities and local managers about SI and CC, management capacity of related sectors, etc.) was performed via questionaires in the riparian areas, including BienHoa city, NhonTrach and LongThanh districts. Respondents were residential communities (270 households), commune authorities (57 Commune People's Committees), and local managers (45 officers).
Modelling: MIKE NAM and MIKE 11 were used to calculate
hydraulic and spreading of salinity on downstream of DongNai River basin to 2030. Editor River Network and Cross Section Editor tools in Mike 11 were used to create river network. Rainfall data was collected from 12 monitoring stations in the local. Water level and flow rate data was collected from 8 monitoring stations in the research area.
GIS method: MapInfo 11.0 was applied to mapping the E, S, AC, and V index to SI. The Spatial Interpolation Method was used to calculate exposure levels to SI for different investigated areas. Inverse Distance to a Power gridding method and Surfer 10.0 were chosen. Fixed-search radius of 30-60 km was applied. The barrier was the boundary of river basins.
Index method
The assessment process by index method is as follows:
Identifying indicators (E, S, AC)
Determining the weight of each indicator
Collecting and calculating related figures; standardizing data in the scale of 0-100.
Calculating E, S, AC, and V indices
Mapping, analysis and evaluation
Indices, such as AC, were calculated based on standardized values of sub-indices (ACi) and their weights (wAci) by the
formula (1), where n: number of component indicators; ACi:
standardized value of the i indicator; WAci: priority weights of
the i indicator; AC: the synthetic adaptive capacity. The same
approach was used to calculate E and S indices. For V index, the formula (2) was used (Worldbank 2010). The levels of E, S, AC, and V to SI were evaluated according to the scale presented in Table 1.
1
*
n
i ACi
i
AC
AC
W
………(1)
(100
)
3
E
S
AC
[image:2.595.306.554.106.239.2]V
…
……….(2)Table 1. Assessment scale
Value 0-25 25-50 50-75 75-100 Level Low Medium-low Medium-high High
RESULTS AND DISCUSSIONS
Indicators and weights
Indicators: By professional adjustment and AHP methods as
mentioned, indicators for evaluating V to SI in the context of CC and their weights were built as in Table 2.
Exposure level to SI in the context of CC
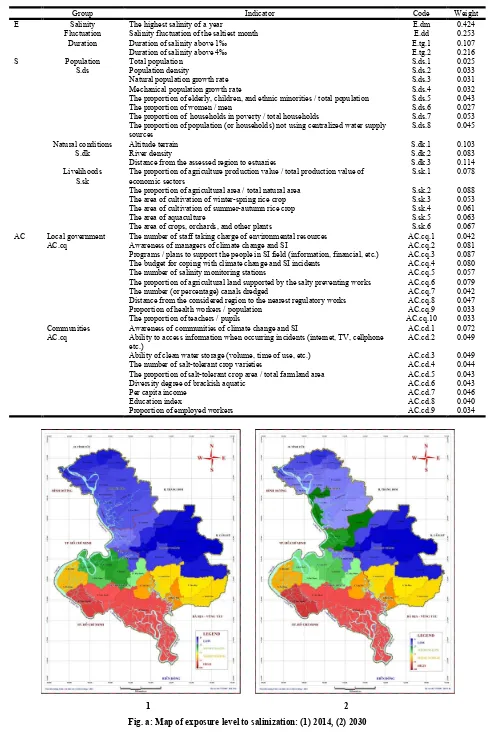
Results showed that: (i) The high exposure area (E ≥ 75): near LongTau, DongTranh, GoGia rivers and ThiVai river downstream; (ii) The medium – high exposure area (50 ≤ E < 75): ThiVai river upstream, NhaBe, and LongTau rivers; (iii) The medium – low exposure area (25 < E < 50): DongNai river above the confluence with Saigon river about 10km and the area between DongMon and ThiVai rivers; (iv) The low exposure area (E ≤ 25): the entire of BienHoa city, a part of LongThanh district located near Buong river, part 4 of DongNai river, and ThiVai river upstream (Fig.a). The exposure level tends to increase over time (2020, 2030). The differences between the current E and that in 2030 are relatively small: 8.6, 1.96, and 2.71 in BienHoa, LongThanh, and NhonTrach, respectively. Thus, effects of CC and sea level rise to the exposure level to SI are not really clear in the period 2014-2030, however, the increase in exposure index partly reflects the challenges for local governments and communities in response to SI and CC.
Sensitivity level to SI
Table 2. Indicators and their weights for evaluating V to SI in the context of CC
Group Indicator Code Weight
E Salinity The highest salinity of a year E.dm 0.424
Fluctuation Salinity fluctuation of the saltiest month E.dd 0.253
Duration Duration of salinity above 1‰ E.tg.1 0.107
Duration of salinity above 4‰ E.tg.2 0.216
S Population
S.ds
Total population S.ds.1 0.025
Population density S.ds.2 0.033
Natural population growth rate S.ds.3 0.031
Mechanical population growth rate S.ds.4 0.032
The proportion of elderly, children, and ethnic minorities / total population S.ds.5 0.043
The proportion of women / men S.ds.6 0.027
The proportion of households in poverty / total households S.ds.7 0.053 The proportion of population (or households) not using centralized water supply
sources
S.ds.8 0.045
Natural conditions S.đk
Altitude terrain S.đk.1 0.103
River density S.đk.2 0.083
Distance from the assessed region to estuaries S.đk.3 0.114 Livelihoods
S.sk
The proportion of agriculture production value / total production value of economic sectors
S.sk.1 0.078
The proportion of agricultural area / total natural area S.sk.2 0.088 The area of cultivation of winter-spring rice crop S.sk.3 0.053 The area of cultivation of summer-autumn rice crop S.sk.4 0.061
The area of aquaculture S.sk.5 0.063
The area of crops, orchards, and other plants S.sk.6 0.067 AC Local government
AC.cq
The number of staff taking charge of environmental resources AC.cq.1 0.042 Awareness of managers of climate change and SI AC.cq.2 0.081 Programs / plans to support the people in SI field (information, financial, etc.) AC.cq.3 0.087 The budget for coping with climate change and SI incidents AC.cq.4 0.080 The number of salinity monitoring stations AC.cq.5 0.057 The proportion of agricultural land supported by the salty preventing works AC.cq.6 0.079 The number (or percentage) canals dredged AC.cq.7 0.042 Distance from the considered region to the nearest regulatory works AC.cq.8 0.047 Proportion of health workers / population AC.cq.9 0.033
The proportion of teachers / pupils AC.cq.10 0.033
Communities AC.cq
Awareness of communities of climate change and SI AC.cd.1 0.072 Ability to access information when occurring incidents (internet, TV, cellphone
etc.)
AC.cd.2 0.049
Ability of clean water storage (volume, time of use, etc.) AC.cd.3 0.049 The number of salt-tolerant crop varieties AC.cd.4 0.044 The proportion of salt-tolerant crop area / total farmland area AC.cd.5 0.043
Diversity degree of brackish aquatic AC.cd.6 0.043
Per capita income AC.cd.7 0.046
Education index AC.cd.8 0.040
Proportion of employed workers AC.cd.9 0.034
1 2
[image:3.595.59.542.91.777.2]Adaptive capacity level to SI
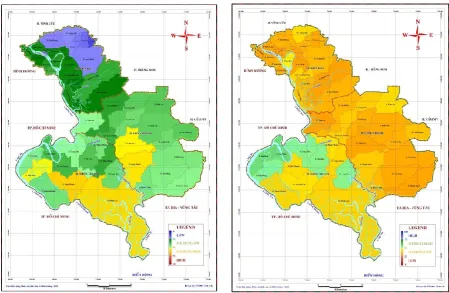
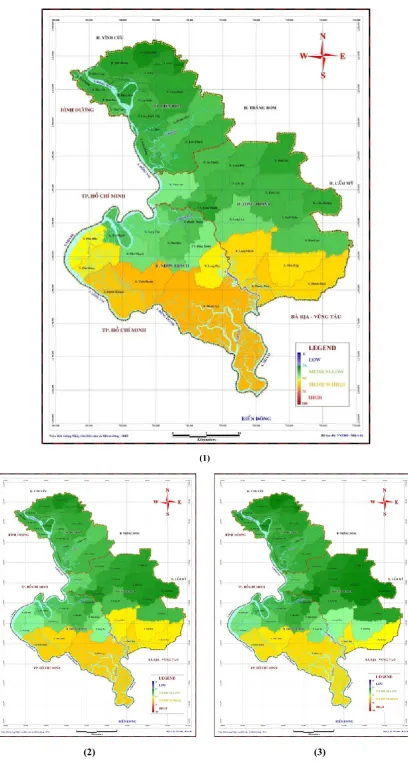
Results showed that in 2014, nearly 90% of investigated wards have AC indices in the range of medium-low level, distributed in BienHoa (30), LongThanh (15), and NhonTrach (6). Forecasts to 2020 and 2030, the local AC indices to SI are increased: the mentioned number of 90% is gone down to about 88% and 60% in 2020 and 2030, respectively. Indicators need taking into concern to improve the local AC include: financial (budget, GDP), policy (support for people to cope with SI and climate change), agriculture (salt-tolerant seeds), aquaculture (brackish and saline water aquaculture), irrigation work (irrigation, SI prevention system), water storage, health, and education (Fig. c). Overall, in the period of 2014-2030, the AC of the investigated area has increased over the years (due to gradually improving community awareness, rising per capita income, increasing communication efficiency, education index, and employee percentage, etc.), but most at the medium – low level. This is the challenge for governments and communities in responding to SI in the context of CC.
Vulnerability to SI in the context of CC
In the period of 2014 - 2030, NhonTrach was the most vulnerable area to SI, followed by LongThanh and BienHoa. Besides, the V index tends to decrease (Fig. d), which is consistent with the small change of E, the increase in AC, and the decrease in S indices over the years. In 2014, NhonTrach district had the highest V index (52.28), in which PhuocAn, VinhThanh, PhuocKhanh, PhuDong, LongTho, and PhuHuu were the most vulnerable communes (medium-high level). PhuocAn commune had the highest V index in the study area; sectors of concern in the local were agriculture and aquaculture in the context of SI increasingly hiked up. This could be explained by: (i) E index: the highest salinity of the study area; long time of salinity above 1‰ and 4‰ (only shorter than those in LongTho and PhuocThai); high level of E
index (78.3) (only smaller than that in PhuocKhanh of NhonTrach district). (ii) S index: high natural and mechanical population growth rates; high proportion of elderly, children, and ethnic minorities; 100% of households not using centralized water supply; located near the estuary; relatively high values of agricultural production, ratio of agricultural land to the natural area, freshwater aquacultural area, etc. (iii) AC index: limited budgets and no program or plan supporting community to cope with SI; low capacity of water storage; small percentage of salt-tolerant crops area; less diversity of brackish aquatic; located quite far from water regulatory works (Tri An reservoir), etc. Followed by LongThanh district (V = 43.48), of which 4/15 communes had medium-high V index (accounting for 26.7%), the rest ones had medium-low V index. Notably, PhuocThai commune had the highest V index in the district (59.90). Community in general and agriculture in particular in the local were objects of concern, especially in the context of CC increasingly enhanced. This could be explained by: (i) E index: medium-high E index (71.26), resulted from E.dm of 87.92 and E.tg of 99.34. (ii) AC index: quite similar to PhuocAn commune (NhonTrach distric). (iii) S index: high natural and mechanical population growth rates; relatively high proportion of elderly, children, and ethnic minorities; relatively low altitude terrain; many rivers and close to the estuary; notably, high proportion of agricultural land (accounting for 38.5%), contributing 16.4% to the total value of production of the local. BienHoa was the least vulnerable city to SI in the investigated area (V = 34.55) with 100% of communes having medium-low V index. It could be explained by: (i) E index: less affected by SI in the research area, thereby E index range of 4.5-17 (low exposure level). (ii) AC index: located close to water regulation works (Tri An reservoir), focusing on monitoring the salinity, high ability to access information, etc. (iii) S index: the majority of people using centralized water supply; low poverty rate; economy in favor of industry and services, less dependent on the agricultural sector (the agricultural sector contributed only 1% of the total
[image:4.595.74.524.55.348.2](1)
[image:5.595.92.501.35.799.2]
(2) (3)
economic value), etc. In 2020, there would be 7/57 communes having medium-high V index (PhuocAn, PhuocKhanh, VinhThanh in NhonTrach district and PhuocThai, BinhPhuoc, LongPhuoc, TanHiep in LongThanh district), declined 3 communes as compared to 2014, the rest ones would have medium-low V level (Fig. d). NhonTrach would be still the most vulnerable district to SI in the research area with 6 communes having medium-high V level (PhuocAn, VinhThanh, PhuocKhanh, PhuDong, LongTho, and Phu Huu); followed by Long Thanh district with 4 communes having medium-high V level (PhuocThai, BinhPhuoc, LongPhuoc, and TanHiep). Bien Hoa would maintain the lowest vulnerability to SI in the study area, but there would be signs of a slight increase as compared to that at the present. The evolution of V index in 2030 would be quite similar to that in 2020. With the increase in AC and the decrease in S indices, the number of communes having medium-high V index would continue to decline from 7 (2020) to 5 (2030), in which, there would be 3 in Nhon Trach (PhuocAn, PhuocKhanh, VinhThanh) and 2 in Long Thanh district (PhuocThai, Phuoc Binh). As mentioned, the V index changes following the variation of the 03 indicator groups: E index increases by the time, the S and AC indices change in a positive direction in relation to the socio-economic development planning. With the warning purpose, this work carried out an additional case: assuming S and AC indices unchanged as compared to the present, and only the E index varied. Calculation results showed the V index would increase over the years during the period of 2014 - 2030, but the increased value in each locality would be different and not significant (less than 3 points).
Vulnerability to SI of economic sectors
The study results showed 21/57 communes having V>37.5; in which, 12, 07 and 02 communes belong to NhonTrach, LongThanh, and BienHoa, respectively. For V>50, the corresponding figures were 06, 04, and 0. Therefore, the assessment and remediation of weaknesses to reduce the vulnerability to SI were chiefly implemented in Long Thanh and Nhon Trach districts for agriculture (farming, aquaculture) and water exploitation sectors, etc.
Vulnerability to SI of the agriculture sector
On the basis of the current status (and planning to 2020) of farmland area, crops (rice, sugarcane, wheat, sweet potatoes, corn, vegetables, etc.), and the corresponding V index, it could be recognized some communes of concern as PhuocAn, VinhThanh, PhuocKhanh (Nhon Trach district) and PhuocBinh, TanHiep, BauCan, LongPhuoc, PhuocThai, CamDuong, SuoiTrau (Long Thanh district). For the aquaculture sector, areas of concern were PhuocAn (NhonTrach district) and a part of PhuocThai (LongThanh district); however, tiger prawn, white shrimp, and some fish types adapting to high salinity (grouper, seabass, cobia, mullet, catfish, etc.) have been currently fed, therefore vulnerability level could be negligible. Besides, local agricultural sector will be gradually reduced according to planning, related objects in the vulnerable areas due to SI thereby would be also declined.
Vulnerability to SI of water exploitation sector
Besides the water plants mainly located in BienHoa city (HoaAn water plant and BienHoa water plant) -less affected by SI, LongThanh and NhonTrach districts have low proportions
of households using centralized water supply in the investigated area (corresponding to about 24% and 26%) and low efficiencies of irrigation projects (serving 79% and 60% of irrigation capacity, respectively), etc. This is obviously a challenge, especially in the context of SI and CC increasingly serious. In general, aspects affecting vulnerability to SI in the context of CC in the local were identified and prioritized to respond as follows: (i) in NhonTrach district: E ≥ AC> S; (ii) in LongThanh district: AC> E ≥ S; (iii) in the whole investigated area: AC> E> S. Thus, AC index could be considered as the main cause affecting V index in the local. Accordingly, it is necessary to establish measures focusing on improving the adaptive capacity to SI.
Conclusions
The V index to SI was calculated based on E, S, and AC indices. The index method was used and showed its superiority when identifying defective links of the system, serving proposals of feasible coping solutions. Calculation results for the period 2014 - 2030 showed the decrease in V over the years due to the small increase in E, the decrease in S, but relatively significant increase in AC indices. The number of communes having medium-high V level would be declined from 10 to 7 and then to 5 in 2014, 2020, and 2030, respectively. Communes of concern (V>50) include PhuocAn, VinhThanh, PhuocKhanh, PhuDong, LongTho, PhuHuu (NhonTrach district) and PhuocThai, PhuocBinh, LongPhuoc, TanHiep (LongThanh district). Currently, NhonTrach district was the most vulnerable area to SI (V = 55.28) in general, followed by LongThanh (V = 43.48) and BienHoa (V = 34.55). This work also pointed out the important role of AC index among measures to minimize damage resulted from SI in the local.
Acknowledgement
This research is funded by Department of Science and Technology, Dong Nai province within the framework of Environmental Protection Program of Dong Nai province in 2011-2015.
REFERENCES
Abd-Elhamid H. F., A. A. Javadi 2011. Impact of sea level rise and over-pumping on seawater intrusion in coastal aquifers. Journal of water and climate change 2 (1) 19-28. DOI: 10.2166/wcc.2011.053
Carolinas Integrated Sciences and Assessments (CISA), University of South Carolina 2012. Assessing the Impact of Saltwater Intrusion in the Carolinas under Future Climatic and Sea Level Conditions. Columbia, SC. Available online at www.cisa.sc.edu/Pubs_Presentations_Posters/Reports/ 2012_CISA%20and%20SC%20Sea%20Grant_Salinity%2 0SARP%20Report.pdf.
Dau V. N 2007. Computing saltwater intrusion in Dong Nai river basin. Journal of Geology 301. Available online at http://www.idm.gov.vn/nguon_luc/Xuat_ban/2007/A301/a 76.htm.
IPCC WGII 2007. Climate Change 2007: Impacts, Adaptation and Vulnerability. Contribution of Working Group II to the Fourth Assessment Report of the Intergovernmental Panel on Climate Change. Cambridge UniversityPress, Cambridge, United Kingdom and New York, NY, USA pp 869 - 883.
Lam M. T. 2006. Study and propose feasible and appropriate models to carry out environmental protection projects in Dong Nai river basin. Department of Natural Resources and Environment, Ho Chi Minh City.
Ministry of Natural Resources and Environment (MONRE) -Vietnam 2009. Climate change and sea water rise scenarios for Vietnam.
Nguyen T. B., Lam H., Thach S. P. 2012. Vulnerability Assessment with involvement: Salinization in the Mekong Delta. Journal of Science 24b:229-239.
Pham T.T and Nguyen T.H. 2012. Impact of climate change – sea level rise to saltwater intrusion in the North delta coastal strip. Journal of Water resources and Environmental Engineering 37:35-39.
Preston B.L., D. Abbs, B. Beveridge, C. Brooke, R. Gorddard, G. Hunt, M. Justus, P. Kinrade, I. Macadam, T.G. Measham, K. McInnes, C. Morrison, J. O’Grady, T.F. Smith and G. Withycombe 2007. Spatial Approaches for Assessing Vulnerability and Consequences in Climate Change Assessments. Paper presented at the Proceedings of MODSIM 2007: International Congress on Modelling and Simulation, Christchurch, NZ.
Prince Edward Island Department of Environment, Labour and Justice – PEIDELJ 2011. Saltwater intrusion and climate change. Available on line at www.gov.pe.ca/ photos/original/cle_WA1.pdf.
Rasmussen P., Sonnenborg T. O., Goncear G., and Hinsby K. 2013. Assessing impacts of climate change, sea level rise, and drainage canals on saltwater intrusion to coastal aquifer. Hydrology and Earth System Sciences 17:421–443. Tran Q. D., Nguyen H. T., Kanchit L 2012. Simulation of saltwater intrusion in Mekong Delta under the impacts of sea level rise and upstream flow decline. Journal of Science 21b:141-150.
Vo T. D. 2014. Assessing vulnerability due to saltwater intrusion to agriculture in coastal area in Tra Vinh. Journal of Science and Technology 02:24 – 33.
Vu H. H., Luong H. D. 2009. Research, forecast saltwater intrusion trend due to sea level rise for estuaries on North Coast. Journal of Water resources and Environmental Engineering 27:67-78.
WordBank 2010. Climate Risks and Adaptation in Asian Coastal Mega cities. A Synthesis Report. Available online at www.siteresources.worldbank.org/eastasiapacificext/ Resources/226300-1287600424406/coastal_megacities_ fullreport.pdf