Using the Pattern-of-Life in Networks to Improve the
Effectiveness of Intrusion Detection Systems
Francisco J. Aparicio-Navarro, Jonathon A. Chambers
School of Electrical and Electronic EngineeringNewcastle University Newcastle upon Tyne, NE1 7RU, UK
e-mail: {francisco.aparicio-navarro, jonathon.chambers}@ncl.ac.uk
Konstantinos Kyriakopoulos, Yu Gong, David Parish
School of Mechanical, Electrical and Manufacturing Eng.Loughborough University Loughborough, LE11 3TU, UK e-mail: {elkk, y.gong, d.j.parish}@lboro.ac.uk
Abstract—As the complexity of cyber-attacks keeps increasing, new and more robust detection mechanisms need to be developed. The next generation of Intrusion Detection Systems (IDSs) should be able to adapt their detection characteristics based not only on the measureable network traffic, but also on the available high-level information related to the protected network to improve their detection results. We make use of the Pattern-of-Life (PoL) of a network as the main source of high-level information, which is correlated with the time of the day and the usage of the network resources. We propose the use of a Fuzzy Cognitive Map (FCM) to incorporate the PoL into the detection process. The main aim of this work is to evidence the improved the detection performance of an IDS using an FCM to leverage on network related contextual information. The results that we present verify that the proposed method improves the effectiveness of our IDS by reducing the total number of false alarms; providing an improvement of 9.68% when all the considered metrics are combined and a peak improvement of up to 35.64%, depending on particular metric combination.
Keywords—Contextual Information; Dempster-Shafer Theory; Fuzzy Cognitive Maps; Intrusion Detection Systems; Network Security; Pattern-of-Life; Port Scanning Attack
I. INTRODUCTION
Cyber-security has increasing importance to Internet users. Therefore, providing strong and reliable security mechanisms has become essential in all areas of society, but it becomes especially critical in the context of networked national security, as parts of its core infrastructure are constantly targeted by cyber-attacks. The implementation of monitoring tools, such as Intrusion Detection Systems (IDSs), is fundamental in security infrastructures in order to provide extra level of assurance, identifying evidence of attacks or intrusion attempts. Great effort has been made by researchers in the area of network security to increase the effectiveness of the IDSs. However, network systems are still victims of cyber-attacks.
Current IDSs make use only of measurable network traffic information from the protected system or signatures of known cyber-attacks during the intrusion detection process, but these systems do not take generally into account available high-level information (i.e. above the network operation) regarding the protected system [1]. As we previously discussed in [2], the next generation of IDSs should incorporate contextual information, situational awareness and cognitive information, pertaining to the experts’ judgment on the network behaviour within the intrusion detection process. Ideally, IDSs should be able to adapt
their detection characteristics based not only on the measureable network traffic, but also on the context in which these systems operate, and the information provided by the network users.
In this work we have made use of the Pattern-of-Life (PoL) [3] of the network usage as the main source of high-level information. The PoL of the network is directly correlated with the number of users accessing the Internet. The presence of network users could be correlated with the time of the day and the usage of the network resources to generate useful contextual information. This information could, in turn, be used by our IDS to improve its detection results.
In order to incorporate the PoL into the detection process, a Fuzzy Cognitive Map (FCM) [4] can be used in conjunction with our anomaly-based IDS. An FCM provides a useful framework to represent the behaviour of a system and to calculate the degree of influence that one event or action may have upon the whole system and upon parts of the system. In this paper, we extend the analysis of this approach that we previously proposed in [2], by using more realistic network measurements, and a novel scheme to construct the FCM design. The FCM is used to fine-tune some of the techniques used by our IDS, with the main objective of improving the detection results. The experimental analysis evidences the improved detection performance of an IDS using an FCM to leverage network related context.
The rest of the paper is organised as follows. In Section II the most relevant previous work is reviewed. The detection methodology used by our IDS is explained in Section III. In Section IV, a description of an FCM is provided and the proposed approach for the use of an FCM within an IDS is described. The network testbed and the network traffic measurements that compose the analysed dataset, as well as the implemented attacks are described in Section V. Section VI describes the experiment results. Finally, conclusions and suggestions for future work are given in Section VII.
II. RELATED WORK
Future IDSs need to detect intelligently network attacks, not only by using measurable information from the network, but also integrating contextual information into the detection process. The authors of [5] present an extensive and very detailed survey about current research on context-based information fusion systems. This work explains that data fusion systems that use contextual information to improve the quality of the fused output have gained importance in the last few years. It also emphasises This work was supported by the Engineering and Physical Sciences
Research Council (EPSRC) Grant number EP/K014307/2 and the MOD University Defence Research Collaboration in Signal Processing.
that contextual information should be an important asset at any level of modern fusion systems.
In [6], the authors proposed an IDS that relies on contextual information to classify the alerts as relevant or irrelevant. The IDS makes use of contextual information about hosts present in the network and known vulnerabilities. Although the results show improvement in the effectiveness of the IDSs, this is a supervised system, and its performance depends on a chosen threshold, which is selected after a number of runs.
Ontologies have also proven to be powerful tools to specify and structure knowledge, to represent behaviours schematically, or to provide formal specification of different entities in a system and their relationships. For instance, the authors of [1] propose a security ontologies-based approach to add context information into a process that fuses the outcome of heterogeneous distributed IDSs. By using this high-level information, the authors are able to reduce the number of false positive alerts.
All these techniques have proven to increase the efficiency of different systems. However, in contrast to FCM, none of these techniques is able to model the influence of the different states/events in the overall system. FCMs have been previously described and used in [4, 7] to model human knowledge, together with new and unseen behaviours of particular scenarios. The authors of [4] provide a detailed description of the FCM and its mathematical foundation. The authors in [7] provide a detailed description of an FCM and examples that use an FCM to model fault propagation in interconnected systems.
The work presented in [8] focuses on developing an actionable model of situation awareness for army infantry platoon leaders that could replicate human cognition using FCMs. Their FCM is designed based on a goals submap, a tree-like diagram that structures the goals and subgoals of the platoon, and the relationships between these goals. One of the characteristics of the FCM presented in [8] is that the people responsible for designing the FCM do not provide weight values to the modelled concepts, but rank the importance of each concept. A similar approach is presented in [9], in which situation awareness is represented using an FCM.
In [10], the authors describe a knowledge acquisition system that systematically acquires design knowledge from multiple experts and constructs an FCM. The authors of [11] highlight the time consuming issues related to the manual construction of large FCMs. In order to solve these issues, the authors present a framework to semi-automate the construction of FCMs using information from a database and other sources of information.
In [12], the authors use an FCM to model causal knowledge within network data. Based on this knowledge, their system calculates the severity/relevance of the modelled network data to attacks. This approach would allow their IDS to discard irrelevant events and focus only on important ones. However, in contrast to the approach that we propose, this research does not use an FCM to modify parameters in the detection process, but as an events filtering process prior to the actual detection.
III. INTRUSION DETECTION METHODOLOGY
As many researchers have previously demonstrated [13, 14], the combined use of multiple metrics from the same or different network stack layers may result in higher Detection Rate (DR) with lower numbers of false alarms for an IDS. The higher the number of metrics used, the greater the chances to identify the
presence of attack. Therefore, we use a cross-layer approach, using multiple metrics to carry out the detection process. Our IDS uses the Dempster-Shafer (D-S) Theory of Evidence to combine the evidence from the different metrics.
A. Dempster-Shafer Theory of Evidence
D-S is a data fusion technique that combines evidence of information from multiple and heterogeneous events in order to calculate the belief of occurrence of another event. D-S theory starts by defining a frame of discernment Θ = {θ1, θ2,..., θn}, which is the finite set of all possible mutually exclusive outcomes of a particular problem domain. Assuming Θ has two outcomes {A, N}, the total number of hypotheses that Θ
composes is 2Θ = {A, N, {A|N}, Ø}. In the case of {A|N}, this subset corresponds to Uncertainty (either A or N). In addition, the empty set Ø is always equal 0. Each hypothesis is assigned a belief value within the range [0, 1], also known as Basic Probability Assignment (BPA), which expresses the evidence attributed directly to the hypothesis. Then, D-S uses Dempster’s rule of combination to calculate the orthogonal summation of the belief values from two different sensors or observers, and fuses this information into a single belief. This rule is defined in (1), where m1(H) and m2(H) are the beliefs in the hypothesis H, from observers 1 and 2, respectively. ! ∩ # = % refers to all combinations of evidence which yield H; whereas ! ∩ # = ∅ refers to the mutually exclusive subsets of the hypothesis H, thus their intersection is the empty set. Once all the belief values have been fused, our IDS classifies the information according to the hypothesis with the highest BPA.
' % = ,∩-./') ! ∗ '+ #
1 − ,∩-.∅') ! ∗ '+ # ∀ % ≠ Ø (1)
B. Automatic BPA Methodology
In [15], we proposed a novel BPA methodology able to automatically adapt the assignment of its evidence to the current characteristics of the network traffic, without intervention from an IDS administrator. The proposed BPA methodology exploits a Sliding Window (SW) scheme to compute statistical parameters from the data and generate the different BPA values. Three independent statistical approaches provide, for each analysed metric, the belief values on the different hypotheses. The approach that assigns BPA values to the hypothesis Normal
uses the distribution of the network traffic within the SW. The approach that assigns BPA values to the hypothesis Attack uses the Euclidean distance from a defined reference of normality (i.e. mean of information within the SW). Meanwhile, the BPA in the hypothesis Uncertainty is assigned based on the belief values assigned to Normal and Attack in the current SW. Once these values have been generated, the different BPA values are fused using D-S theory. The BPA in Normal and BPA in Attack
indicate how strong the belief is that the current analysed data is non-malicious and malicious, respectively, whereas, the BPA in
Uncertainty indicates how doubtful the system is regarding whether the current analysed data is malicious or non-malicious.
IV. INTRUSION DETECTION METHODOLOGY
A. Fuzzy Cognitive Map
An FCM is a graphical representation of the modelled system, as perceived by different human experts. An FCM is
able to predict the outcome of the evaluated problem by letting the relevant events interact, and to calculate the actual degree of influence that one event may have upon the system.
The graphical representation of FCMs is characterised by a set of nodes interconnected by causal connections. The nodes in the FCM represent causal and time-varying concepts, events or actions that describe the behaviour of the system. Each node C carries a weight A(t) in the fuzzy range [0, 1], which indicates the quantitative measure of the importance that each concept has in the system, at time t. The weight A(t) is computed by the FCM after an iterative process. The connections between nodes represent the causal relationship between the concepts. Each link is assigned a weight value wij(t) in the fuzzy interval [-1, 1], which indicates the relationship and degree of influence from the nodes Ci to Cj. There are three possible relationships between nodes: 1) wij > 0, indicating a positive relationship (i.e. Aj(t) increases as Ai(t) also increases); 2) wij < 0, negative relationship (i.e. Aj(t) increases as Ai(t) decreases, and Aj(t) decreases as Ai(t) increases); 3) wij = 0, no relationship.
An FCM can be represented by a [m ×m] matrix M, where [M]ij = |wij| is known as an adjacency matrix and m is the number of nodes in the modelled FCM. The matrix M describes the relationship between the nodes and the weight values wij(t) associated with each link. The initial weight value A(t) of all the nodes in a model at time t = 0 can be represented by the initial vector state A, where A(0) = (A1(0), A2(0),…, Am(0)). Ai(0) is the weight value of node i at time t = 0. The FCMs evolve via an iterative process in which, at each future time step, the weight value of each concept A(t) is calculated by aggregating the influence of the interconnected concepts. This process continues for a number of iterations until the FCM reaches one final fixed model, known as a hidden pattern or fixed-point attractor. This is when the weight values A(t) in all the nodes do not change in successive iterations. It is also possible that an FCM keeps cycling between several fixed models, or it may continue generating different models indefinitely. We have empirically chosen the limit cycle t = 60. A more detailed description of FCM models can be found in [4].
B. BPA Adjustment Using the FCM
The approach that we propose to incorporate contextual information from the PoL of the network usage is based on the adjustment of the BPA values assigned prior to the data fusion process, by using the outcome of the FCM. Once the BPA values have been computed as explained in Section III.B, the outcome of the FCM will be used to adjust these accordingly.
The first step in the process of creating the FCM is defining the main concepts relevant for the detection system. In order to infer these concepts from the PoL, we have correlated the number of network users accessing the Internet with the time of the day and a number of network traffic metrics that characterise the usage of the network resources.
In total, 14 different concepts were defined for the FCM, which have been sorted in Table I. The FCM concepts C1-8 define the different ranges in which the time has been divided. Since the network traffic datasets used in this work have been collected from a network in a research office environment, it is expected to see an increase in the network usage during common office hours (i.e. from 9am to 5pm, weekdays). Nonetheless, there may be also high network usage outside this timeframe. In total, four timeframes have been defined per day. These are
00-09h, 09-17h, 17-19h, and 19-24h, distinguishing between weekdays and weekends. The concepts C9-12 define three throughput levels that separate different levels of the network throughput, depending on different times of the day. These thresholds have been defined based on the prior knowledge of the network administrators. The thresholds have been defined as 4 Mbps, 12 Mbps, and 40 Mbps. Finally, both concepts C13=
Normal and C14= Abnormal are the two possible outcomes of the FCM. The weight values associated with both concepts are finally used to fine-tune the BPA values of our IDS.
TABLE I. LIST OF CONCEPTS FOR FCM FCM Concepts Concepts Definition
C1 00 – 09 h / Weekday C2 09 – 17 h / Weekday C3 17 – 19 h / Weekday C4 19 – 24 h / Weekday C5 00 – 09 h / Weekend C6 09 – 17 h / Weekend C7 17 – 19 h / Weekend C8 19 – 24 h / Weekend C9 Throughput < 4 Mbps C10 4 Mbps < Throughput < 12 Mbps C11 12 Mbps < Throughput < 40 Mbps C12 Throughput > 40 Mbps C13 Normal C14 Abnormal
The next step is to define the relationships among these concepts, the negative or positive influence, and assign the fuzzy degree of influence using the five qualitative variables {very low, low, medium, high, and very high}. In order to transform the variables to numerical degree of influence values, consider the membership functions presented in Fig. 1. The five linguistic variables, 7 = 5, are sorted in an ascendant order of importance and represented by {µvl, µl, µm, µh, µvh}. Then, these variables are transformed to the numerical values wij(t) associated with each link, as explained in [10], using (2):
9:=; 7−
1
27 (2) where 7 is the total number of variables, and ; is the ordinal number that represents the position of the respective linguistic variable in the list. In this example, the weights assigned to the variables {µvl, µl, µm, µh, µvh} would be {0.1, 0.3, 0.5, 0.7, 0.9}.
Fig. 1. Membership functions corresponding to each of the linguistic variables, when the total number of variables equals five (n = 5).
One adjacency matrix has been defined for each network user, the time of the day and the usage of the network resources. Then, all the adjacency matrices have been merged in the
[14×14] adjacency matrix M shown in Fig. 2. The value of Ai(t) changes at each iteration as described below in (3):
=> ? + 1 = A B = A => ? + CD> ? ∗ =D ? E
D.)DF>
(3) where Ai(t+1) is the weight value of node Ci at time t+1, Aj(t) is the weight value of node Cj at time t, and wji(t) is the degree of influence of node Cj on node Ci. The new weight values of the nodes are calculated, after an iterative process, by aggregating the influence of the interconnected concepts using an activation function ƒ. In our experiments, we have used the hyperbolic tangent activation function, described in (4), because it produces a weight values Ai(t) normalised in the range [-1, 1]. Hence, this activation function complies to one of the requirements of the D-S theory, which requires that the BPA values assigned to each hypothesis could be any value up to 1.
A B =H
I− HJI
HI+ HJI (4)
After all the BPA values have been adjusted using the outcome of the FCM, the data fusion process is carried out using the Dempster’s rule defined in (1) and the final decision is taken. It is worth noting that, although the same weight values are used to adjust all of the considered metrics, it is unlikely for these metrics to have the same BPA value. Therefore, the adjustments would impact each of the metrics differently.
Fig. 2. Merged [14×14] adjacency matrix of the FCM composed using the number of network users, the time of the day and the usage of the network.
V. TESTBED AND NETWORK TRAFFIC MEASUREMENTS
A. Testbed LAN
The analysed data has been gathered from a Local Area Network (LAN) in a research office environment, in the Wolfson School at Loughborough University. The PCs in two distinct labs are connected to the same office LAN, and these PCs are used by researchers daily, mostly for Internet access. The network data traffic generated by these PCs is used in our experiments as realistic background network traffic.
Network traffic from all the PCs in the office LAN is mirrored and routed in the SPAN port of a Cisco switch. The switch aggregates the traffic from all the PCs in the office LAN using the SPAN port. A computer, named Netflow Collector in Fig. 3, has been allocated to run two software daemons: softflowd [16] and nfcapd [17]. Softflowd, is a flow-based network monitor software that receives the aggregated network
traffic from the SPAN port and transforms it into netflow data. The software nfcapd, collects the netflow, stores it locally in a flat file system and, finally, runs a custom made script to insert the netflow data in a PostgreSQL database for future analysis.
In addition, two additional PCs have been connected through a Netgear hub to a testbed LAN in order to implement the attacks: an attacker that runs Linux Ubuntu and launches the attack using the network mapping tool Nmap [18], and a victim that also runs Ubuntu and is also in charge of gathering all the network traffic used in our experiments. The victim PC was also used to accesses the Internet during the experiments. The attacker and the victim receive the traffic from the rest of the office LAN through the hub connected to the switch. Figure 3 shows the logical topology of the testbed LAN. The left part of the figure represents the PCs that have generated the background network traffic, whereas the right part represents the Netflow collector and the PCs involved in the port scanning attacks.
Fig. 3. Logical topology of the testbed LAN; PCs on the left generate the background traffic, while those on the right are involved in the port scanning attacks implementation, and detection process.
B. Evaluated Network Attack
In this paper we use a port scanning attack, also known as probing, to evaluate the approaches that we propose. A port scanning attack is one of the most popular techniques to discover active services with weak security in the targeted victim or well-known vulnerabilities that could be exploited [19]. Although port scanning has been investigated for over a decade, this attack is a growing cyber-security concern due to the fact that it often precedes the implementation of multi-stage cyber-attacks and more elaborate network intrusion attempts [20].
To carry out the port scanning attacks that we have implemented in the experiments, we have used the network mapper Nmap. Nmap is a popular open source port scanning tool that provides a variety of probing techniques for network exploitation and security auditing. In addition to Nmap, we have made the implementation of the attacks easier by using the official Nmap GUI, Zenmap [18]. Nmap and Zenmap allow the implementation of different modes or profiles of the port scanning attack (e.g. intensive scan, slow comprehensive scan, or quick scan). Each of these modes of attack will manifest itself differently in the network as the intensity of the attack varies from one another. Throughout the experiments, we have implemented a number of these different modes.
C. Network Traffic Measurements
All the network traffic from the testbed LAN has been aggregated and gathered in pcap format using the network
packets analyser Tcpdump [21]. In total, 160 GBytes of network traffic has been gathered during the 9 days that the experiment lasted (from 21st July to 29th July, 2016). This traffic dataset comprises 99.40% of normal traffic (i.e. 696638 data instances) and 0.60% of malicious traffic (i.e. 4220 data instances).
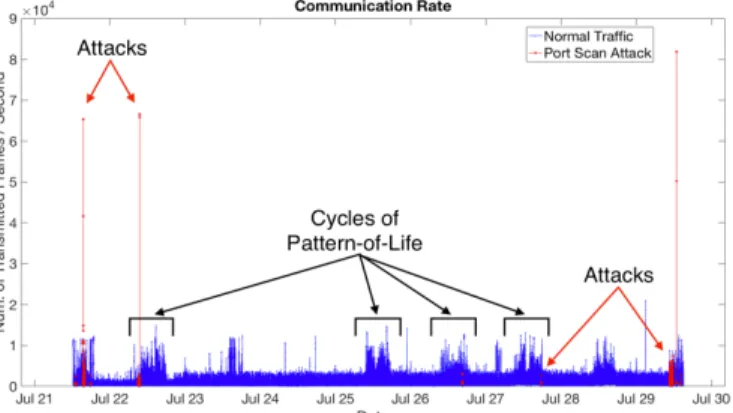
Four different metrics have been extracted directly from the dataset, which are used to carry out the intrusion detection analysis. These metrics are Communication Rate (COM), the number of frames transmitted per second; Throughput (THR), the number transmitted bytes per second; Destination Port Distribution (DST), the number of unique destination ports per second; and Source Port Distribution (SRC), the number of unique source ports per second. The first three metrics are represented in Figs. 4-6. Since the two metrics SRC and DST have very similar profiles, the metric SRC is not presented in this work. The figures present cyclic patterns in the metric measurements. These cycles correspond to the PoL and the time of the day at which the network is being utilised by more users. The section in blue corresponds to the non-malicious traffic, while the section in red corresponds to the traces of port scanning attacks. As we can also see, Fig. 4 includes extra annotations to help identify the cycles of the PoL and the traces of port scanning attacks. Additionally, a closer look at the day 1 of the THR is shown in Fig. 7. On the one hand, we can differentiate the different PoL depending on the time of the day, and we can also see that the traces of port scanning attack could not be easily identified by using a simple signature or threshold.
Fig. 4. COM- Communication Rate (number of transmitted frames / second) collected over 9 days.
Fig. 5. DST- Destination Ports Distribution (number of unique destination ports per second) collected over 9 days.
Although, it would also be expected that the network resource usage would increase when the attack is implemented,
this is not always the case. As we can see in Figs. 4-7, there are some attack instances that standout from the normal traffic, and are easily differentiable. These instances coincide with the implementation of the intensive scan profile of the port scanning attack, which transmits a very large number of probing frames in a short period of time. In contrast, when the port scanning attack is implemented in a stealth manner (e.g. slow scan), the port scanning attack is not clearly distinguishable from the normal traffic by the use of the selected metrics. This will cause a number of misclassifications during the detection process.
Fig. 6. THR- Throughput (transmitted bytes per second) collected over 9 days.
Fig. 7. THR- Throughput (transmitted bytes per second) collected over 9 days. VI. RESULTS
This section describes the detection results, and compares the results generated by our anomaly-based IDS with and without the use of an FCM. The main purpose of the results is to evidence that the use of contextual information improves the detection capabilities of our anomaly-based IDS.
The effectiveness of the IDS has been evaluated using four well-known parameters, True Positive (TP), True Negative (TN), False Positive (FP), and False Negative (FN). These parameters are essential to calculate the following performance metrics, which quantify the effectiveness of the IDSs: Detection Rate (DR), which is the proportion of anomalies correctly classified among the anomalous data; False Positive Rate (FPr), which is the proportion of normal data misclassified among all the data; and Overall Success Rate (OSR), which is the proportion of all the data correctly classified among all the data. As previously explained in Section III, our IDS exploits a SW scheme to compute the BPA values. We have empirically set the SW length to 50 slots. The experimental results are
presented in the form of bar charts, in Figs. 8-10. The dataset has been analysed for all the possible combinations of metrics. The Y-axis of the graphs represents the results in percentage, while the X-axis of the graphs represents the index of the used metrics. Each index corresponds to one possible combination of metrics, with #1 being a single metric set and #15 the set that combines all the considered metrics. Therefore, the overall best results are to be expected from the set index #15. The indexes of all the possible combinations of metrics are presented in Table II.
TABLE II. INDEX OF THE COMBINATION OF METRICS
1 – DST 6 – THR-DST 11 – THR-SRC-DST 2 – SRC 7 – THR-SRC 12 – CON-SRC-DST 3 – THR 8 – COM-DST 13 – COM-THR-DST 4 – COM 9 – COM-SRC 14 – COM-THR-SRC 5 – SRC-DST 10 – COM-THR 15 – COM-THR-SRC-DST
In the literature, the most frequently used performance metrics to evaluate the effectiveness of the IDSs are the DR and the FPr. The DR results of the IDS with and without the use of an FCM are compared in Fig. 8. As we can see, with regards to the DR, there is no evident difference between the two methods, using similar combination of metrics. Although, the DR is always higher when the contextual information is taken into consideration, the difference between the two methods is only ~2%. On top of that, the DR decreases as the number of fused metrics increases, which is in contrast to what is expected from cross-layer IDSs. In our experiments, this phenomenon is caused by the automatic BPA methodology and the way the SW slides. When multiple metrics are used, the reference of normality in the BPA methodology becomes larger over time. Hence, the IDS becomes less sensitive and more malicious instances are misclassified as non-malicious. Nonetheless, as the OSR results will show, this phenomenon also leads to an increase in the number of non-malicious instances correctly classified.
Fig. 8. Detection Rate results comparison between the methodologies: FCM in conjunction with IDS, and the IDS without FCM.
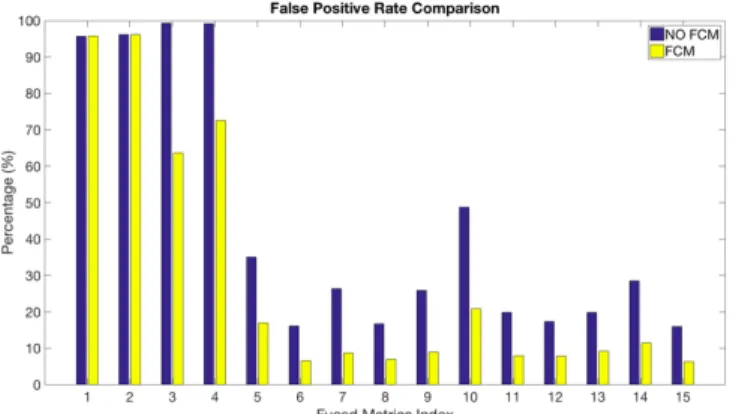
The FPr results of our IDS with and without the use of an FCM are compared in Fig. 9. In contrast to the DR results, we can see that the use of FCM actually outperforms the FPr results produced by the IDS alone. For instance, for the set #3 (THR), the difference between the two methods is over 35%. The largest difference for all the sets that combine two metrics is obtained in #10 (COM-THR), where the difference is 27.82%. Among the sets that combine three metrics, the largest FPr difference is obtained in #14 (COM-THR-SRC), where the difference is
17.15%. When all the metrics are combined, the difference between the two methods is over 9.68%. This clear improvement is constant for all the combinations of metrics. Also, the set of metrics #15 is the one that produces the best FPr (i.e. the lowest FPr) results, only 6.33%. In addition, the FPr decreases as the number of fused metrics increases. This behaviour is similar to the case of DR, where the DR decreases as the number of fused metrics increases. Ideally, we would prefer to see decrease in the FPr and an increase in the DR, at the same time. However, this is not the case. This behaviour can be associated with the tradeoff in network intrusion detection described in [22]. The authors explain that there exists a tradeoff between the reduction of the FPs by decreasing the sensitivity of the IDS and the increase of the number of malicious instances misclassified.
Fig. 9. False Positive Rate results comparison between two methodologies: FCM in conjunction with IDS, and the IDS without FCM.
The final performance metric that we have used is the OSR. This is a metric that has been commonly overlooked in the literature. In contrast to the DR that is only based on the malicious content of the analysed data, the OSR represents all the instances that have been correctly classified, regardless of whether these are malicious or not. Therefore, the OSR provides a more representative understanding of the efficiency of the IDS.
Fig. 10.Overall Success Rate results comparison between two methodologies: FCM in conjunction with IDS, and the IDS without FCM.
Figure 10 presents the OSR results comparison between the two methodologies. Similar to the case of FPr, the use of FCM in conjunction with IDS outperforms the OSR results produced by the IDS without FCM. For the set #3 (THR) the improvement in the OSR between the two methods is 35.64%. The largest improvement in all the sets that combine two metrics is obtained in #10 (COM-THR), where the difference between the two
methods is 27.38%. Among the sets that combine three metrics, the largest OSR improvement is obtained in #14 (COM-THR-SRC), where the difference is 17.15%. And finally, when all the metrics are combined, the difference between the two methods is over 9.68% of improvement. This improvement is constant for all the combinations of metrics, and shows once more that the use of contextual information improves the detection capabilities of our anomaly-based IDS. Again, the set of metrics #15 is the one that produces the best OSR (i.e. the highest OSR) results, 93.19%. These results show that, although less malicious instances are correctly classified, more non-malicious instances are correctly classified as more metrics are combined.
VII.CONCLUSIONS AND FUTURE WORK
In this paper we advocate incorporating high-level information regarding the monitored network, in the form of PoL, when taking decisions on whether an attack is present in the network traffic. The methodology is based on the use of an FCM in conjunction with our IDS.
The analysed dataset was gathered from a real LAN in a research office environment. During 9 days, network traffic was gathered, which comprises non-malicious traffic and traces of port scanning attacks. Different profiles of the attack have been implemented throughout the experiments, which manifest themselves differently in the network as the intensity of the attacks varies from one another. The fact that we have combined different profiles of the attack makes the detection process challenging. The intensive scan profiles standout from the normal traffic and are easily differentiable, whereas the stealth scan profile is not clearly distinguishable from the normal traffic. This causes a large number of misclassifications during the detection process.
From the presented DR results, we could argue that the IDS or the selected network metrics are not effective in detecting port scanning attacks. By using all the considered metrics, the IDS reaches just under 20% of DR. Also, the proposed methodology provides an improvement to the DR results of only ~2%. Nonetheless, we ought to consider also the FPr and, more importantly, the OSR. The OSR represents the total number of instances correctly classified, providing a more representative understanding of the efficiency of the IDS. With regards to these two performance metrics, it is evident that the use of contextual information constantly improves the detection capabilities of our IDS, for all the possible combinations of metrics. The proposed methodology is able to produce only 6.33% of FPr, and up to 93.19% of OSR, in the best-case scenario. These results empirically confirm that the use of FCM improves the detection capabilities of the IDS, which is the main objective of this work. As for future work, a possible integration of the Service Level Agreement and Quality of Service policies could assist in enhancing the expert understanding of the expected network behaviour under various contexts and situation conditions. Also, we wish to implement a novel, seamless mechanism to extract the available high-level information used to construct the FCM, or to refine the leverage of the different thresholds that characterise the various concepts in the FCM model.
REFERENCES
[1] A. Sadighian, S. T. Zargar, J. M. Fernandez, and A. Lemay, “Semantic-based context-aware alert fusion for distributed Intrusion Detection
Systems,” in Proc. of the International Conference on Risks and Security of Internet and Systems (CRiSIS), 2013, pp. 1–6.
[2] F. J. Aparicio-Navarro, K. G. Kyriakopoulos, D. J. Parish, and J. A. Chambers, “Adding contextual information to intrusion detection systems using Fuzzy Cognitive Maps,” in Proc. of IEEE International Multi-Disciplinary Conference on Cognitive Methods in Situation Awareness and Decision Support (CogSIMA), 2016, pp. 187–193.
[3] R. Craddock, D. Watson, and W. Saunders, “Generic Pattern of Life and behaviour analysis,” in Proc. of the IEEE International Multi-Disciplinary Conference on Cognitive Methods in Situation Awareness and Decision Support (CogSIMA), 2016, pp. 152–158.
[4] C. D. Stylios, and P. P. Groumpos, “Modeling complex systems using fuzzy cognitive maps,” in IEEE Transactions on Systems, Man and Cybernetics: Systems and Humans, vol. 34, no. 1, 2004, pp. 155–162. [5] L. Snidaro, J. García, and J. Llinas, “Context-based information fusion: A
survey and discussion,” in Information Fusion, 25, 2015, pp. 16–31. [6] D. Gupta, P. S. Joshi, A. K. Bhattacharjee, and R. S. Mundada, “IDS alerts
classification using knowledge-based evaluation,” in Proc. of the Fourth International Conference on Communication Systems and Networks (COMSNETS), 2012, pp. 1–8.
[7] T. D. Ndousse, and T. Okuda, “Computational intelligence for distributed fault management in networks using fuzzy cognitive maps,” in Proc. of the IEEE International Conference onCommunications (ICC), vol. 3, 1996, pp. 1558–1562.
[8] R. E. T. Jones, E. S. Connors, M. E. Mossey, J. R. Hyatt, N. J. Hansen, and M. R. Endsley, “Modeling situation awareness for army infantry platoon leaders using fuzzy cognitive mapping techniques,” in Proc. of the Behavior Representation in Modeling and Simulation Conference (BRiMS), 2010, pp. 216–223.
[9] M. M. Kokar, and M. R. Endsley, “Situation awareness and cognitive modeling,” in IEEE Intelligent Systems, vol. 3, 2012, pp. 91–96. [10] W. P. Cheah, Y. S. Kim, K.-Y. Kim, and H.-J. Yang, “Systematic causal
knowledge acquisition using FCM constructor for product design decision support,” in Expert Systems with Applications, vol. 38, no. 12, 2011, pp. 15316–15331.
[11] S. Limon, O.P. Yadav, and B. Nepal, “Modeling cognitive network of a physical system using design knowledge base,” in Proc. of the IEEE International Conference on Industrial Engineering and Engineering Management (IEEM), 2014, pp. 238–242.
[12] M. Jazzar, and A. Jantan, “Towards real-time intrusion detection using fuzzy cognitive maps modeling and simulation,” in Proc. of the Int. Symposium on Information Technology (ITSim), vol. 2, 2008, pp. 1–6. [13] G. Thamilarasu, S. Mishra, and R. Sridhar, “A cross-layer approach to
detect jamming attacks in wireless ad hoc networks,” in Proc. of the IEEE Military Communications Conference (MILCOM), 2006, pp. 1–7. [14] X. Wang, J. S. Wong, F. Stanley, and S. Basu, “Cross-layer based
anomaly detection in wireless mesh networks,” in Proc. of the 9th Int. Symposium on Applications and the Internet (SAINT), 2009, pp. 9–15. [15] K. G. Kyriakopoulos, F. J. Aparicio-Navarro, and D. J. Parish, “Manual
and automatic assigned thresholds in multi-layer data fusion intrusion detection system for 802.11 attacks,” in IET Information Security, vol. 8, no. 1, 2014, pp. 42–50.
[16] D. Miller, “Softflowd-traffic flow monitoring,” Available: http://manpa ges.ubuntu.com/manpages/raring/man8/softflowd.8.html (Access date: 10 Mar, 2016).
[17] Nfcapd, “Netflow capture daemon” Available: http://manpages.ubuntu .com/manpages/hardy/man1/nfcapd.1.html (Access date: 10 Mar, 2016). [18] G. Lyon, “Nmap: The network mapper – Free security scanner,”
Available: http://nmap.org/ (Access Date: 21 Jun, 2016).
[19] R. Christopher, “Port scanning techniques and the defense against them,” SANS Institute, 2002, pp. 1–6.
[20] E. Bou-Harb, M. Debbabi, and C. Assi, “Cyber scanning: A comprehensive survey,” in IEEECommunications Surveys & Tutorials, vol.16, no.3, 2014, pp. 1496–1519.
[21] V. Jacobson, C. Leres, and S. McCanne, “Tcpdump/libpcap”, 1987. Available: http://www.tcpdump.org (Access date: 23 Jun, 2016). [22] T. Alpcan, and T. Başar, “Network security: A decision and

![Fig. 2. Merged [14×14] adjacency matrix of the FCM composed using the number of network users, the time of the day and the usage of the network](https://thumb-us.123doks.com/thumbv2/123dok_us/9018931.2799718/4.892.504.792.370.558/merged-adjacency-matrix-composed-using-number-network-network.webp)