University of Southern Queensland Faculty of Heath, Engineering and Sciences
The Effect of Road Roughness on Traffic Speed and
Road Safety
A dissertation submitted by Miss Bernie-Anne King
In fulfilment of the requirements of Bachelor of Civil Engineering
1
Abstract
Road Safety is one of the most important issues for traffic authorities, as they attempt to reduce the frequency and severity of road crashes. This dissertation investigates the effect of Road Roughness on traffic speed and road safety in Southern Queensland, Australia. This research is important as it investigates the pavement variable of roughness, and considers its contribution to vehicle speed and crash rates. Using data collected by the Queensland Department of Transport and Main Roads, models were formed to depict the relationships between roughness, speed, crash rate and other road parameters. The model focused on a sample of roads in the ‘Downs South West’ region.
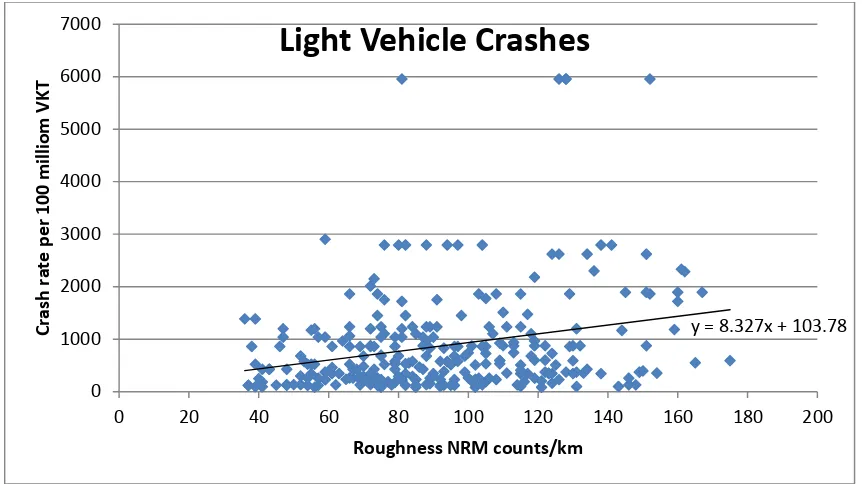
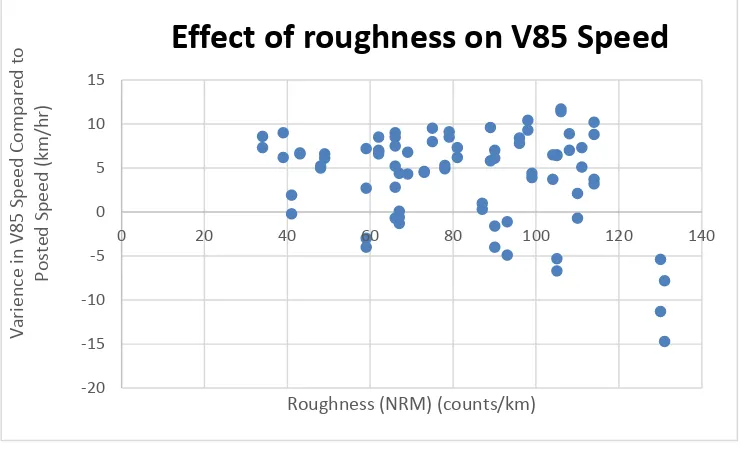
The models collectively indicated a strong relationship between higher crash rates and increased pavement roughness. Road segments with a crash history have a higher average roughness than non-crash segments. Crash rates involving light vehicles were more affected by increasing roughness than crashes involving heavy freight vehicles. When considering the five crash severity types, crashes resulting in hospitalisations and property damage had the strongest increase in crashes over a small increase in roughness. Regarding driver speed, there is 100% driver compliance on segments with roughness over 120counts/km NRM, with the 85th percentile speed ranging from 5-15km/hr below the posted speed. The models presented similar conclusions to Australian and International research, but produce slightly different results from the two similar published investigations. Crash rates showed a steadily increasing linear relationship with increasing roughness and are slightly higher than Swedish results, however are well below the critical crash rate as specified in the MUTCD. This suggests that Queensland’s road safety procedures are being implemented effectively.
2
University of Southern Queensland
Faculty of Health, Engineering and Sciences
ENG4111/ENG4112 Research Project
Limitations of Use
The Council of the University of Southern Queensland, its Faculty of Health, Engineering & Sciences, and the staff of the University of Southern Queensland, do not accept any responsibility for the truth, accuracy or completeness of material contained within or associated with this dissertation.
Persons using all or any part of this material do so at their own risk, and not at the risk of the Council of the University of Southern Queensland, its Faculty of Health, Engineering & Sciences or the staff of the University of Southern Queensland.
3
Candidates Certification
I certify that the ideas and experiential work, results, analysis and conclusions set out in this dissertation are entirely my own effort, except where otherwise indicated and acknowledged.
I further certify that the work is original and has not been previously submitted for assessment in any other course or institution, except where specifically stated.
Bernie-Anne King
Student Number: U1016950
____________________ Signature
4
Acknowledgements
I would like to acknowledge the assistance and contribution of all that have aided the development of this dissertation.
5
Table of Contents
Abstract ... 1
Limitations of Use ... 2
Candidates Certification ... 3
Acknowledgements ... 4
Table of Contents ... 5
List of Figures ... 8
List of Tables... 10
List of Appendices ... 11
List of Abbreviations... 12
Chapter 1: Introduction ... 13
1.1 Introduction ... 13
1.2 The Problem ... 15
1.3 Downs South West Region Network ... 16
1.4 Research Objectives ... 18
Chapter 2: Literature Review – Pavement Roughness ... 20
2.1 Introduction ... 20
2.2 Roughness ... 21
2.2.1 International Roughness Index (IRI) ... 27
2.2.2 Smooth Travel Exposure (STE) and Methods of Analysis... 33
2.2.3 Relationship between Roughness and Safety ... 34
2.2.4 Relationship between Roughness and Speed ... 38
2.2.5 Driver perception of roughness... 40
2.3 Speed Parameters and Compliance ... 41
2.3.1 Speed Compliance ... 41
2.3.2 Treatment of Roughness ... 42
2.3.3 Effect of Crash History on speed ... 42
2.4 Road Safety ... 44
2.4.1 Crash Costs ... 44
2.4.2 Improving Road Safety ... 45
2.4.3 Road Safety Incentives ... 48
6
3.1 Methodology Approach and Data ... 50
3.1.1 Roughness Data ... 51
3.1.2 Speed Data ... 51
3.1.3 Crash Data ... 51
3.1.4 Other Data Required ... 52
3.2 Roughness Data Analysis ... 53
3.3 Road Selection ... 53
3.4 Analysing Crash Data ... 55
3.4.1 Method A: Using MUTCD approach ... 55
3.4.2 Method B: Using U.S. Department of Transport approach (100 million) ... 57
3.4.3 Method C: Using U.S. Department of Transport approach (million) ... 57
3.4.4 Crash Investigations: Crash Segments vs. Non-crash segments ... 58
3.4.5 Comparison of Crash Data... 58
3.4.6 Crash Investigations: Light vehicles and Heavy Vehicles ... 59
3.5 Analysing Speed Data ... 60
3.6 Case study Analysis... 61
3.6.1 On-Site Analysis ... 61
3.7 Financial Modelling ... 61
3.8 Correlation ... 62
3.9 Summary ... 62
Chapter 4: Roughness Models ... 63
4.1 Roughness Analysis ... 63
4.2 Road Analysis... 65
4.3 Roughness and Crash History ... 66
4.3.1 Crash Segments vs. Non-crash Segments ... 66
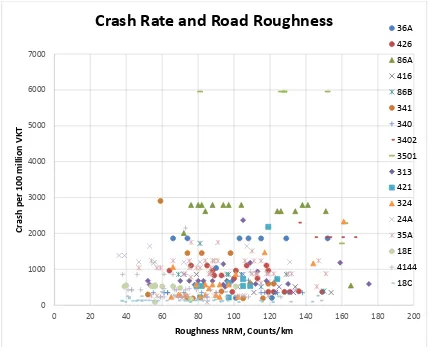
4.3.2 Crash Investigations (per roadway) ... 68
4.3.3 Crash Investigations (per 100m and 1km) ... 73
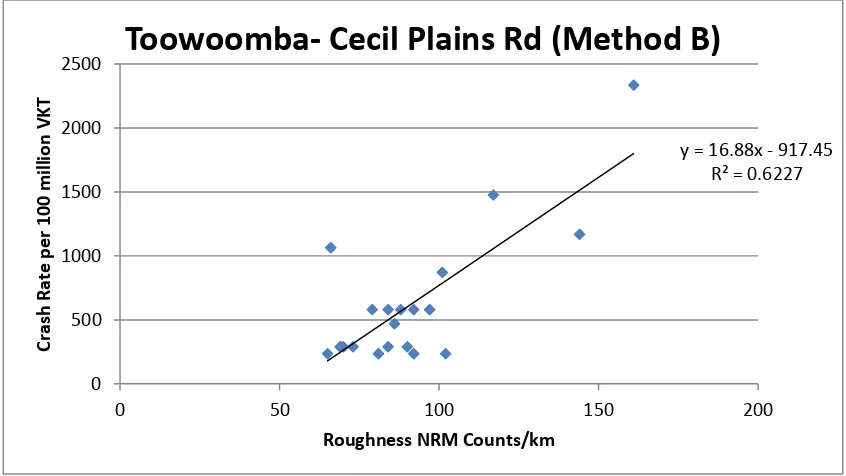
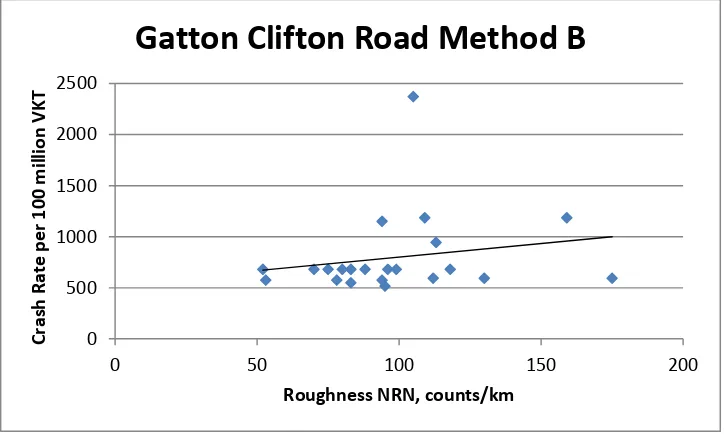
4.3.4 Individual Road Investigations ... 76
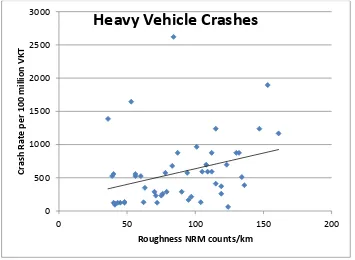
4.3.5 Crash Investigations: Light vehicles and Heavy Vehicles ... 78
4.3.6 Crash Rate Comparison ... 79
4.3.7 Summary ... 79
4.4 Roughness and Speed ... 80
4.4.1 Locations with roughness higher than 120counts/km ... 82
7
Chapter 5: Roughness Case Studies and Financial Model ... 85
5.1 Case Studies ... 85
5.1.1 Dalby Kogan Road... 85
5.1.2 Moonie Highway (35A) ... 88
5.1.3 Warrego Highway (Dalby to Miles) ... 90
5.1.4 Gatton-Clifton Road, 313 ... 92
5.1.5 Surat Developmental Road (Surat - Tara), 86A ... 94
5.2 Effect of Mining Vehicles on Crash Rates and Speed Data ... 96
5.2.1 Daily Speed Data on the Dalby Kogan Rd ... 97
5.3 Cost Comparison Analysis ... 98
5.3.1 Improving Roughness on Queensland Roads ... 98
5.3.2: Site Examples ... 101
Chapter 6: Result Analysis ... 103
6.1 Assumptions and Limitations ... 103
6.2 Results Analysis ... 105
Chapter 7: Conclusion ... 109
7.1 Overall Conclusions ... 109
7.2 Recommendations ... 111
7.4 Further Research ... 113
Chapter 8: List of References ... 114
Chapter 9: Appendices ... 119
Appendix A – Project Specification ... 119
Appendix B – IRI to NRM ... 121
Appendix C – Analysis of Crash Data Tables ... 122
Appendix D – Results from Crash Study ... 123
Appendix E– Speed Compliance on Dalby Kogan RD ... 127
Appendix F – AADT on Downs South West Roads ... 135
Appendix G – Comparison Crash Rate ... 142
8
List of Figures
Figure 1: A typical road (Warrego Highway, 18E) (QDTMR 2014a) ... 16 Figure 2: Map of the Downs South West Region (Queensland Government 2013a, p.2) ... 17 Figure 3: Rough Road Surface (California Department of Transportation 2014) ... 20 Figure 4: Influential factors on Pavement Quality (Hunt 2002, p.13) ... 22 Figure 5: Percentage increase in operation costs dependant on roughness (Al-Rousan, T & Asi, I 2010, p.3) ... 26 Figure 6: IRI roughness on different roads (Al-Rousan, T & Asi, I 2010, p.5) ... 28 Figure 7: The Quarter Car Model (American Concrete Pavement Association 2002) ... 30 Figure 8: A Simulation of IRI quarter-car model (Austroads 2007 p.39) ... 31 Figure 9: Effect of IRI on accident rates (Ihs 2004, p.3). ... 34 Figure 10: Victorian study on the correlation between roughness and crashes (Bennett, P & Cairney, P 2008, p.5). ... 36 Figure 11: Roughness Study on Rural Victoria Roads (Cairney, P, Bennett 2013, p.41) ... 37 Figure 12: Relationship between IRI and speed (Ihs 2004 p.4) ... 38 Figure 13: Relationship between Surface roughness and free flow speed (Chandra 2004, p.361). ... 39 Figure 14: Effect of roughness on capacity on two lane rural roads (Chandra 2004, p.364) ... 39 Figure 15: Perception of IRI (Ihs 2004 p.9) ... 40 Figure 16: 2014 Crash Costs (QDTMR 2014c) ... 44 Figure 17: Relative Crash Rate with total seal width (Queensland Government 2013b, p.30) ... 46 Figure 18: Safety Initiatives implemented in Western Australia (Government of
Western Australia 2014) ... 48 Figure 19: Effect of Safety Initiatives in Queensland on crash rate (1981 to 2012) (Queensland Government 2014f) ... 49 Figure 20: CAMs around a Horizontal Curve (QDTMR 2014a). ... 60 Figure 21: A Box and Whisker plot of the Roughness in Queensland’s Downs South West Region. ... 63 Figure 22: Relationship between crash zones and non-crash zones compared to
9
Figure 29: Property Damage crash rate per million VKT and Roughness along each road
... 72
Figure 30: Model of Crash rate and roughness ... 74
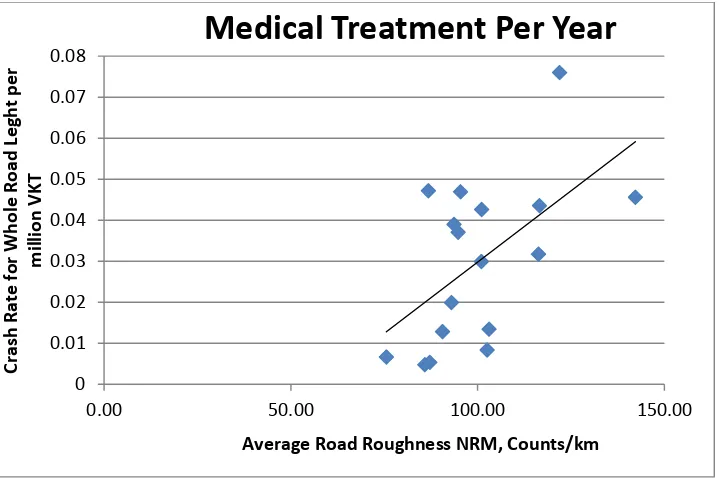
Figure 31: Correlation between medical treatment crashes and roughness (using Method A) ... 75
Figure 32: Crash rate on Toowoomba Cecil Plains Rd, using Method A ... 76
Figure 33: Crash Rate on Toowoomba-Cecil Plains Road, using Method B... 76
Figure 34: Crash Rate on the Gatton Clifton Road using Method B ... 77
Figure 35: Crash Rate of incidents with Heavy Freight Vehicles. ... 78
Figure 36: Crash rate for light vehicles ... 79
Figure 37: Relationship between Roughness and Speed Compliance ... 80
Figure 38: Dalby-Kogan road, taken on-site (King 2014). ... 86
Figure 39: Roughness on Dalby Kogan Rd (Sourced from Chartview, QDTMR 2014b) ... 86
Figure 40: Moonie highway crash history (past 5 years) and roughness data (Sourced from Chartview, QDTMR 2014b)... 89
Figure 41: Warrego Highway between Dalby and Chinchilla (King 2014) ... 90
Figure 42: Pavement roughness on Warrego Highway between Dalby and Miles (Sourced from Chartview, QDTMR 2014b) ... 91
Figure 43: Roughness on Gatton Clifton Road (Sourced from Chartview, QDTMR 2014b) ... 93
Figure 44: Surat Developmental Road (King 2014) ... 94
Figure 45: Roughness on the Surat Developmental Road (Sourced from Chartview, QDTMR 2014b) ... 95
Figure 46: Mining Basins in the Downs South West Region (Cox 2014) ... 96
Figure 47: Asphalt Overlay with Fabric seal (Bygness et.al. 2006) ... 100
Figure 48: Crash rate of Property Damage using Method A ... 123
Figure 49: Crash rate of Minor Injury using Method A ... 123
Figure 50: Crash rate of Medical Treatment using Method A ... 124
Figure 51: Crash rate of Hospitalisations using Method A ... 124
Figure 52: Crash rate of Fatalities using Method A ... 124
Figure 53: Crash Rate for Property Damage using Method B ... 125
Figure 54: Crash Rate for Minor Injury using Method B ... 125
Figure 55: Crash Rate for Medical Treatment using Method B... 125
Figure 56: Crash Rate for Hospitalisations using Method B ... 126
Figure 57: Crash Rate for Fatalities using Method B ... 126
Figure 58: Crash rate and roughness using Method A in 1km segment lengths. ... 143
Figure 59: Crash rate and roughness using Method A in 100m segment lengths. ... 144
10
List of Tables
Table 1: Measurements of Roughness in the Australasia Region (Austroads 2007 p.37)
... 24
Table 2: Ranges of IRI’s (Al-Rousan & Asi, 2010, p.8) (Based on 80km/hr) ... 28
Table 3: Maximum IRI levels for new and existing roads (Austroads 2007, p.18) ... 28
Table 4: Queensland’s 20 year vision for roughness (Queensland Government 2010, p.7) ... 30
Table 5: Methods to collect roughness data (Pavement Interactive 2007) ... 32
Table 6: Suggested IRI limits for speed enforcement (Chou, Yau & Yu 2006, p.2) ... 40
Table 7: Roads used for analysis ... 65
Table 8: Frequency of Crash Type and Total crash costs. ... 69
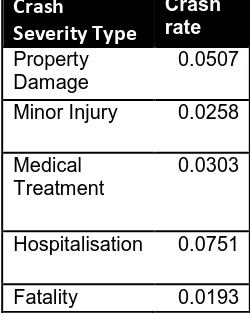
Table 9: Crash Rates (per million VKT) at a roughness of 100 NRM ... 72
Table 10: Correlation of data to linear regression line- R2 values ... 73
Table 11: Minimum Speed Zone Lengths (Queensland Government 2014a, p.20) ... 83
Table 12: Roughness at Speed Data Location ... 97
Table 13: Types of Pavement Treatment to improve Roughness ... 99
Table 14: Treatment costs for 10km of repairs ... 101
Table 15: Conversion Table between IRI and NRM roughness values (Austroads 2007, p.38) ... 121
Table 16: DCA crash risk scores (Queensland Government 2014a, p52). ... 122
11
List of Appendices
Appendix A: Project Specification Appendix B: IRI to NRM
Appendix C: Analysis of Crash Data Tables Appendix D: Results from Crash Study
Appendix E: Speed Compliance on Dalby Kogan Rd Appendix F: AADT on Downs South West Roads Appendix G: Comparison Crash rate
12
List of Abbreviations
AADT - Annual Average Daily Traffic
ARMIS - A road management information system ARRB – Australian Road Research Board
ATLM - Audio Tactile Line Marking CAMs – Chevron Alignment Markers Ch. - Chainage
CHR – Channelised Right Turn Treatment DCA - Definitions for Coding Accidents
DTMR – Department of Transport and Main Roads DVR – Digital Video Road
HV - Heavy Vehicles
IRI – International Roughness Index LCS – Limiting Curve Speed
MUTCD – Manual of Uniform Traffic Devices
NAASRA – National Association of Australia State Road Authorities NRM- NAASRA Roughness meter
RPDM – Road Planning and Design Manual RPM – Raised Pavement Markers
STE- Smooth Travel Exposure
TARS- Traffic Analysis and Reporting System V85 – 85th percentile speed
Vpd- Vehicles per day
13
Chapter 1: Introduction
1.1 Introduction
Every day drivers, pedestrians and cyclists are faced with the hazards of the road network. As a society, we must work to limit the risks that the transportation industry and the community encounter when making their way to work, school or to visit friends and family. Transport authorities are working with communities, to provide a safer travel network, through road, rail and water safety. In Australia, vehicle travel on roads is the most popular form of transportation. Road safety is governed by three aspects: the road, the driving environment and the driver. While it is difficult to control specific conditions (e.g. weather), transport authorities can influence road and driver safety, and how each interacts with the conditions. Driver safety is targeted through licencing laws, road rules, vehicle safety improvements and driver campaigns. Road safety includes having a combination of safe road parameters including the geometry, sight distance, seal width, overtaking opportunities, pavement quality and surface conditions etc. It is in the public’s interest forTransport authorities to improve the conditions of the road network to ensure a high safety standard is provided to the community.
One such component of the road network is the road surface conditions. The defects and deterioration of the pavement decreases the road safety for drivers. Road roughness is a method to quantify this deterioration of the pavement. Roughness is the most widely used pavement condition indicator, as it is affordable data to capture, it reflects road user’s costs and is widely accepted as the most relevant measure of pavement behaviour (Hunt 2002, p.9). However, investigating the road network parameters (e.g. pavement) is not enough, research into the way that this parameter interacts with drivers and the environment is very important. In Australia, driver’s behaviour is governed by the road rules. One of the most frequently enforced rules is the speed limit, due to the distinct relationship between travel speed and crash frequency and severity. This dissertation investigates the effect that pavement roughness has on driver behaviour, particularly speed and other safety factors.
14
15
1.2 The Problem
In 2013 the Queensland Government Department of Transport and Main Roads (DTMR) commenced a state wide review of the speed limits of a hundred roads throughout the state. This review was based on public survey, crash statistics and local knowledge (Queensland Government 2014b). The current speed limits for these roads were reviewed in accordance with the Manual of Uniform Traffic Devices (MUTCD), in particular part 4 which covers speed controls. Due to the widespread reviews on speed limits of the state’s road network, the MUTCD part 4 was also reviewed. This highlighted a range of topics which required further research or discussion. One topic which was raised by the review and by regional DTMR engineers was the effect of surface roughness upon the review of speed limits. The MUTCD only provides roughness limits for a 110km/hr design speed, and the question was raised if these limits were suitable on lower speed environments. The review highlighted that at a point, the pavement deterioration would require a reduced speed limit (usually temporary, pending pavement repairs). This research aims to investigate this correlation between increased road roughness and speed limits. The effect this has on road safety is also investigated.
16
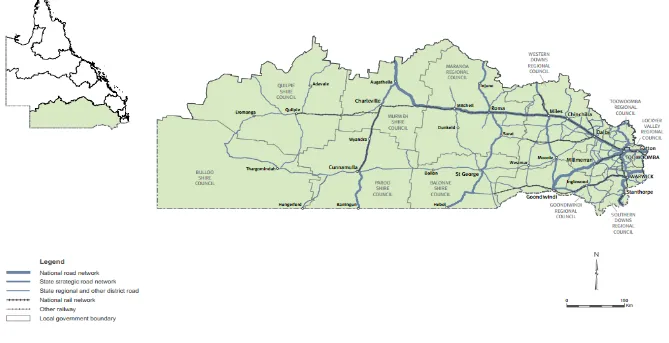
1.3 Downs South West Region Network
The Downs South West region is an administrative area defined by the Department of Transport and Main Roads. It is situated in the southern end of Queensland, Australia. Figure 2 is a map of the region, which highlights the national and state road network. This region covers 399,515km2 which is approximately 23% of Queensland (Queensland Government 2013a, p.3).
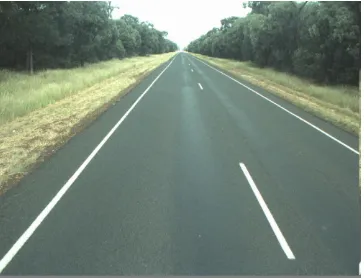
[image:17.595.59.423.323.601.2]In the Downs South West region, a typical road is a single carriageway with 2 x 3.5m lanes and shoulders of approximately 1m. The clearzone is usually grassed, and trees and services are usually also located within the road reserve, as seen in Figure 1 below, on the Warrego Highway.
17
18
1.4 Research Objectives
The following is the defined scope of this investigation into the effect of road roughness on traffic speed and safety:
1. Research the topic of pavement roughness. This includes recording roughness, the parameters which effect roughness and the relationship of roughness between crash rate and speed.
2. Investigate the factors which influence speeds and road safety. Research the current methods in which roughness is treated by speed reviews, the relationship between speeding and crash rate, and the treatments used to improve road safety.
3. Attain traffic speed, pavement roughness and crash data on all declared roads in South-East Queensland. Ten to twenty appropriate roads will be selected for modelling (DTMR data).
4. From the crash history, calculate the crash rate. Investigate the roughness on the roads selected in relation to the crash rate and speed data. When investigating crash data consider heavy vehicles effect and investigate crash data by crash severity type.
5. Complete a case study analysis on roads of interest, and investigate the effect of external factors. Utilise site visits to accurately assess current road conditions.
6. Determine a roughness level where the operating speed is impacted. Analyse the effects of reducing/ changing posted speeds and methods of improving safety where high crash rates occur.
7. Produce results and evaluate all findings, and present these in a graphical or tabular format (as appropriate).
19
20
Chapter 2: Literature Review – Pavement Roughness
2.1 Introduction
Through investigating both Australian and international sources, the literature review highlights pavement roughness, vehicle speed and road safety, and how each of these parameters are interrelated. Section 2.2 highlights pavement roughness definitions, causes and effects, and the current studies between roughness in speed and safety. The different types of speed are defined in section 2.3, along with the factors which may cause speeds to change. Methods to improve road safety and the current costs of crashes to society are also defined in section 2.4. These sections define the parameters used in this research and provide background to the models within this dissertation
21
2.2 Roughness
Austroads (an organisation of Australian and New Zealand road transport and traffic authority) defines roughness as the deviations or irregularities from the intended longitudinal profile (true planar surface) of the pavement surface (Austroads 2007). This definition is widely accepted and mirrors the definitions used by other road authorities around the globe. Roughness measures surface irregularities with wavelengths between 0.5m and 50m in the longitudinal profile. Roughness is measured by recording the movement in the rear axle relative to the sprung mass (vehicle mass supported by suspension) during travel at a constant speed.
Figure 4 highlights the factors which effect roughness in unbound granular pavements. It highlights the complexity of pavement roughness. It is evident that the range of variables effecting roughness include (Hunt 2002):
- Pavement type and structure (including age) - Seal age
- Resurfacing and routine maintenance
- Quality and strength of the Base, Subbase and Subgrade - Location of the Water table
- Drainage
- Environmental impacts such as rain, both during construction and throughout the life of the pavement, weather and temperature.
- Quality of the gravel, particularly strength, source of rock, depth and permeability. - Nature of the soil i.e. reactive/non-reactive soils
- Current and predicted traffic volumes and loadings.
22
23
Roughness is used in conjunction with the terms ‘ride comfort,’ ‘ride-ability,’ ‘smoothness,’ and ‘evenness’ (Austroads 2007). Roughness is perceived by most traffic authorities as the best indication of ride-quality of the road network. There are many ways to quantify roughness. Austroads endorses the International Roughness Index (IRI) as the reporting unit for Australasia. IRI is the most widely adopted standard, however it is not used in most of Europe and parts of the United States (Austroads 2007).
Some other quantities of roughness include (Al-Rousan, T & Asi, I 2010, p.1):
- Present Serviceability Rating (PSR)
- Present Serviceability index (PSI)
- Ride Number (RN)
- Riding Comfort Index (RCI): the Canadian version of the PSI, which ranges on a scale of 0 to 10 (Chandra 2004, p.360).
- NAASRA (National Association of Australia State Road Authorities) roughness meter counts (NRM) are being phased out (as NAASRA preceded Austroads as Australia’s national road authority), however it is still used by some Australian road authorities. This method of quantifying roughness has high correlation with IRI results, and is therefore easily comparable (Austroads 2007).
Austroads highlights the measures of roughness that are used in the Australasia region in Table 1. The IRI averaging method using profile-based profilometers are the Austroads supported method for measuring roughness. Other methods include the NAASRA roughness counts (NRM) which were an older method of determining roughness, and other profile-based methods.
24
25
Physical Characteristics
A range of surface defects contribute to pavement roughness. In flexible pavements (granular materials with bituminous surface), roughness is increased by a combination of localised depressions, ruts, potholes, patches, corrugations, shoving, delamination/ debonding, stripping, cracking or unevenness from the installation of services. In rigid pavements (those which contain Portland cement), roughness is higher in pavements which have stepping/faulting, rocking, pumping, spalling, patches, slab curling (temperature induced) or unevenness from the installation of services (Austroads 2007). Other factors which increase the roughness include localised factors such as intersections, roundabouts, railway crossings, bridge abutments etc. These defects are often caused by moisture penetrating the surface causing failure, lack of strength, unsuitable materials or the breakdown of the materials over time.
Cost of Roughness to society
26
vehicle depreciation, and pavement maintenance expenditure (Al-Rousan, T & Asi, I 2010, p.1).
Figure 5 highlights the greater operational costs which result from increased roughness. It can be seen for IRI 3 and higher, the vehicle operating costs increase. Between an IRI 3 and 5 there is an increase in operational cost of about 5% for cars and 10% for cars.
Figure 5: Percentage increase in operation costs dependant on roughness (Al-Rousan, T & Asi, I 2010, p.3)
In the USA, incentives or penalties are provided to contractors who provide a high level of smoothness. This both provides beneficial quality control, but may impact the structural integrity of the road. An IRI of 0.96 – 1.26m/km for new roads equates to no incentive or penalty. Lower IRI earn up to a 10% incentive (IRI <0.8m/km), and IRI’s higher than 1.89m/km require replacement (Mannering & Shafizadah 2002).
27
2.2.1 International Roughness Index (IRI)
The International Roughness Index (IRI) is a scale for roughness based on the simulated response of a generic vehicle to the pavement roughness in a single wheel path of the road surface (Al-Rousan, T & Asi, I 2010, p.5). Initiated by the World Bank in 1986, the IRI is a profile-based statistic which is used around the world as a cost-effective index for gathering and comparing pavement smoothness, based on the response of a typical motor vehicle (Chou et al. 2006). Typical IRI values range from 0 to 5m/km (317in/mil), with higher values used for rougher pavement surfaces (Mannering & Shafizadah 2002). This scale of roughness is adopted by the World Road Association (PIARC), Austroads (the road authority for Australia and New Zealand) and many other transportation authorities around the globe.
Roughness is usually measured in a car travelling at 80km/hr. Therefore, high roughness readings at roundabouts, small local streets, and low speed environments, may not be reflective of the perceived roughness, as the public are travelling less than 80km/hr (Austroads 2007). Road networks are usually surveyed in one direction only, and in the lane with the heaviest traffic as a minimum (usually the left lane). According to Austroads standards, heavily trafficked arterial roads should be surveyed each year, while low trafficked local roads only required surveying every 5 years (Austroads 2007).
Roughness Values
28
Figure 6: IRI roughness on different roads (Al-Rousan, T & Asi, I 2010, p.5)
Table 2: Ranges of IRI’s (Al-Rousan & Asi, 2010, p.8) (Based on 80km/hr)
.
Austroads highlights maximum desirable roughness values on new roads and indicative values to investigate pavement quality. On highways and main road with a 100km/hr posted speed limit, the maximum desirable IRI on new roads is 1.9. On existing highways (100km/hr) investigations should be carried out on roads with IRI’s over 5.3 or 4.2 for sections greater than 500m. This is evident in Table 3.
29
When measuring roughness of a road segment, the longitudinal profile is initially measured and then a mathematical model of the response of a hypothetical vehicle is generated, using a profilometer and the quarter-car stimulation (Austroads 2007). Austroads states that roughness should be reported as Lane IRIqc (usually IRI (m/km), which represents the roughness of a traffic lane within a section of road using the quarter-car model. This is determined by averaging two individual single wheel path IRIqc values. The half car model is not used. However, ARRB (Australian Road Research Board) found that the quarter-car model (IRI averaging model) provides a slightly worse correlation between IRI and NRM data, than the half- car model (profile averaging), which is more complex.
The IRI is recorded for each 100m segment and lane roughness is recorded to not more than 2 decimal places. Decisions based on roughness, should be based on roughness to not more than one decimal place (Austroads 2007). This is an appropriate level of accuracy given the test procedures. Locations of significant road features (bridges, intersections etc.) are included in roughness results, with the lane surveyed, the direction and speed of the travel and the date and weather conditions. This data may be used to explain unusual IRI values. External factors such as road works, congestion, wet areas, water over road, or obstacles on road, may make the results invalid (Austroads 2007). Inconsistencies with IRI results are caused by bias, random error and/or calibration issues between testing devices. Bias occurs due the profiler’s characteristics in measuring the pavement surface (American Concrete Pavement Association 2002).
The quarter-car model (Austroads approved) uses the following equation to calculate IRI: Lane IRIqc = Single wheel path IRIqc (inner) + Single wheel path IRIqc (outer)
2
Compared with the formula for NAASRA roughness meter (an older reporting unit) for ride quality:
NAASRA roughness (counts/km) = 26.49 x IRIqc (m/km) – 1.27 (Austroads 2007, p.8)
30
NAASRA roughness is no longer considered an appropriate method to determine roughness; however it is still used by many road authorities. The Queensland DTMR still uses NRM as its main reporting unit.
The DTMR 20 year vision for roughness values highlights a relationship between roughness and AADT (Queensland Government 2010, p.7). The 5 year milestone (2015) is for 94% of roads to meet the following standards. Roughness should not be greater than the values highlights in table 4.
Table 4: Queensland’s 20 year vision for roughness (Queensland Government 2010, p.7)
AADT IRI NRM
0-200 6 160
201-500 6 160
501-1000 5 130
1001-10 000 4 110
>10 001 3.5 90
Quarter Car Model
Figure 7: The Quarter Car Model (American Concrete Pavement Association 2002)
31
model), the axle mass (supported by the tyre), the suspension spring and damper and the body mass (only that supported by the tire). Figure 8 shows another model of the IRIqc. The NAASRA roughness count is measured in counts/km, where 1 count is equivalent to 15.2mm of accumulated vehicle movement between the sprung and unsprung body mass (Hunt & Bunker, 2004 p.3).
Figure 8: A Simulation of IRI quarter-car model (Austroads 2007 p.39)
Measuring Roughness
There are a range of methods used to measure IRI. These include (Pavement Interactive 2007):
- Rod and Level Survey- unfeasible for large projects
- Dipstick Profiler- used for small quantities of data
- Profilographs- used on construction inspections, not feasible for network data collection.
- Response type road roughness meters (RTRRMs) - suitable for large scale network modelling as device installed onto a vehicle.
- Profiling Devices- Most popular device for roughness data collection and used of network scale collections.
32
Table 5: Methods to collect roughness data (Pavement Interactive 2007)
Profiling Devices
While they are fairly expensive and complex, profiling devices are the most accurate and scaled method of data collection of surface roughness. There are three main types including the straight edge, low speed systems and inertial reference systems (which uses a contact, or non-contact sensor system) (Pavement Interactive 2007).
33
2.2.2 Smooth Travel Exposure (STE) and Methods of Analysis
When analysing roughness, a statistical approach is adopted. Statistics methods such as maximum, minimum, median, inter-quartile range, mean and standard deviation can be used on the road segment, and can be investigated over time (Austroads 2007). Graphs such as histograms and cumulative distribution curves are suitable to represent the data (Austroads 2007).
An Austroads National Performance indicator used for roughness is the Smooth Travel Exposure (STE), which measures the ride quality of the road pavement by considering the traffic volumes. This is used for roads with IRI roughness less than or equal to 4.2 and 5.3m/km (or NRM readings of 110 and 140 counts/km), and is only used for sealed roads.
STE = 100 x Tnf/TvC
STE = 100 x the year’s travel measured in vehicle km travelled (VKT) on roads which meet the targeted condition / the year’s travel measured in VKTs for the entire network being reported.
Method of STE:
1. Determine length of network (km) which has av. Roughness < 4.2m/m and/or <5.3m/km.
2. Determine annual kilometres travelled = AADT x segment length x 365 3. Sum total annual km travelled on segments with Roughness < 4.2m/m, and
separately sum segments with roughness <5.3m/km.
4. Calculate STE4.2 = step 3/step 2, STE5.3 = step 3/step 2, for 4.2 and 5.3m/km respectively. (Austroads 2007)
34
2.2.3 Relationship between Roughness and Safety
Swedish research has found that while ruts have little effect on safety (may even slightly improve safety in some situations), that with increased IRI values there is a clear increase in accident rates (Ihs 2004, p.1). The increase of accident rates with increased IRI was greater in the winter months than in the summer (meets 5% significant level). Additionally, the accident ratio increased with IRI for all traffic flow classes, as seen in Figure 9 (Ihs 2004, p.3). This graph shows a linear regression of crash rate calculated per 100 million axle pair kilometres. The effect of roughness on accidents is the same on all accident types (property damage, minor injury, medical treatment, hospitalisation, fatality). However, an increased IRI had the greatest effect on single-vehicle accidents, compared to multi-vehicle accidents (Ihs 2004, p.4).
Figure 9: Effect of IRI on accident rates (Ihs 2004, p.3).
35
It is also found that the risk of aquaplaning accidents is greater when ruts depths are larger than 7.6mm. The risk further increases when this rut depth is combined with mild cross fall slopes (less than 1.8%) (Ihs 2004, p.9).
In a Swedish driver survey, it was found that road surface condition was considered the most important variable for satisfactory ride comfort, above visibility, road width, car characteristics, other drivers’ behaviour and amount of traffic (Ihs 2004, p.1).
At the Australian road safety research conference 2012, an investigation into the
benefits of road smoothing found a range of key findings including (Cenek P, Davies R & Jamieson 2012, p.1):
- Road roughness has an increased negative impact on the risk of crashes, as the horizontal curvature increases.
- 10m Wavelength profile variance is the best indicator of crash risk, closely followed by IRI.
- Braking distance increased with higher IRI for cars and light trucks for roads 50km/hr or higher.
- Roughness had the greatest impact around corners at the apex of the curve.
- Smoothing low volume rural roads is cost effective (for safety) when an existing injury crash density exceeds 0.5 reported injury crashes per year per km. for straights and 1.8 for moderate curves.
- Longer wavelengths in the longitudinal profile have a bigger influence on the ride quality of a truck than a car (Austroads 2007).
36
Australian Research
Research in rural roads in Victoria conducted by ARRB, found a high correlation between increased road roughness and the risk of crashes (Bennett and Cairney 2008, p.3). This study included 1,386km of road and a similar number of crashes (1,344 crashes). As seen in Figure 10, there is a definate increase in road crashes in segements with a roughness beyond 150 counts/km (Bennett and Cairney 2008, p.3). This graph yeilds the relationship:
Crash rate = 0.0049 (Roughness)2 – 0.4948 Where roughness is NRM in counts/km.
Further research is required to support these findings, as there are only a small percentage of high roughness data compared to the sample.
Figure 10: Victorian study on the correlation between roughness and crashes (Bennett, P & Cairney, P 2008, p.5).
37
Another more recent study by Bennett and Cairney, highlight a relationship with increasing roughness and increasing crash rate. This is evident in Figure 11 below, where it can be seen a large spike in crash rate occurs when roughness exceeds 130 counts/km. Roughness between 50 to 120counts/km have only a small increase in crash rate per 100 million VKT.
38
2.2.4 Relationship between Roughness and Speed
The relationship between speed and roughness has also been investigated in the Swedish and Indian research.
Figure 12: Relationship between IRI and speed (Ihs 2004 p.4)
39
Figure 13: Relationship between Surface roughness and free flow speed (Chandra 2004, p.361).
Figure 14: Effect of roughness on capacity on two lane rural roads (Chandra 2004, p.364)
40
2.2.5 Driver perception of roughness
Figure 15: Perception of IRI (Ihs 2004 p.9)
Figure 15 shows the driver perception of IRI when asked to drivers on a range of routes, for comments on the driving comfort. This is evident that the lower the IRI is, the better the ride comfort (Ihs 2004 p.9). Therefore, roughness and other surface deterioration are noticed by the public community. Road authorities are often informed by the public when a road’s roughness or other characteristics are below community standards.
Table 6 below are suggested roughness limits for each speed limit. It shows an increasing tolerance of IRI as the speed decreases. Therefore, for higher speeds (100km/hr), there must be a higher level of pavement quality provided than in a 50km/hr zone.
41
2.3 Speed Parameters and Compliance
Speed limits are the enforced value in which a driver must not exceed, variable to the length of road driven (Austroads 2008, p.6). Speed limits are applicable on almost all of the road network.
In Queensland, the generally adopted default speed limits are 50km/hr in built-up areas and 100km/hr in rural areas (Queensland Government 2014a). A speed limit is based on the road function, non-interrupted traffic speed, adjacent roadside development, road characteristics and traffic parameters.
The main factors which determine a speed limit on an existing road include the function of the road, the current traffic speeds, and the speed environment. Crash history and safety factors also are investigated in a speed limit review. The function of the road and how it interacts with the road network must be reflective of the speed limit. The function of a road ranges from access and collector roads to arterial roads. The current speed is an important factor, as it is based on the 85th percentile speed or V85 speed. The V85 is pass the point of inflection (maximum) of the normal distribution curve, and represents the speed that the majority (85%) of drivers adopt or driver under. The speed environment is based on the roadside development, road parameters and traffic characteristics. Traffic characteristics include the traffic volumes (AADT), patterns, and composition (% heavy vehicles, pedestrians etc.). Road parameters include the lane and shoulder widths, amount of intersections, roadside hazards, sight distance and the alignment.
There are a range of speed parameters which are used in setting a speed limit. The design speed is related to the geometric parameters of the road, and must reflect the road and driving conditions. The operating speed is the V85 speed, which is normally equal to or lower than the design speed. The desired speed is the V85 on long straights or curves where the drivers will settle at (Roads and Traffic Authority 2011). The Limiting Curve Speed (LCS) is the maximum speed around a curve based on the superelevation on the curve and the absolute maximum value of side friction. The V85 should be less that the LCS.
2.3.1 Speed Compliance
42
or vulnerable drivers) and regulate environmental impacts such as noise pollution (Queensland Government 2014a).
2.3.2 Treatment of Roughness
At locations of high roughness, the risk of crashes is significantly increased and revisions to the speed limit should be considered at these sites. The MUTCD Part 4 highlights methods of temporary speed reduction, which should be installed until the pavement surface is rehabilitated or repaired. For short road segments (less than a kilometre), temporary speed reduction advisory signs can be utilised. On longer sections of road (more than a kilometre), speed limit reduction should be applied with advice to drivers for the reason of the speed limit change (i.e. ‘rough surface’ advisory signage) (Queensland Government 2014a).
Additionally, the MUTCD highlights IRI levels for 110km/hr speed zones. Clause 3.3.2 of Part 4, states that the average pavement roughness should not exceed an IRI of 4 (150 counts/km NRM), with less than 20% of the road segment exceeding an IRI of 4. Further, the absolute maximum pavement roughness is IRI 6 (158 counts/km NRM). These guidelines are further reduced with increased crossfall (exceeding 5% on straights, and 7% on curves), where the absolute maximum roughness should not exceed IRI 4 (Queensland Government 2014a). No roughness guidelines are given in the MUTCD for other speed environments.
2.3.3 Effect of Crash History on speed
A high frequency of crash incidents is an indication of safety issues on the road. One factor contributing to road safety is the speed limit, and an unsuitable speed environment can increase the rate of crashes in a segment. Speed is frequently a contributing factor in road incidents, however is rarely specified as the cause of the crash (Queensland Government 2014a).
Only after thorough investigation into the potential cause of incidents and analysis of other feasible measures to improve the safety, can the speed limit be reviewed.
43
can be expressed as the collective risk, given by the casualty rate per kilometre of road. This method is reflected of the number of casualties, which is a function of the AADT, therefore creating difficulties when comparing low volume and high volume roads (Austroads 2008, p.9).
Lower speed limits have a range of safety benefits for drivers including:
-
Allow greater time to locate and assess a hazard, in order to avoid a crash.- Reduce the vehicle breaking distance and time to stop
- Decreases risk of losing control of the vehicle
- Limit the impact force if crash is inevitable, and decrease crash severity.
- Even a small reduction in speed (1-2%) can greatly reduce the chance of death and injuries (Austroads 2008, p.2).
44
2.4 Road Safety
Road safety is an essential part of any road network. In Australia, the estimated economic cost of crashes is approximately $27 billion per annum (Australian Government 2014a). With 1193 fatalities on the Australia road network in 2013, the emphasis on road safety is imperative, and the transport authorities regularly campaign to the public and allocate funding for increased road safety.
2.4.1 Crash Costs
Estimated crash costs as used by the Queensland Department and Main Roads to quantify crash severity are:
Figure 16: 2014 Crash Costs (QDTMR 2014c)
Crash Severity 2014 Crash Costs
Property Damage $10,002
Minor Injury $36,334
Medical Treatment $107,049
Hospitalisation $373,424
Fatality $8,221,618
45
2.4.2 Improving Road Safety
Road authorities design roads with safety at the forefront of each decision. A range of treatments are applied to improve the safety of the road. These include:
General treatments
- Installing appropriate regulatory signs (control traffic movement), warning signs (alert drivers of hazards), guide signs (advise of directions and destinations) and temporary signs (used around work sites/ road works) to inform the driver of the road conditions e.g. Road subject to flooding signs, or rest areas ahead (Queensland Government 2014c, p.6). This ensures the driver is aware of upcoming scenarios and can adjust their driving behaviour accordingly, e.g. school zone ahead.
- Installing guideposts on either side of road to increase delineation of the horizontal and vertical geometry, particularly at night. They can also be used to gauge available sight distance. Guideposts can be installed at decreased spacing’s to highlight hazards or changes to the road conditions, e.g. floodways, culverts, at tight horizontal curves or at width changes (Queensland Government 2014d, p.53).
- Using Raised Pavement Markers (RPM’s) on roadways also increase the delineation of the road and also alert the driver if the vehicle veering over the lane edge lines.
- Line marking aids to the delineation of the road and separates the two directions on traffic. Barrier lines convey a no-overtaking zone, which is based on adequate stopping and overtaking sight distances (Queensland Government 2014d, p.53).
- Pavement maintenance (roughness, potholes and cracking) on roads is vital to the road safety.
- Clearing the appropriate clear zones allows adequate space to recover the vehicle in a possible crash scenario, or limit the severity of a crash by decreasing the amount of hazards (RACQ 2014).
- Installing frangible poles and safety barriers also decreases the amount of hazards on the road, and therefore limits the possibility of crashes (RACQ 2014).
46
seal width. It is evident that a seal width of 7m to 8m is desirable, with longer widths reducing the crash rate further.
Figure 17: Relative Crash Rate with total seal width (Queensland Government 2013b, p.30)
- Lighting increases the safety of a roadway, as it increases the driver’s ability to
sense hazards at night-time. Lighting is usually used in built up areas, or areas of hazard (taper of two lanes into one lane, bridge crossing etc.).
Specific Treatments
- Guardrail is used as a barrier between the vehicle and a hazard (e.g. on a bridge to stop vehicles falling into the water, or in steep mountainous terrain).
- Appropriate Intersection treatments for a location are dependent on the current and predicted traffic volumes for each manoeuvre. These options include basic treatments, auxiliary lane treatments, channelized turn treatments which can each be in the left and/or right directions. These treatments remove turning traffic from the through traffic, and therefore limit the risk of rear end collisions. Increased traffic volumes or higher risk locations warrant signals, roundabouts, and overpasses to control each traffic manoeuvre (Queensland Government 2006, p.21-28).
47
collisions (Queensland Government 2013b, p.28). This may be in the form of a widened centre line treatment (painted) or a physical median/island.
- In urban areas traffic calming devices such as speed bumps and reverse curves to slow vehicles down, are used as effective safety tools. (Scottish Government 2006)
- Rumble strips or audio tactile line marking (ATLM’s) increase driver alertness and are particularly useful in locations with a history of driver fatigue (Scottish Government 2006). They are used on the edge lines as delineation, and when the wheel makes contact the driver senses a load noise and vibration.
- Constructing flatter batter slopes such as 1 on 6 or 1 on 10, to increase recoverability when vehicle transverses off the roadway.
- Designated areas for bicycles, buses, pedestrians or other specialised vehicle categories may increase safety for all road users. This may be in the form of an elusive lane or stopping area.
48
2.4.3 Road Safety Incentives
In Australia, the Federal and State Government have implemented a range of initiatives to promote road safety. These may include targeting the road quality, by providing funds for substandard roads or educating drivers about road safety. Some of these initiatives include the Black Spot program and Road Safety Action Plan.
Funded by Federal Government the Black Spot Program targets locations with a reoccurring crash history. It aims to reduce crashes, by installing roundabouts or traffic signals at dangerous intersections, installing additional overtaking lanes, or increasing the seal width (Australian Government 2014b). Between 2014 and 2019, the program has $500 million dollars for the improvement of the nation’s roads, with 50% of funding dedicated to improving roads in regional Australia (Australian Government 2014b). This program, among other funding initiatives, ensures the necessary financial support for much needed road improvements around the nation.
The Western Australian Government’s safety initiatives address safe road use, safe roads and roadsides, safe speeds and safe vehicles. Each of these categories has objectives and initiatives to improve the death toll in the region. Figure 18 highlights the components that influence road safety.
49
The Queensland Government has undertaking a range of initiatives in their 2013-2015 Road Safety Action Plan. Some of these initiatives include:
- Alcohol and risk-related trauma injury awareness programs
- Student education programs in schools to highlight the risks vehicles pose.
- Reviewing Speed limits in the Region (refer section 1.2).
- Fast-track safe engineering treatments, such as flashing lights on school signs.
- Reforms to youth and elderly licensing procedures, and motorcyclists (Queensland Government 2014f).
- The ‘Join the Drive to Save Lives’ initiative to promote safe driving practises and
to educate the public about crash statistics.
These initiatives and many others work together to improve the community’s culture on issues such as speeding and drink driving. It is these initiatives which improve the driver behaviour on the road network and limit the risk of incidents occurring.
The effect of safety initiatives is evident in the decline in the death toll on Queensland’s roads. Figure 19 highlights the death toll in each year from 1981 to 2012, and the safety initiatives which were implemented throughout this period (Queensland Government 2014f). It can be seen that with an increased emphasis on road safety, the death toll is declining.
Figure 19: Effect of Safety Initiatives in Queensland on crash rate (1981 to 2012) (Queensland Government 2014f)
50
Chapter 3: Dissertation Methodology
Chapter 3 defines the methods used within the model, to achieve the research objectives as determined in the introduction (section 1.4). It details the methods of gaining each set of data, and the way it has been utilised in the model. It also defines the equations used to calculate the crash rate from crash history data and road parameters.
3.1 Methodology Approach and Data
This dissertation aims to find the relationship between roughness, speed and safety. If a correlation is found, methods of increasing the road safety by controlling the speed and roughness will be investigated. To complete the analysis, a case study approach is adopted, by investigating the road network in the Downs South West Region, as defined by the Department of Transport and Main Roads. This research has three main components: Roughness, Speed and Safety.
Data for each of the parameters is sourced from Department of Transport and Main Roads ARMIS (A Road Management Information System) database of the network’s roads or other similar databases. Roads selected will be state or federal roads in the south east Queensland area. Roads will be rural roads with a posted speed limit of 80km/hr or higher (maximum 110km/hr). The data gathered will be road roughness data, the AADT, traffic land widths (sealed), road geometry, traffic types (%HV, Road train route etc.), location of intersections, crash history and speed counts through the locations. This data will be holistic in nature, any roads with partial data will not be analysed.
51
3.1.1 Roughness Data
Roughness data was obtained through the DTMR Road Asset Data Request Form, where a description of the data required, the purpose of the data, users of the data and the publication audience of the data are required. Initially, a list of all roads in the region specified was requested, with their corresponding average roughness. From this list, a collection of roads with generally high roughness values were selected. For these selected roads, the roughness data was given in 100m and 1km segments of road. The data was given in NRM units, rather than IRI, as this is still Queensland’s main roughness measurement (QDTMR 2014d). The data gathered highlights the road name and number, the start and end chainage for the segments, the roughness through the segment, whether the road is sealed or unsealed and the speed limit through the segment. To maintain homogeneity in the analysis, roads with unsealed stretches were omitted from the analysis.
This data was compared with the standards of roughness, to gain an understanding of the region’s road quality. The majority of the state roads in Queensland’s South West are highways and main roads with a sign posted speed of 100km/hr. For isolated sections in this category, the roughness level suggested to investigate (in Table 3) is an IRI of 5.3 (139 counts/km NRM) and for lengths larger than 500m recommended roughness levels are 4.2 IRI (110 counts/km NRM) (Austroads 2007, p.18). These benchmarks will be used in analysis.
3.1.2 Speed Data
Speed Data was collected through the DTMR Traffic Analysis and Reporting System (TARS) database. The speed data collected is from 2013 (or 2012 in the rare cases where 2013 data is unavailable). For each road analysed, the site daily speed statistics is collected (QDTMR 2014e). The daily speed data and the average weekly speed data is given, at each tested location along the road. The number of vehicles, the mean speed and the 85th percentile speed is given (V85). A graph with the number of vehicles in each speed group in 5km/hr segments is also given (i.e. 80-85km/hr, 85-90km/hr). From this data, it is evident where the vehicles comply with the speed limit and locations where non-compliance is occurring.
3.1.3 Crash Data
52
made through the Road Crash, Registration, Licensing and Infringement Data Request Form. For this form, the use of the crash data, the extents of the data, the timeframe (5 years of data), the geographical area and the statistical data required (information about each crash) are defined. A large range of information is available, about the crash, casualties, vehicle types, categories (such as age, gender and license type) and contributing circumstances. For the purpose of this research, information about the crash, vehicle types and the contributing circumstances will be sufficient for most of the data requirements. More detailed information was also investigated, such as if crashes where due to fatigue, drunk driving, weather conditions etc.
All the crash data collected is from the DTMR RoadCrash Database (Qld DTMR RoadCrash Database 2014). For a crash to be a part of this database, the incident must meet the following criteria. The crash (Qld Dept. of Transport and Main Roads' RoadCrash Database 2014):
- Must be reported to police
- Must be caused by at least one vehicle on a road or nearby a road.
- Must be a situation where property damage occurs ($2500 or more damage to property excluding vehicles), or at least a vehicle is towed away, or a person is injured or killed.
The crash data collected will be analysed for the selected roads, and will be used for a range of models, including crash severity type. These models will investigate whether roughness impacts the frequency or severity of crashes.
3.1.4 Other Data Required
A range of other parameters are required for an accurate portrayal of each road case study. Parameters to be included into the analysis include:
- Annual Average Daily Traffic counts (AADT) (veh/day)
- Sealed traffic lane width (m)
- General road geometry (i.e. vertical crests, floodways or horizontal curves).
- General type of traffic using the road way (%HV, Road train route etc.)
- Location of intersections.
53
values for each of these parameters can be found using DTMR information. 2013 AADT information is readily available, and the %HV is also found with this
information (QDTMR 2014f). Maps are publicly available showing which routes are permitted for the use of Type 1 or 2 Road Trains. Intersection locations are available publicly on Google Maps, or internally through DTMR feature lists. Road Geometry can be seen from Google Map Street View tools, or the internal DTMR program DVR (which shows the road from the perspective of the driver). The sealed width is located within the DTMR ARMIS database.
All data is generally recorded for each road within the model. This breaks the data sets into manageable sizes and allows data to be presented clearly for ease of analysis and comparison.
3.2 Roughness Data Analysis
Using statistical parameters, the roughness on all the Downs South West roads will be investigated. This gives an overview of the data analysed, and represents the current standards and expectations of roughness in this region. It will give information about the demographics of roughness, in order to give recommendations when the results of other models have been presented. A box and whisker plot will be used to graphically represent the region’s roughness. When assessing roughness data, any abnormally high values of roughness have been removed from the analysis.
3.3 Road Selection
54
55
3.4 Analysing Crash Data
When analysing the crash history, a method of quantifying each accident is required. As seen in the literature review, crash statistics can be presented in crashes per 100 million vehicle kilometres travelled (VKT) (Section 2.2.3). There are number of approaches to calculating crashes per VKT. The methods analysed in this research are explained below in sections 3.4.1 to 3.4.3.
The crash data used has a range of limitations. In-depth knowledge about the cause of the crash is generally uncertain, as the information given classifies each crash by
incident severity (fatality, property damage, hospitalisation, and so on) and by nature of the crash (as per DCA group (Definitions for Coding Accidents) which define the moments leading up to a crash, such as ‘head on’, ‘rear end’, and ‘off carriageway on straight’) (Queensland Government 2014e, p.9, 26). The causes of a crash are not normally specifically given, for example distracted driver or bad weather, and any information given usually does not represent the full scenario. Information is given in a ‘yes or no’ format, and suggests if the driver was drunk, or if it was raining at the time of the crash. This limitation of information has incorporated some inaccuracy into the results. As all data is collected in this manner, the data is consistent and comparable.
3.4.1 Method A: Using MUTCD approach
The MUTCD Chapter 4: Speed Controls, Appendix E refers to the analysis of crash data. The approach is to calculate the casualty crash rate in order to have an appropriate value for comparison. Here the crashes for each segment is per 108 vehicle kilometres travelled (VKT).
The formula for Casualty crash rate is:
𝑅 = ∑ 𝐶𝑡 𝑥 𝐴𝑡
20
𝑡=1
𝑥 104 𝑥 1
𝑀
(Queensland Government 2014a, p52)
Where Ct = Crash Risk Score (See appendix C) At = Average number of crashes
M= Measure of the crash exposure in VKT (Length of road segment (km) x AADT x 365)
56
The crash risk score (Ct) is calculated from the nature of the crash or DCA groups , with score classifications for high and low speed environments, and per the risk of the crash occurring. Low risk incidents such as rear end, or hitting a permanent obstruction on carriageway (e.g. median) have a low crash risk score of 26 and 15 respectively (for high speeds greater than 80km/hr). Higher risk incidents include head on collisions, or running into pedestrians, which have a score of 192 and 169 respectively (for high speeds greater than 80km/hr) (Queensland Government 2014a, p.53). The full table is in Appendix C. The average number of crashes (At) is calculated by averaging the number of crashes for each DCA group per year.
The crash exposure is calculated through the combination of length and AADT volumes (similar to most crash rate models). As this variable is on the denominator, crashes on roads which are short with low traffic volumes, have a higher contribution to crash rate. While crashes on roads with longer lengths and high traffic volumes required higher crash frequencies to equal the crash rate of shorter, low volume road segments.
57
3.4.2 Method B: Using U.S. Department of Transport approach (100 million)
A widely accepted approach to quantify crash rates is using a method which is less dependent on crash type and instead focuses on AADT and length of the road segment. This calculates the crashes per 100 million vehicle kilometres travelled (VKT), and the formula is expressed as (United States Department of Transportation 2014):
Where:
C is the total number of roadway departure crashes in the study period V is the Average Annual Daily Traffic (AADT) volumes
N is the years of data
L is the length of the roadway segment in kilometres (United States Department of Transportation 2014)
Other methods are comparable to this method, usually with some slight variations.
3.4.3 Method C: Using U.S. Department of Transport approach (million)
This method of calculating crash rate is very similar to Method B above. Instead of using crashes per 100 million VKT, it uses crashes per million VKT. This method presents a more suitable approach for roads with less frequency of crashes, lower AADT volumes and shorted kilometres travelled. Each method will provide slightly different results, however both methods are acceptable if it is ensured that values to compare with have been calculated in the same manner.
R = C x 1,000,000 (Massachusetts Department of Transportation 2014)
V x 365 x N x L
58
3.4.4 Crash Investigations: Crash Segments vs. Non-crash segments
A more simplistic model to gain an understanding on the correlation between roughness and crash rate is to determine the differences between crash segments and non-crash segments. By assigning the status of ‘crash segment’ or ‘non-crash segment’ to each kilometre of every road in the model, and then finding the average roughness (in 1km sections) of both categories, a conclusion can be made. The average roughness through crash segments are compared with non-crash segments, to determine which has the highest average roughness. The average roughness through all sections is also worth noting and comparing with the results. If the average roughness in crash and non-crash segments is within a tolerance of plus or minus 1count/km, then the roughness is deemed even for both crash segments and non-crash segments.
3.4.5 Comparison of Crash Data
59
3.4.6 Crash Investigations: Light vehicles and Heavy Vehicles
Comparing the roughness at crash sites involving light vehicles, with the roughness and crash rate of sites with heavy vehicle, investigates if roughness has a greater, lesser or similar impact on different vehicle types. This model will be investigated using the same crash model and roughness data, with another section categorising each crash per vehicle type.
60
3.5 Analysing Speed Data
The speed data is analysed using the V85 speed, which has been gained on site with pneumatic tube counters, and the posted speed limit. The difference between these two parameters has been calculated to determine the speed variance. This speed variance is plotted against the roughness in 1km segments to compute the relationship between speed data and pavement roughness.
Sites where the posted speed limit is less than 80km/hr have been removed from the data set, as the roughness measured at these speeds gives a skewed representation of the driving conditions.
The results from this graph may give an indication to the magnitude of roughness where the V85 speed is affected by roughness. At this roughness value, investigations of possible changes to the posted speed limit can be explored.
Sites of interest can be analysed to ensure that other factors which affect the drivers chosen speed are not creating bias into the model. An example includes a small radius horizontal curve. These are usually identified onsite by an advisory speed sign at each end of the curve, encouraging drivers to lower their speed to negotiate the curve. Another indicator is the use of Chevron Alignment Markers (CAMs), installed around the outside of the curve (see Figure 20), which also indicate to drives to slow to negotiate the curve. Investigations may show that drivers slow down around the curve, and speed up to their travelling speed on the adjacent straight.
61
3.6 Case study Analysis
A selection of the model will be analysed further in the case study analysis. This study involves selecting a few roads (between 4 and 6), and completing an in-depth analysis of each road, and the various parameters which effect the speed, crash risk and roughness at that location. The seal width, clearzone, road geometry and a range of other variables which effect road quality, speed, crash risk and roughness will be investigated. Site visits will be conducted on roads which require on-site analysis. Resources such as DVR, Chartview and other public and DTMR information will be utilised.
3.6.1 On-Site Analysis
On site analysis is required when there is an unusual or unexplained crash history, or when results are unexpected, or further onsite information is required. This involves driving through the length of the road and taking note of driver comfort, roughness, possible hazards, road parameters (pavement width, clearzone), types of vehicles, geometry etc. Occasionally, field analysis included examining the quality of pavement from the side of the road to gain a visual understanding of roughness. In this case, safety procedures and responsibilities were carried out, such as wearing productive clothing (steel capped boots and high visibility clothing), keeping away from the outside traffic lane and when possible, having another person present to spot for traffic. When the technology was available, the GPS tripmeter from the Department of Transport and Main Roads office was borrowed, to have an accurate understanding of the location (road chainages).
3.7 Financial Modelling
Defining the costs of rectifying or improving the condition of road roughness on Queensland’s roads will also be investigated. This involves investigating the types of improvements available, the effectiveness of these methods and the current costs to implement these on-site. This treatment not only lowers the roughness, but improves the pavement quality as a whole.
62
The costs highlighted in this section have been estimated using recent projects completed by the Department of Transport and Main Roads, Toowoomba Office. They are suitable for 2014, and will require additional escalation costs if referred to in the future. Escalation costs are generally 5% in the first 2 years, and 6% over the 3rd and 4th years, depending on the econom