UNIVERSITI TEKNIKAL MALAYSIA MELAKA
APPLICATION OF TAGUCHI METHOD IN THE
OPTIMIZATION OF CUTTING PARAMETER FOR SURFACE
ROUGHNESS IN TURNING
This report submitted in accordance with requirement of the Universiti Teknikal Malaysia Melaka (UTeM) for the Bachelor Degree of Manufacturing Engineering
(Manufacturing Process)
by
NUR YASMIN BT ZULKIFLI B050710001
UNIVERSITI TEKNIKAL MALAYSIA MELAKA
BORANG PENGESAHAN STATUS LAPORAN PROJEK SARJANA MUDA
TAJUK: Application of Taguchi Method in the Optimization of Cutting Parameter for Surface Roughness in Turning
SESI PENGAJIAN: 2010/11 Semester 2
Saya NUR YASMIN BT ZULKIFLI
mengaku membenarkan Laporan PSM ini disimpan di Perpustakaan Universiti Teknikal Malaysia Melaka (UTeM) dengan syarat-syarat kegunaan seperti berikut:
1. Laporan PSM adalah hak milik Universiti Teknikal Malaysia Melaka dan penulis. 2. Perpustakaan Universiti Teknikal Malaysia Melaka dibenarkan membuat salinan
untuk tujuan pengajian sahaja dengan izin penulis.
3. Perpustakaan dibenarkan membuat salinan laporan PSM ini sebagai bahan pertukaran antara institusi pengajian tinggi.
4. **Sila tandakan (√)
SULIT
TERHAD
TIDAK TERHAD
(Mengandungi maklumat yang berdarjah keselamatan atau kepentingan Malaysia yang termaktub di dalam AKTA RAHSIA RASMI 1972)
(Mengandungi maklumat TERHAD yang telah ditentukan oleh organisasi/badan di mana penyelidikan dijalankan)
Alamat Tetap:
A4-L3-01, PPR Paya Nahu II, 08000, Sungai Petani, Kedah.
Tarikh: _________________________
Disahkan oleh:
PENYELIA PSM
(Tandatangan dan Cop Rasmi)
Tarikh: _______________________
DECLARATION
I hereby, declared this report entitled “Application of Taguchi Method in The Optimization of Cutting Parameter for Surface Roughness in Turning” is the results
of my own research except as cited in references.
Signature : ………...
Author’s Name : NUR YASMIN BINTI ZULKIFLI
APPROVAL
This report is submitted to the Faculty of Manufacturing Engineering of UTeM as a partial fulfillment of the requirements for the Degree in Bachelor of Manufacturing Engineering (Manufacturing Process). The member of the supervisory committee is as follow:
……….. Supervisor
i
ABSTRAK
ii
ABSTRACT
iii
ACKNOWLEDGEMENT
I would like to thank for those who have reviewed and/or made contribution to this project. I am especially Alhamdulillah to Allah s.w.t to give all the guidance and also Blessing me, to the following indebted individuals especially to my Supervisor En. Mohd Shukor Bin Salleh, for your kindness advises guidance in developing and producing this work, moral support, until my Final Year Project completed. I am also indebted to my parents for your kind always praying for my successful. I thank to our lecturer in FKP, too numerous to mention, have shared their input and contribution on how to make this project more effectives as a teaching and learning tool. To all those who have helped, I expressed my sincere “Thanks”!
DEDICATION
My Parents
Who has always been there for me and always prays for me,
My younger sister,
My friends
iv
TABLE OF CONTENT
Abstrak i
Abstract ii
Acknowledgement iii
Table of content iv
List of tables vii
List of figures viii
List abbreviations x
1. INTRODUCTION
1.1 Background 1
1.2 Problem Statement 2
1.3 Objectives 3
1.4 Scope 3
1.5 Structure of the report 4
1.5.1 Chapter 1: Introduction 4
1.5.2 Chapter 2: Literature review 4
1.5.3 Chapter 3: Methodology 4
1.5.4 Chapter 4: Result 4
1.5.5 Chapter 5: Discussion and analysis 4 1.5.6 Chapter 6: Conclusion and recommendations 4
1.6 PSM 1 Gantt Chart 5
1.7 PSM 2 Gantt Chart 6
2 LITERATURE REVIEW
2.1 Material selected 7
2.2 Turning features 10
2.2.1 Cutting tool material 12
2.2.2 Cutting operation 14
2.2.3 Surface roughness 16
v
2.2.4 Types of chip produced 20
2.2.4.1 Continuous chips 20
2.2.4.2 Built-up edge chips 22
2.2.4.3 Serrated chips 24
2.2.4.4 Discontinuous chips 24
2.2.5 Tool life 26
2.3 Cutting parameters 28
2.3.1 Cutting speed 28
2.3.2 Feed 29
2.3.3 Depth of cut 29
2.4 Taguchi method 30
3 METHODOLOGY
3.1 Objective of the experiment 35
3.2 Research flow chart 36
3.3 Design of experiment-Taguchi method 37
3.3.1 Variable machining parameter 37
3.3.2 Design of experiment matrix 37
3.3.3 Response variables 38
3.4 Material preparation 38
3.4.1 Workpiece 38
3.5 Cutting tool material 39
3.5.1 Coated carbide 39
3.6 Machine preparation 40
3.6.1 CNC lathe machine 40
3.7 Test and measurement 41
3.7.1 Surface roughness measurement 41
3.7.2 Eliminate error 44
3.8 Data analysis 44
3.9 Discussion on the result 45
vi
4 RESULTS
4.1 Introduction 46
4.2 Measurement Results 46
4.3 D.O.E Results 47
4.3.1 Main Effects Plot for Means 48
4.3.2 Main Effects Plot for S/N Ratios 51
4.3.3 Analysis of Variance for Means (ANOVA) 54
4.3.4 Predicted Value of Surface Roughness 55
5 DISCUSSION
5.1 Introduction 57
5.2 Surface Roughness Numerical Analysis 57
5.3 Surface Roughness D.O.E Graphical Analysis 60
6 CONCLUSION AND RECOMMENDATION 62
REFERENCES 63
vii
LIST OF TABLES
2.1 Mechanical properties of mild steel 8
2.2 Thermal properties of mild steel 9
2.3 Processability of mild steel 9
2.4 Durability of mild steel 10
2.5 Mechanical properties of cutting tool 12
2.6 Thermal properties of cutting tool 13
2.7 Processability of cutting tool 13
2.8 Durability of cutting tool 13
2.9 Factors influencing machining operations 15
2.10 Factors affecting surfaces roughness 18
2.11 Cutting speed for some common metals 29
2.12 Key features of review study 33
2.13 Comparing DOE and Taguchi methods 34
3.1 Variable machining parameters 37
3.2 Design of experiment matrix 38
3.3 The function of surface roughness measuring machine accessories 42
4.1 Surface roughness result for set A 46
4.2 Surface roughness result for set B 47
4.3 Response table for means for set A 49
4.4 Response table for means for set B 51
4.5 Response table for Signal to noise ratio for set A: Smaller is better 52 4.6 Response table for Signal to noise ratio for set B: Smaller is better 53
4.7 Predicted value of surface roughness 55
4.8 Factor levels for predictions 56
5.1 Controllable Parameter Setting 59
viii
LIST OF FIGURES
2.1 Basic metal cutting theory 11
2.2 Process schematic, turning, boring and parting operations
performed on a lathe 14
2.3 Effect of feed rate and edge preparation on shearing force
and ploughing force 17
2.4 Effect of feed rate and edge preparation on surface roughness
of the machined workpiece 17
2.5 Measuring surface roughness with a stylus. The rider supports
the stylus and guards against damage 19
2.6 Path of the stylus in surface roughness measurements
(broken line) compared to the actual roughness profile 20 2.7 Continuous chip with narrow, straight and primary shear zone 21 2.8 Continuous chip with secondary shear zone at the chip-tool
interface 22
2.9 Built- up edge 23
2.10 Hardness distribution with a built-up edge in the cutting zone 23 2.11 Surface finish produced in turning 5130 steel with a BUE 23
2.12 Segmented or nonhomogeneous chip 24
2.13 Discontinuous chip 25
2.14 Flank wear 26
2.15 Crater wear 27
2.16 Chipped cutting edge 27
2.17 Thermal cracking on rake face 27
2.18 Built-up edge 27
2.19 Catastrophic failure 28
2.20 Schematic illustration of the turning operation showing various
features 30
3.1 Research flow chart 36
ix
3.3 Inserts Coated Carbide 39
3.4 CNC lathe machine 40
3.5 Portable roughness measuring machine 41
3.6 Portable roughness measuring accessories 42
3.7 Stylus 42
3.8 Surface roughness of mild steel bar 43
3.9 Surface roughness result 44
4.1 Main Effects Plot for set A 48
4.2 Main Effects Plot for set B 50
4.3 Main Effect Plot for Signal to Noise Ratios Graph for set A 51 4.4 Main Effect Plot for Signal to Noise Ratios Graph for set B 53
4.5 Analysis of Variance for Means 54
x
LIST OF ABBREVIATIONS
CNC - Computer Numerical Control
UTeM - Universiti Teknikal Malaysia Melaka PSM - Projek Sarjana Muda
AISI - American Iron and Steel Institute SAE - Society of Automotive engineers TiC - Titanium carbide
TiCN - Titanium carbonitride CVD - Chemical vapour deposition PVD - Physical vapour deposition Ra - Average surface roughness value
BUE - Built-up edge
PDE - Parameter Design Experiment S/N - Signal-to-noise
MRR - Material Removal Rate DOE - Design of experiment
1
CHAPTER 1
INTRODUCTION
1.1 Background
The challenge of modern machining industries is mainly focused on the achievement of high quality, in terms of work piece dimensional accuracy, surface finish, high production rate, less wear on the cutting tools, economy of machining in terms of cost saving and increase the performance of the product with reduced environmental impact (Hasan, 2007). Surface roughness plays an important role in many areas and is a factor of great importance in the evaluation of machining accuracy (Palanikumar, 2006). Surface roughness, an indicator of surface quality is one of the most specified customer requirements in a machining process. For efficient use of machine tools, optimum cutting parameters (cutting speed, feed rate and depth of cut) are required. So it is necessary to find a suitable optimization method which can find optimum values of cutting parameters for minimizing surface roughness.
2
factors such as feed rate, work material characteristics, work hardness, unstable built-up edge, cutting speed, depth of cut, cutting time, and tool nose radius.
The Taguchi method is statistical tool, adopted experimentally to investigate influence of surface roughness by cutting parameters such as cutting speed, feed rate and depth of cut. The Taguchi process helps to select or determine the optimum cutting conditions for turning process. Many researchers developed many mathematical models to optimize the cutting parameters to get lowest surface roughness by turning process. The variation in the material hardness, alloying elements present in the work piece material and other factors affecting surface finish and tool wear. The Taguchi design of experiments was used to optimize the cutting parameters and it is a powerful tool for the design of high quality systems. It provides simple, efficient and systematic approach to optimize designs for performance, quality and cost. Taguchi method is efficient method for designing process that operates consistently and optimally over a variety of conditions. To determine the best design it requires the use of a strategically designed experiment. Taguchi approach to design of experiments in easy to adopt and apply for users with limited knowledge of statistic, hence gained wide popularity in the engineering and scientific community. The desired cutting parameters are determined based on experience or by hand book. Cutting parameters are reflected on surface roughness, surface texture and dimensional deviation turned product. In a manufacturing process it is very important to achieve a consistence tolerance and surface finish. Taguchi method is especially suitable for industrial use, but can also be used for scientific research (Hasan, 2007).
1.2 Problem statements
3
For this research study, it is targeted to find out the answer for the following questions:
1. What are the roles of optimized cutting parameters (cutting speed, feed rate and depth of cut) of the turning process for controlling the required surface roughness?
2. How Taguchi process helps to select or to determine the optimum cutting conditions for turning process?
3. How surface roughness plays an important role in many areas and is a factor of great importance in the evaluation of machining accuracy?
1.3 Objectives
The objectives of this study are as follow:
1. To find the optimal cutting parameters for surface roughness in turning. 2. To define the number of levels for the process parameters and possible
interaction between the process parameters.
3. To select the appropriate orthogonal array and assign of process parameters for the orthogonal array.
1.4 Scope
4
1.5 Structure of the report
The summary of each chapter was described in the structure of report. The structure of the report includes Chapter 1 until Chapter 6 of the report.
1.5.1 Chapter 1: Introduction
This chapter includes the background of the project, problem statement, objectives, scope and project management of the whole project.
1.5.2 Chapter 2: Literature review
Literature review on cutting parameters, surface roughness, material used which is mild steel and inserts used (coated carbide).
1.5.3 Chapter 3: Methodology
This chapter describes the methodology of the project that contains a brief explanation about the work piece preparation (mild steel), preparation of the machine, the analysis of cutting parameter and surface roughness, discussion and conclusion.
1.5.4 Chapter 4: Result
1.5.5 Chapter 5: Discussion and Analysis
5
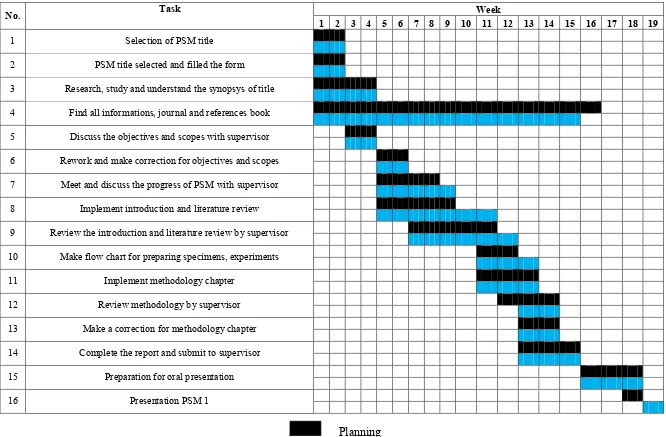
No. Task Week
1 2 3 4 5 6 7 8 9 10 11 12 13 14 15 16 17 18 19
1 Selection of PSM title
2 PSM title selected and filled the form
3 Research, study and understand the synopsys of title
4 Find all informations, journal and references book
5 Discuss the objectives and scopes with supervisor
6 Rework and make correction for objectives and scopes
7 Meet and discuss the progress of PSM with supervisor
8 Implement introduction and literature review
9 Review the introduction and literature review by supervisor
10 Make flow chart for preparing specimens, experiments
11 Implement methodology chapter
12 Review methodology by supervisor
13 Make a correction for methodology chapter
14 Complete the report and submit to supervisor
15 Preparation for oral presentation
[image:20.842.85.751.76.513.2]16 Presentation PSM 1
Table 1.1: Gantt chart for PSM 1
6
No. Task Week
1 2 3 4 5 6 7 8 9 10 11 12 13 14 15 16 17 18
1 Improvement on PSM 1
2 Additional literature review, books and journal
3 Material and Tool Preparation
4 Machine Preparation
5 Discussion with supervisor
6 Start machining the project
7 Collection data
8 Chapter 4- correction after comment by supervisor
9 Chapter 5 - correction after comment by supervisor
10 Chapter 6 - correction after comment by supervisor
11 Final correction on report writing
12 Transferring paper work into journal
13 Final editing
14 Hard cover binding
15 Submission PSM report
[image:21.842.108.751.62.502.2]16 Presentation and slide preparation
Table 1.2: Gantt chart for PSM 2
7
CHAPTER 2
LITERATURE REVIEW
2.1 Material selected
Carbon steel is sometimes referred to as 'mild steel' or 'plain carbon steel'. The American Iron and Steel Institute defines a carbon steel as having no more than 2 % carbon and no other appreciable alloying element. Carbon steel makes up the largest part of steel production and is used in a vast range of applications. Typically carbon steels are stiff and strong. Carbon also exhibit ferromagnetism, which means it is magnetic. This means it is extensively used in motors and electrical appliances. Welding carbon steels with carbon content greater than 0.3 % requires special precautions be taken. However, welding carbon steel presents far fewer problems than welding stainless steels. The corrosion resistance of carbon steels is poor which means it rust and so it should not be used in a corrosive environment unless some form of protective coating is used.
8
Advantages Cheap
Wide variety available with different properties High stiffness
Magnetic
Most carbon steels are easy machine and weld
It is often used when large amounts of steel are needed.
Disadvantages
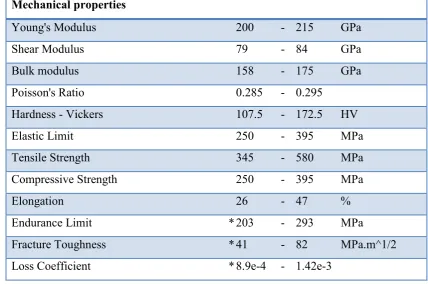
[image:23.595.102.531.361.645.2] Poor corrosion resistance like rusts.
Table 2.1: Mechanical properties of mild steel (Geocities, 2010) Mechanical properties
Young's Modulus 200 - 215 GPa
Shear Modulus 79 - 84 GPa
Bulk modulus 158 - 175 GPa
Poisson's Ratio 0.285 - 0.295
Hardness - Vickers 107.5 - 172.5 HV
Elastic Limit 250 - 395 MPa
Tensile Strength 345 - 580 MPa
Compressive Strength 250 - 395 MPa
Elongation 26 - 47 %
Endurance Limit * 203 - 293 MPa
Fracture Toughness * 41 - 82 MPa.m^1/2
9
Table 2.2: Thermal properties of mild steel (Geocities, 2010)
Thermal properties
Thermal conductor or insulator? Good conductor
Thermal Conductivity 49 - 54 W/m.K
Thermal Expansion 11.5 - 13 µstrain/°C
Specific Heat 460 - 505 J/kg.K
Melting Point 1480 - 1526 °C
Maximum Service Temperature * 200 - 350 °C Minimum Service Temperature * -68.15 - -38.15 °C
Impact on the environment
The production energy of steel is comparatively low - per unit weight, about a half that of polymers; per unit volume, though, twice as much. Carbon steels are easy to recycle, and the energy to do so is small.
Table 2.3: Processability of mild steel (Geocities, 2010)
Processability (Scale 1 = impractical to 5 = excellent)
Castability 3
Formability 4 - 5
Machinability 3 - 4
Weldability 5
[image:24.595.105.534.484.622.2]