Accepted Manuscript
An electron energy loss spectroscopy and electron diffraction study of the Pmnb polymorph of Li2MnSiO4
R.J. Gummow, M.G. Blackford, G.R. Lumpkin, Y. He
PII: S0925-8388(12)01974-3
DOI: http://dx.doi.org/10.1016/j.jallcom.2012.11.013
Reference: JALCOM 27236
To appear in:
Received Date: 21 September 2012 Revised Date: 1 November 2012 Accepted Date: 2 November 2012
Please cite this article as: R.J. Gummow, M.G. Blackford, G.R. Lumpkin, Y. He, An electron energy loss spectroscopy and electron diffraction study of the Pmnb polymorph of Li2MnSiO4, (2012), doi: http://dx.doi.org/ 10.1016/j.jallcom.2012.11.013
An electron energy loss spectroscopy and electron diffraction study of the Pmnb polymorph of Li2MnSiO4
R. J. Gummow*a, M. G. Blackfordb, G. R. Lumpkinb and Y. Hea
a. School of Engineering and Physical Sciences, James Cook University, Townsville, Queensland, Australia 4811
b. Institute of Materials Engineering, ANSTO, Locked Bag 2001, Kirrawee, NSW, Australia 2232
* Corresponding author
Ph: +61-7-47816223
Fax: +61-7-47816788
Abstract
The Mn valency and the crystallinity of Li2MnSiO4 cathodes (Pmnb form) were examined with
electron energy-loss spectroscopy (EELS) and selected area electron diffraction (SAED) both before
and after electrochemical lithium extraction. A decrease in the crystallinity of the delithiated charged
cathode particles compared to the as-prepared material was observed. The decrease in crystallinity
varied from particle to particle. EELS analysis showed that the non-uniform decrease in crystallinity
was due to a non-uniform extraction of lithium from the particles. The observed decrease in
discharge capacity of the Pmnb polymorph of Li2MnSiO4 with cycling was attributed to the
progressive loss of crystallinity and the structural collapse of Li diffusion pathways.
Keywords : electron energy loss spectroscopy; transition metal alloys and compounds; energy
storage materials; crystal structure; amorphisation
1. Introduction
Research into the application of Li2MnSiO4 as a high-capacity lithium-ion battery cathode material is
on-going despite difficulties with low electronic conductivity, polymorphism and instability of the
Li2MnSiO4 structure on charge [1-13]. Recent results obtained from nano-structured materials
produced with low temperature synthesis routes have shown vastly improved reversibility compared
to bulk materials and electrochemical capacities approaching the theoretical prediction of 333 mAhg
-1
for the P21/n, Pmn21 and Pn polymorphs of Li2MnSiO4 [14-16]. Recently the Pmnb polymorph of
phase-pure form [19]. The difficulty in preparing this polymorph without impurities in the past has
meant that it has been relatively unexplored compared to the other structural forms of Li2MnSiO4.
The disappointing preliminary electrochemical performance of this polymorph as a cathode in
Li/Li2MnSiO4 cells [19] was tentatively ascribed to both the poor electronic properties of the
material and the likely structural collapse analogous to that of the well-described Pmn21 polymorph
[20, 21].
The electron energy loss spectroscopy (EELS) spectra of lithium-transition metal compounds can be
used to determine the valence state of the transition metal cations in the cathode. Since EELS
spectrometers are integrated into transmission electron microscopes (TEM’s), a spectrum of a
nano-sized area can be obtained and can be coupled with structural data from electron diffraction spectra
and composition data obtained by Energy Dispersive X-ray analysis (EDS). This combined analysis
can be applied to ex-situ cathodes to give important insight into the chemical and structural changes
that occur in lithium-ion battery cathode materials during electrochemical cycling [22]. EELS
analysis has been applied to lithium battery cathodes including LiMn2O4 [23], LiNi0.5Mn1.5O4 [24],
LiFePO4 [25-27] and the FeOF/C [28] electrode system. In this study we present both electron
diffraction and EELS analysis to examine the structure and Mn valence state of ex-situ Pmnb
LixMnSiO4 (0<x≤2) cathodes before and after electrochemical Li extraction in Li/Li2MnSiO4 cells.
2. Experimental
2.1 Synthesis and Electrochemical Delithiation of Li2MnSiO4
Li2MnSiO4 (Pmnb form) was synthesized by a solid-state route as detailed in [19]. Electrodes were
prepared in a ratio of active material:carbon:PVDF of 60:20:20. The active material and the carbon
mixture was then mixed with PVDF dissolved in NMP and coated onto Al foil current collectors.
Cathodes were dried in a vacuum drying oven at 120⁰C for 10 h. Swagelok test-cells were assembled
in an Ar glovebox with 1M LiPF6 in a 1:1 mixture by volume of ethylene carbonate and dimethyl
carbonate (Merck Selectipure LP30) electrolyte. The anode was lithium foil with two discs of
microporous polypropylene (Celgard 2500) as separators.
Delithiated cathodes were prepared by electrochemical extraction of lithium in Li/ Li2MnSiO4 cells.
A typical cell was cycled at a current rate of 5 mAg-1 between voltage limits of 4.8 and 1.8 V in
constant current mode for 2 cycles. To maintain the discharge capacity the cell was then charged in
CC-CV mode to 4.8 V (charged at 5 mAg-1 to 4.8V and then held at 4.8V until the current decayed to
1/10th of the initial charge current). The cell was then discharged at 5 mAg-1 to a lower voltage
cut-off of 1.8V. This CC-CV cycling regime was used for cycles 3 and 4. Finally the cell was charge to
4.8 V in CC-CV mode as before. Cells were disassembled in an Argon glovebox and the cathodes
were rinsed with DME, vacuum dried and stored in Ar for analysis.
2.2 Transmission Electron Microscopy (TEM) sample preparation and analysis
The TEM samples of the as-synthesized material were dispersed in ethanol. Drops of the dispersion
were placed onto a holey carbon-coated copper grid and cleaned in Ar plasma. Charged cathodes
were scraped from the current collector, dispersed in acetone and then prepared as for the
as-synthesized material.
EELS spectra were collected with a Gatan GIF-2001 spectrometer attached to a JEOL 2010F field
emission microscope operating at 200 keV. For EELS acquisition the spectrometer entrance aperture
was set to 2 mm and the TEM operated in diffraction mode. The convergence semi-angle was 11
approximately 1.8 eV. Spectra were acquired at 0.5 eV per channel and exposure time was 0.2 sec.
Spectra were recorded from areas of the specimen with thickness less than 0.5 mean free path length
for inelastic scattering, therefore ZLP deconvolution was not applied.
Different techniques to quantify the L3/L2 intensity ratios have been used by other investigators
[29-31]. In this study the background was first removed by subtracting the extrapolated pre-edge curve
from the post-edge region then the continuum contribution was removed by inserting a step function
as illustrated in Fig 1. After subtraction of the continuum, the white line intensities of the L3 and L2
lines were obtained by integration of the areas under the peaks. In agreement with the findings of
Wang et al. [30] the L3/L2 intensity ratio was found to be a more sensitive measure of the Mn
oxidation state than the absolute values of the energy positions of the edges, which are strongly
affected by electromagnetic noise.
3. Results and discussion
3.1 As-prepared Li2MnSiO4 material
3.1.1 Selected Area Electron Diffraction (SAED) and Energy Dispersive Spectroscopy (EDS)
analysis
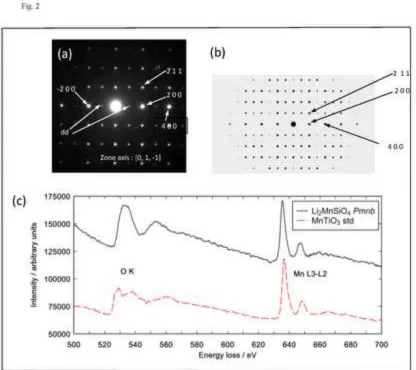
The material used in this study is a single-phase Pmnb polymorph of Li2MnSiO4 with lattice
constants a = 6.30693(2) Å, b = 10.75355(4) Å and c = 5.00863(2) Å [19]. An experimental electron
diffraction (SAED) pattern and a simulated pattern down the [0, 1, -1] zone axis are shown in Fig.2a
and b respectively. The experimental pattern shows a well-defined spot-pattern consistent with the
the simulated pattern and labelled dd are attributed to multiple scattering events. EDS results for the
sample, collected with the TEM, gave a Si: Mn ratio of 1:0.98(3) confirming the nominal
stoichiometry.
3.1.2 Electron Energy-Loss Spectroscopy (EELS)
The EELS spectra of the as-prepared Li2MnSiO4 (Pmnb) and a MnTiO3 (Mn2+) standard (Fig.2 c)
show well-defined peaks associated with the O-K edge (525-560 eV) and the Mn L3 and L2 edges
(630-660 eV). The intensity axis shows nominal values with the spectra displaced vertically for
clarity. The energy loss and L3/L2 intensity ratios of the as-prepared sample agree well with the data
for the Mn2+ standard and with results reported for Mn2+ oxides (Fig. 2 (c) and Table 1) [22, 32,33],
confirming the Mn2+ oxidation state.
3.2 Electrochemically delithiated Li2MnSiO4
3.2.1 Electrochemical cycling and delithiation of Li2MnSiO4
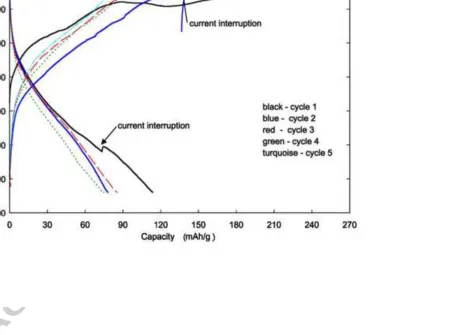
The Li/Li2MnSiO4 cell used for the preparation of the delithiated cathodes (Fig. 3) gives a capacity
of 254 mAhg-1 on the first charge cycle and 113 mAhg-1 on the first discharge to 1.8 V. The initial
charge capacity agrees well with that reported earlier for the Pmnb material [19] but the first
discharge capacity is much larger. The increase in the discharge capacity may be due firstly to the
increased carbon content of 20% as opposed to 13% in the earlier experiments, secondly an increase
in milling time from 1 h to 2h and lastly to the lower current rate of 5mAg-1 compared to the 20 mAg
-1
rate reported earlier [19]. The large irreversible capacity on the first cycle may be explained by the
fact that some of the initial charge capacity is likely due to side reactions of the electrode material
with the electrolyte or electrolyte decomposition at the high voltages reached on charge. On the
cycles, improves the discharge capacity on the 3rd cycle to 85 mAhg-1 but the capacity continues to
decline on the 4th cycle (75 mAhg-1). The discontinuities in the 2nd charge and 1st discharge curves
(Fig. 3) are due to unavoidable short current interruptions during the cell cycling procedure.
Detailed investigations of the Pmn21 polymorph of Li2MnSiO4 as a cathode in Li/Li2MnSiO4 cells
have shown that the material loses crystallinity with cycling resulting in a collapse of the crystal
structure and eventual amorphization [3, 4, 20, 21]. The observed capacity fade of the Pmn21
polymorph cathodes when cycled in Li/Li2MnSiO4 cells has been attributed to this mechanism.
Earlier reports of SAED of partially delithiated Li2MnSiO4 cathodes with the Pmn21 structural form
showed evidence for non-uniform amorphization. From these results it was suggested that lithium
extraction from this polymorph was non-uniform and a phase separation model for lithium extraction
was proposed [20]. However, no direct evidence was given for non-uniform delithiation. In this
study SAED and EELS analysis of the charged Pmnb Li2MnSiO4 cathode material was undertaken
to investigate whether amorphization occurs in the Pmnb form and whether there is any direct
evidence for non-uniform lithium extraction in this case.
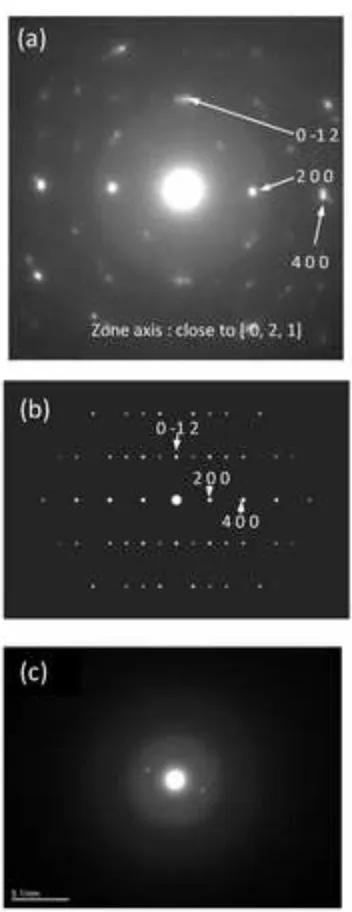
3.2.2 SAED and EDS
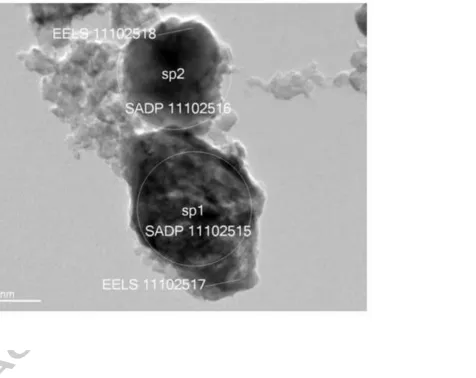
Fig. 4 (a) and (c) show the experimental SAED patterns of two adjacent particles in the charged
Pmnb electrode TEM sample shown in the bright field image in Fig. 5. Note that, although the
particles were adjacent in the TEM image, the original position of the particles in the electrode itself
cannot be determined as the sample was removed from the current collector and dispersed in solvent
during the TEM sample preparation procedure. The first pattern is typical of an essentially crystalline
material, although the crystallinity is markedly reduced compared to the as-prepared sample (Fig
Pmnb form of Li2MnSiO4 with the [0, 2, 1] zone axis is shown if Fig. 4(b) for comparison. The
second experimental SAED pattern (Fig 4 (c)) is typical of material that has been mostly
amorphized − showing only two remaining well-defined spots from the residual crystalline phase and
diffuse diffraction rings due to the amorphous component. These results show that, in agreement
with the findings for the Pmn21 polymorph [20], there is a non-uniform loss of crystallinity when Li
is extracted from the Pmnb form of Li2MnSiO4.
Li is not detectable by EDS, however the measured Mn:Si ratio of the crystalline and amorphous
particles was 0.996 and 1.007, respectively. This is in close agreement with the nominal 1:1
stoichiometry for both particles.
3.2.3 EELS analysis
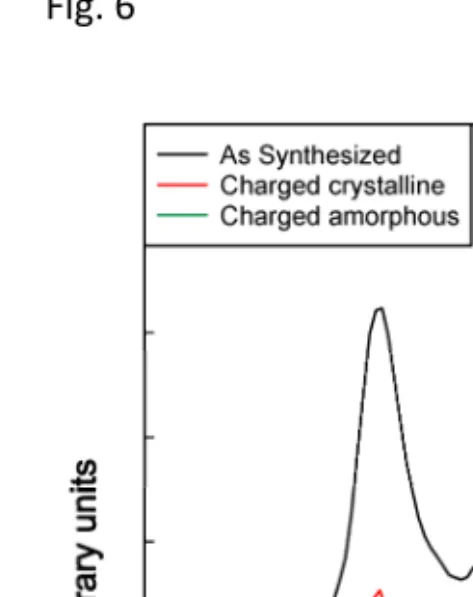
The EELS spectra of the Mn L2/3 edges of the as-synthesized sample and the two charged particles
are compared in Fig. 6 and Table 1. The energy scale has been shifted so that the L3 peaks are
aligned. The intensity axis is nominal and the intensities are normalized to the intensity of the L3
peak maximum and displaced vertically for clarity. It is found that the Mn L3/L2 intensity ratio
decreases in the charged particles indicating an increase in the Mn oxidation state [29, 30]. The
more crystalline charged particle (particle 1) has a larger Mn L3/L2 intensity ratio than the
amorphous particle (particle 2), consistent with a lower oxidation state of Mn in the crystalline
particle. This gives the first direct evidence of the non-uniform extraction of lithium from the Pmnb
form of Li2MnSiO4. Some particles are preferentially delithiated, becoming amorphous more
rapidly, while other particles, with higher lithium content, partially retain their crystallinity. The
current rate of 5mA/g used for the electrochemical cycling of the cell was low but it is possible that
EELS measurements will be conducted in future studies to confirm the differences in Li content of
particles with different degrees of crystallinity.
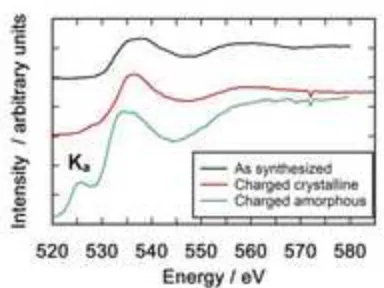
The fine structure of the O-K edges in the as-prepared, charged crystalline and charged amorphous
particles (Fig. 7) shows considerable changes with Li extraction. The Ka peak at approximately 525
eV is completely absent in the as-prepared Li2MnSiO4 material, very poorly defined in the charged
crystalline material and well-defined in the charged amorphous particle. The intensity of the
pre-peak increases significantly with lithium extraction - the charged crystalline particle with a lower
manganese oxidation state has a low intensity pre-peak while the charged amorphous particle with a
higher manganese oxidation state has a far more intense pre-peak. This peak has been attributed by
some authors to the transition of the O 1s electron to O 2p orbitals `hybridized with manganese 3d
orbitals [32]. The number of available holes in the O 2p states depends on the degree of orbital
hybridization with adjacent atoms. An increase in the pre-peak intensity implies more hybridization
between oxygen and the surrounding atoms and an increase in the covalent nature of the bonds. One
possible explanation is that, when Li is extracted from Li2-xMnSiO4 particles, charge compensation
occurs firstly by oxidation of the Mn2+ cations. However, in highly delithiated particles, in addition
to the oxidation of the Mn, charge compensation occurs by increased hybridization of the O-Mn
bonds and a resulting decrease in the charge density around the O ions. Similar effects have been
observed with the delithiated oxides LiNi⅓Mn⅓Co⅓O2 [34], LiNi0.8Co0.2O2 [35] and LiCoO2 [36].
However, studies by Jiang et al.[37] on silicate glasses have shown that the O K-edge pre-peak in
their samples was not an intrinsic property of the material but was related to beam damage of the
samples. Extended exposure to the beam resulted in an initial increase in the O K-edge pre-peak
followed by a rapid decrease in its intensity. In this study several measurements were made on each
particle and no systematic changes in the O K-edge pre-peak were observed during the process
explanation for the observed changes in the O K-edge in this case but systematic studies of beam
damage with increasing exposure time are required to completely exclude this possibility.
The energy separation of the L3 and the O-Ka peak maxima, which has been shown to be an accurate
measure of the oxidation state of manganese oxides in the 3+ to 4+ range [38], yields a calculated
average manganese oxidation state of 3.5 for a typical amorphous delithiated Li2MnSiO4 particle.
This finding was repeated with other amorphous particles. It was not possible to calculate the Mn
oxidation state for the crystalline particles in this way as the O-Ka edge is absent or poorly defined in
Li2-xMnSiO4 samples with low Mn oxidation states (Fig 7).
4. Conclusions
In this study SAED and EELS analyses of Li2MnSiO4 and charged LixMnSiO4 samples (x<1) with
the Pmnb structural form were performed. It was found that electrochemical extraction of lithium
from the Li2MnSiO4Pmnb polymorph leads to non-uniform amorphization as observed for the
Pmn21 form [20]. Some particles are almost completely amorphized while others retain significant
crystallinity even after 5 charge cycles. The EELS data confirmed that the non-uniform loss of
crystallinity was due to non-uniform lithium extraction in the Pmnb form of Li2MnSiO4. The
observed changes in the O K-edge of the delithiated samples also suggest the possibility that not all
the charge compensation for lithium extraction occurs by oxidation of the Mn cations but that the O
anions play a role in charge compensation in highly delithiated particles. Further studies are needed
to completely exclude the possibility that some of the observed changes in the O-Kedges are due to
sample damage from extended exposure to the beam.
This study has shown that, as with the Pmn21 polymorph of Li2MnSiO4, the crystal structure
the Li ion diffusion pathways and this is the most likely explanation for the observed decrease in the
discharge capacity with cycling.
Acknowledgements
AINSE is thanked for support for this research project under grant ALNGRA11120.
References
[1] V.V. Politaev, A.A. Petrenko, V.B. Nalbandyan, B.S. Medvedev, E.S. Shvetsova, J Solid State Chem,
180 (2007) 1045-1050.
[2] M.S. Islam, R. Dominko, C. Masquelier, C. Sirisopanaporn, A.R. Armstrong, P.G. Bruce, J Mater
Chem, 21 (2011) 9811-9818.
[3] R. Dominko, M. Bele, A. Kokalj, M. Gaberscek, J. Jamnik, J Power Sources, 174 (2007) 457-461.
[4] R. Dominko, J Power Sources, 184 (2008) 462-468.
[5] R. Dominko, Silicates and titanates as high-energy cathode materials for Li-ion batteries, in:
K.D. Nibir, S.W. Priyalal, K.D. Achyut (Eds.), SPIE, 2010, pp. 76830J.
[6] V. Aravindan, K. Karthikeyan, S. Ravi, S. Amaresh, W.S. Kim, Y.S. Lee, J Mater Chem, 20
(2010) 7340-7343.
[7] W.G. Liu, Y.H. Xu, R. Yang, Rare Metals, 29 (2010) 511-514.
[8] W.G. Liu, Y.H. Xu, R. Yang, J Alloys Compnds, 480 (2009) L1-L4.
[9] C. Deng, S. Zhang, B.L. Fu, S.Y. Yang, L. Ma, Mater Chem Phys, 120 (2010) 14-17.
[10] M.E. Arroyo-de Dompablo, M. Armand, J.M. Tarascon, U. Amador, Electrochem Commun, 8
(2006) 1292-1298.
[11] H. Duncan, A. Kondamreddy, P.H.J. Mercier, Y. Le Page, Y. Abu-Lebdeh, M. Couillard, P.S.
Whitfield, I.J. Davidson, Chem Mater, 23 (2011) 5446-5456.
[12] I. Belharouak, A. Abouimrane, K. Amine, J Phys Chem C, 113 (2009) 20733-20737.
[14] D.M. Kempaiah, D. Rangappa, I. Honma, Chem Commun, 48 (2012) 2698-2700.
[15] D. Rangappa, K.D. Murukanahally, T. Tomai, A. Unemoto, I. Honma, Nano Lett, 12 (2012)
1146-1151.
[16] A. Manthiram, T. Muraliganth, K.R. Stroukoff, Chem Mater, 22 (2010) 5754-5761.
[17] M.E. Arroyo-DeDompablo, R. Dominko, J.M. Gallardo-Amores, L. Dupont, G. Mali, H. Ehrenberg,
J. Jamnik, E. Moran, Chem Mater, 20 (2008) 5574-5584.
[18] G. Mali, A. Meden, R. Dominko, Chem Commun, 46 (2010) 3306-3308.
[19] R.J. Gummow, N. Sharma, V.K. Peterson, Y. He, J Solid State Chem, 188C (2012) 32-37.
[20] A. Kokalj, R. Dominko, G. Mali, A. Meden, M. Gaberscek, J. Jamnik, Chem Mater, 19 (2007)
3633-3640.
[21] Y.X. Li, Z.L. Gong, Y. Yang, J Power Sources, 174 (2007) 528-532.
[22] F. Cosandey, Analysis of Li-ion Battery Materials by Electron Energy Loss Spectroscopy, in: A.
Mendez-Vilas, J. Diaz (Eds.) Microscopy: Science, Technology, Applicationss and Education,
2010.
[23] Y. Shiraishi, I. Nakai, K. Kimoto, Y. Matsui, J Power Sources, 97-8 (2001) 461-464.
[24] N.M. Hagh, F. Cosandey, S. Rangan, R. Bartynski, G.G. Amatucci, J Electrochem Soc, 157
(2010) A305.
[25] L. Laffont, C. Delacourt, P. Gibot, M.Y. Wu, P. Kooyman, C. Masquelier, J.M. Tarascon,
Chem Mater, 18 (2006) 5520-5529.
[26] P. Moreau, V. Mauchamp, F. Pailloux, F. Boucher, Appl Phys Lett, 94 (2009) 123111-1-3.
[27] P. Moreau, F. Boucher, Micron, 43 (2012) 16-21.
[28] N. Pereira, F. Badway, M. Wartelsky, S. Gunn, G.G. Amatucci, J Electrochem Soc, 156 (2009)
A407-A416.
[29] T. Riedl, T. Gemming, K. Wetzig, Ultramicroscopy, 106 (2006) 284-291.
[30] Z.L. Wang, J.S. Yin, Y.D. Jiang, Micron, 31 (2000) 571-580.
[31] Z. Wang, N. Dupré, L. Lajaunie, P. Moreau, J.-F. Martin, L. Boutafa, S. Patoux, D. Guyomard, J
Power Sources, 215 (2012) 170-178.
[33] J.H. Rask, B.A. Miner, P.R. Buseck, Ultramicroscopy, 21 (1987) 321-326.
[34] W.S. Yoon, C.P. Grey, M. Balasubramanian, X.Q. Yang, D.A. Fischer, J. McBreen,
Electrochem Solid St, 7 (2004) A53-A55.
[35] J. Graetz, C.C. Ahn, R. Yazami, B. Fultz, J Phys Chem B, 107 (2003) 2887-2891.
[36] J. Graetz, A. Hightower, C.C. Ahn, R. Yazami, P. Rez, B. Fultz, Elec Soc S, (2003) 12-20.
[37] N. Jiang, J.C.H. Spence, Ultramicroscopy 106 (2006) 215–219.
[38] S.L. Zhang, K.J.T. Livi, A.C. Gaillot, A.T. Stone, D.R. Veblen, Am Mineral, 95 (2010) 1741-1746.
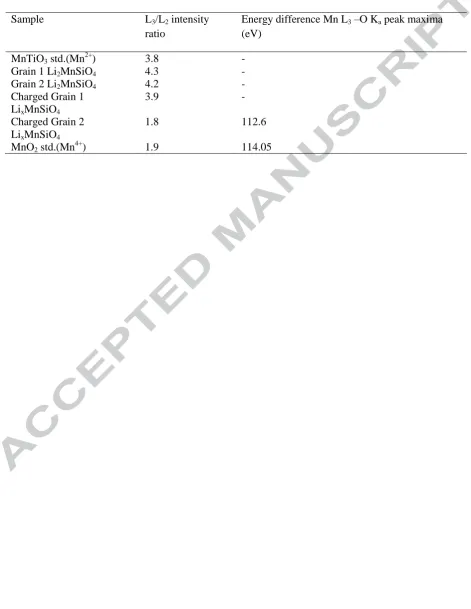
Table 1
Calculated Mn L3/L2 intensity ratio and Mn L3- O Ka peak energy difference for as-synthesized and charged Li2MnSiO4 cathodes and standard materials for comparison.
Sample L3/L2 intensity
ratio
Energy difference Mn L3 –O Ka peak maxima (eV)
MnTiO3 std.(Mn2+) 3.8 -
Grain 1 Li2MnSiO4 4.3 -
Grain 2 Li2MnSiO4 4.2 -
Charged Grain 1 LixMnSiO4
3.9 -
Charged Grain 2 LixMnSiO4
1.8 112.6
MnO2 std.(Mn4+) 1.9 114.05
Fig. 6
Figure(6)
(a)
(b)
[image:21.595.40.277.58.356.2]Highlights
• First EELS spectroscopy and electron diffraction of Pmnb polymorph of Li2MnSiO4.
• Capacity loss explained by electron diffraction results that showed a non-uniform loss of crystallinity in the delithiated material.
• Direct evidence for lithium extraction occurring non-uniformly in the cathode from EELS data.