COMMISSION OF THE EUROPEAN COMMUNITIES
Brussels, 21.1.2004 SEC(2004) 73
COMMISSION STAFF WORKING PAPER
PROGRESS TOWARDS THE COMMON OBJECTIVES IN
EDUCATION AND TRAINING
INDICATORS AND BENCHMARKS
THE REPORT IS WRITTEN WITHIN THE FRAME OF THE OPEN METHOD OF CO
-ORDINATION AND THE “DETAILED WORK-PROGRAMME ON THE FOLLOW-UP OF THE
CONTENT
EXECUTIVE SUMMARY ... 5
SECTION A : INTRODUCTION ... 8
SECTION B : PERFORMANCE AND PROGRESS OF EDUCATION AND TRAINING SYSTEMS IN EUROPE ... 16
I. IMPROVING THE QUALITY OF TEACHERS AND TRAINERS ... 17
1. Introduction ... 17
Indicators for monitoring performance and progress... 17
Quality and availability of data and indicators ... 18
2. Performance and Progress in the field of improving the quality of teachers and trainers... 18
Demography and the Teaching Profession ... 18
The Ratio of Pupils to Teaching Staff ... 20
3. Conclusion... 21
II. DEVELOPING SKILLS FOR THE KNOWLEDGE SOCIETY... 22
1. Introduction ... 22
Indicators for monitoring performance and progress... 22
Quality and availability of data and indicators. ... 23
2. Monitoring progress in the field of skills development for the knowledge society ... 24
Increasing the level of completion of upper secondary education ... 24
Developping key competencies ... 27
3. Conclusion... 32
III. INCREASING RECRUITMENT TO SCIENTIFIC AND TECHNICAL STUDIES ... 34
1. Introduction ... 34
Indicators for monitoring Performance and Progress ... 35
Quality and availability of data and indicators ... 36
2. Monitoring Performance and Progress in the field of increasing recruitment to scientific and technical studies... 36
Number of Graduates in Mathematics, Science and Technology ... 36
Student Enrolment Rates and Gender... 37
The Relative Size of Number of Graduates in Mathematics, Science and Technology... 38
3. Conclusion... 39
IV. MAKING BEST USE OF RESOURCES ... 41
1. Introduction ... 41
Indicators for monitoring performance and progress... 42
Quality and availability of data and indicators ... 42
2. Monitoring progress on making best use of resources ... 43
Public investments in education and training ... 43
Private Investments in Education and Training ... 44
Total expenditures on education per pupil/student by level of education (PPS)... 46
3. Conclusion... 48
V. OPEN LEARNING ENVIRONMENT ... 50
1. Introduction ... 50
Indicators for monitoring Performance and Progress ... 50
Quality and availability of data and indicators ... 50
2. Performance and Progress towards lifelong learning... 51
3. Conclusion... 53
VI. MAKING LEARNING MORE ATTRACTIVE... 54
1. Introduction ... 54
Indicators for Monitoring Performance and Progress... 55
Quality and availability of data and indicators ... 56
2. Performance and Progress in the field of making learning more attractive. ... 56
3. Conclusion... 59
VII. IMPROVING FOREIGN LANGUAGE LEARNING... 60
1. Introduction ... 60
Indicators for monitoring Performance and Progress ... 60
2. Performance and Progress of improving foreign language learning... 61
Number of foreign languages learned by pupils ... 61
3. Conclusion... 63
VIII. INCREASING MOBILITY AND EXCHANGE ... 65
1. Introduction ... 65
Indicators for Monitoring Performance and Progress... 66
Quality and availability of data and indicators ... 66
2. Performance and Progress in the field of Mobility ... 66
Enrolment of foreign students in tertiary education... 66
Percentage of students (ISCED 5-6) enrolled outside their country of origin... 68
Mobility within the Erasmus programme ... 69
Mobility within the Leonardo da Vinci programme ... 71
3. Conclusion... 72
APPENDIX : COMPOSITE INDICATORS ON THE PROGRESS IN EUROPE, US AND JAPAN TOWARDS THE KNOWLEDGE BASED ECONOMY ... 73
ANNEXES ... 87
ANNEX 1 : Full title of the 29 indicators for monitoring... performance and progress of education and training systems in Europe (technical definitions) ... 88
EXECUTIVE SUMMARY
The present report is a contribution to the preparation of the first joint Communication of the Commission and the Council (Education) to the European Council in 2004 reporting on progress made in improving European education and training.
Following the Conclusions of the Heads of State in Lisbon in 2000 and their endorsement of the common objectives for education and training in Europe in Barcelona, 2002, a radically new process of co-operation has been launched in the education and training areas. The overall objective is to make education and training systems in Europe a world quality reference by 2010.
This report includes an analysis of 29 indicators identified and endorsed by the Standing Group on Indicators and Benchmarks, a working group set up as part of the objectives process. This is a first attempt at establishing a statistical framework for measuring progress towards the common objectives.
The performance of the Union with regard to the five reference levels of European average performance (Benchmarks) adopted by the Council in May 2003 figure prominently in this analysis.
The report analyses performance and progress of education and training systems using 29 indicators. The analysis covers 30 European countries.
Performance and progress of education and training systems in Europe
The analysis of available data in this report provides a number of central messages on the performance and progress of educational systems in Europe.
• The demographic situation of the TEACHING PROFESSION in the Union indicates
that more than 1 million new teachers need to be recruited in primary and secondary education in order to meet replacement needs during the period 2000-2015.
• The European Union is on track to reach its objectives in relation to the
COMPLETION OF UPPER SECONDARY EDUCATION. If present trends can be sustained
there are reasons for optimism with regard to reaching the target set by the Council of 85% of 22 year olds completing upper secondary education, in 2010.
• A major effort is needed to reach the European benchmark concerning LOW
PERFORMANCE IN READING LITERACY among 15-year-olds, and decreasing the rate
by 20% in order to reach 13.7% low-performers in 2010.
• It appears from the analysis of existing data that it should be possible to achieve the benchmark set for 2010 to increase the number of GRADUATES IN MATHEMATICS, SCIENCE AND TECHNOLOGY by 15%. This entails increasing the
imbalance between the numbers of female and male graduates. Moreover the Barcelona Council (2002) specified an objective towards the Lisbon Strategy: “increasing the European Union investment in research and development (R&D) up to 3% of GDP in 2010”. This objective is an important challenge for the education and training system, especially in science and technology tertiary studies, as it implies an increase of about 50% of the total R&D personnel in the EU by 2010, as well as the replacement of the ageing population working in R&D.
• When it comes to answering the question whether the Union is on track to meet the call in the Lisbon Conclusions for a “significant yearly increase in per capita INVESTMENTS IN HUMAN RESOURCES”, one observes that public
investment in education and training (as a percentage of GDP) has shown slightly declining trends in recent years, possibly as a consequence of demographic changes. The rates of private investment in education and training are very modest in almost all Member States compared with the best-performing countries in the World.
• Reaching the European Benchmark of 12.5% of 25- to 64-year-olds participating in LIFELONG LEARNING activities by 2010 poses a significant
challenge for many European countries. It will require drawing full benefit from good practices in the participating countries.
• When it comes to ensuring a significant fall in the rate of EARLY SCHOOL LEAVERS, reaching 10% in 2010, experiences during recent years seem to
indicate that the benchmark can be reached, but it will clearly require substantial political action and sustained commitment from all countries. • At present (2000) an average of only 1.4 and 1.5 FOREIGN LANGUAGES per pupil
are taught, in general lower and upper secondary education respectively in the Member States. Major efforts will have to be made by most countries in order to reach the objective of a European average level of at least two foreign languages learned by all.
• As concerns MOBILITY of students/trainees and teachers/trainers, the
international data collection suffers from major drawbacks. However, available data suggests that significant differences exist between the percentage of foreign students in European countries. The available data also give an indication of the success of the Community programmes Socrates/Erasmus and Leonardo da Vinci, which have experienced steep increases in the number of students/trainees involved.
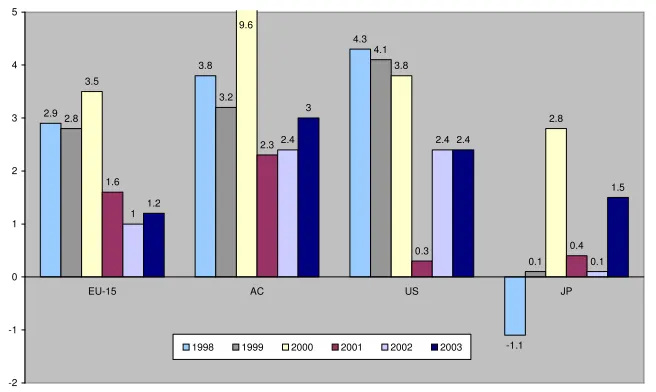
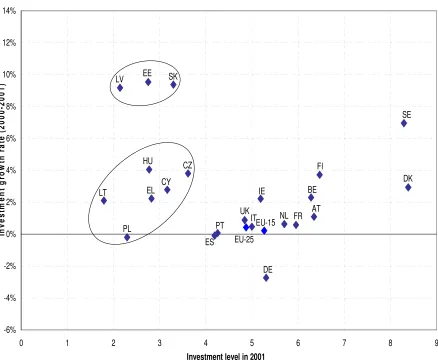
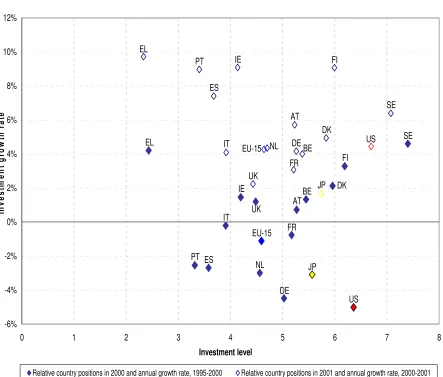
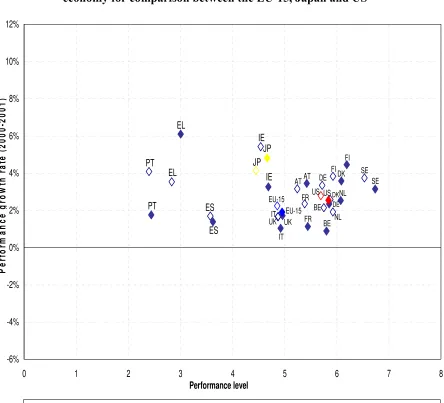
Finally, Member States’ position in terms of investment and performance in the knowledge-based economy is analysed using COMPOSITE INDICATORS. These indicators,
deteriorated. It appears that acceding countries are catching up with regard to investment in the knowledge-based economy. However, this apparently does not translate into catching up in terms of performance in the knowledge-based economy in all acceding countries. Finally, the analysis shows that the US is ahead in terms of both investment and performance in the knowledge-based economy.
Improving the quality of indicators
Indicators and benchmarks are essential for the implementation of the open method of co-ordination and for the success of the Lisbon strategy. Without valid and comparable data, Member States will lack information on how their actions support the attainment of the Lisbon objectives by 2010.
However, there is an urgent need to improve the situation in order to make the necessary data and indicators available. The analyses in this report show that the need for the development of new indicators is particularly urgent in the area of key competencies and that, within this area, learning to learn and foreign language skills are to be considered absolute priorities.
In many more areas, all central to the success of the Lisbon strategy, the present analyses show that it is necessary to obtain new data on many aspects of education and training such as, for instance, data on: private investments in education and training; continuing training of teachers and trainers; adult education and competencies; mobility of students/trainees and teachers/trainers; and data on a series of core elements of lifelong learning such as access to education and learning possibilities, guidance and the flexibility and openness of learning systems.
SECTION A
At the European Council meeting in Lisbon (2000) a whole new agenda for the European Union was announced by the Heads of State. The Union should, by 2010, become:
“..the most competitive and dynamic knowledge-based economy in the world capable of sustainable economic growth with more and better jobs and greater social cohesion”.
Moreover, the conclusions of the European Council outlined a new method of European co-operation for achieving the goal:
“Implementation of the strategic goal will be facilitated by applying a new open method of co-ordination as the means of spreading best practice and achieving greater convergence towards the main EU goals. This method, which is designed to help Member States to progressively develop their own policies, involves:
− fixing guidelines for the Union combined with specific timetables for achieving the
goals which they set in the short, medium and long terms;
− establishing, where appropriate, quantitative and qualitative indicators and
benchmarks against the best in the world and tailored to the needs of different Member States and sectors as a means of comparing best practice;
− translating these European guidelines into national and regional policies by
setting specific targets and adopting measures, taking into account national and regional differences;
− periodic monitoring, evaluation and peer review organised as mutual learning
processes.1”
The “open method of co-ordination” is inspired by economic policy co-ordination that, through the broad economic policy guidelines, has taken place since 1993 with the entry into force of the Maastricht Treaty and the preparation of the Economic and Monetary Union. Moreover, the European Employment strategy, which was launched by the Luxembourg European Council in 1997 and codified in the Amsterdam Treaty, offers another early example of the open method of co-ordination in action. In these two areas, however, the open method of co-ordination is enshrined in the Treaty, whereas the Lisbon conclusions are the only legitimisation in other policy areas. On the one hand, the open method of co-ordination defines the common outcomes or objectives in a given policy area. On the other hand, the open method of co-ordination is an instrument for identifying best policy practices, using the diversity of policy approaches in European countries as a grand reservoir of ideas for possible policy measures to achieve the agreed objectives or outcomes. The full use of indicators and benchmarks is central for the success of the method. In Brussels, March 2003, the European Council called explicitly for “using benchmarks to identify best practice” in the follow-up of the Lisbon Objectives and especially in order to ensure efficient and effective investment in human resources2.
1
Conclusions of Lisbon European Council 23/24 March 2000 - paragraph 37.
2
1. The role of Indicators and Benchmarks within the Open Method of Co-ordination
The shared European ambition of becoming the most dynamic knowledge-based economy in the world could become hollow if it did not entail measurable policy measures in areas of relevance for the overall ambition. Therefore, indicators and benchmarks are needed to make progress easily visible and to break down the overall ambition in achievable goals in different policy areas.
The Conclusions of the European Council's Spring Summits in Lisbon (2000), Stockholm (2001) and Barcelona (2002) provided a first set of messages regarding required guidelines and benchmarks for fulfilling the ambition. The Council (Education) has since further elaborated this list of guidelines and benchmarks in an ongoing process of finding relevant reference points for progress in contributing to the Lisbon ambitions by improving education and training in Europe.
The use of indicators for monitoring progress in the follow-up to the Lisbon conclusions is inherent to the process. In each one of the Commission reports to the Spring summits, the so-called Synthesis reports, an analysis is presented on progress made towards achieving the Lisbon ambition using a framework of structural indicators (including 42 indicators in 2003)3. Four of these indicators are specifically relevant for education and training. These indicators cover: “Spending on human resources”, lifelong learning, science and technology graduates and early school leavers. Due to the very large number of indicators necessary to cover the full range of policy fields involved in the follow-up to the Lisbon conclusions, efforts have been made by the Commission services and especially DG RTD and DG EAC to develop specific composite indicators on “investment in the knowledge-based economy” and “performance in the transition to the knowledge-based economy”, please see the appendix. Such indicators can in due time be applied to give an aggregated view of progress towards the Lisbon targets for the European knowledge economy.
The policy push for using indicators and benchmarks in the area of education and training became explicit in the Detailed Work Programme on the implementation of European common objectives in the field of education and training4, which provides an “indicative list” of 33 indicators and indicator areas and a standard format to be used for measuring progress within the 13 objective areas.
In addition, the work programme outlines how progress in education and training will be monitored and measured:
“On the basis of chosen indicators for each objective an interim report foreseen in 2004 and the final report foreseen in 2010 will include an evaluation of progress
3
See Communication from the European Commission on “Structural Indicators” COM (2003)585 – 8 October 2003.
4
made. Where feasible, European-wide benchmarks could be set by the Council, by consensus, within the scope of articles 149 and 150.”
Therefore, indicators are in principle used for measuring progress in all objective areas. “Benchmarks” function as reference points for where the European Union should be in 2004 and in 2010. They point to areas where special policy efforts are necessary to improve education and training in Europe.
Monitoring performance and progress regarding Education and Training within the Open Method of Co-ordination.
Indicator Present levels Progress Benchmarks
Indicator definition
Average performance (EU)
Average of 3 best performing countries (EU)
USA and Japan
Up to 2004
Up to 2010
For 2004
For 2010
Moreover, as the “model” clearly suggests, comparisons should be made to performance in the US and Japan, i.e. third countries that are considered the main “competitors” in realising the ambition of becoming the most dynamic knowledge-based economy in the world.
Indicators should, however, not be considered only in their capacity for measuring progress. Indicators should function mainly as a basis for a constructive dialogue and exchange between Member States as a tool to understand the reasons for differences in performance, so that other countries can learn from policy practices adopted by the most successful countries. Therefore, indicators can be used as an instrument for stimulating the exchange of good experience and new ways of thinking about policy approaches. Using indicators as a vehicle for the exchange of best practice within the European Union is even more relevant when considering that a number of Member States are already achieving world-best performances in a number of objective areas, whereas others are faced with serious challenges.
2. An Initial Tool for Monitoring Performance and Progress of Education and Training Systems: 29 indicators and 5 European benchmarks
The indicators used in this report have been subject to in-depth analysis and have been endorsed by the Standing Group on Indicators and Benchmarks5 – an expert group including members from all participating countries giving advice to the Commission on the use of indicators as tools for measuring progress towards common objectives and benchmarks. They have furthermore been endorsed by the relevant Working Groups set up to advice the Commission services in specific objective areas.
The point of departure for the work of the Standing Group on Indicators and Benchmarks was the indicative list of 33 indicators in the “Detailed Work Programme on the follow-up of the objectives of education and training systems in Europe6”. The mandate of the Standing Group of on Indicators and Benchmarks includes:
− Advising on the use of indicators and benchmarks within the Objectives process;
− Reviewing the existing range of data available in the light of the needs of European co-operation and policy co-ordination in the fields of education and training;
− Advising on the usability and comparability of existing indicators, and on proposals to develop new ones.
The main concern of the Standing Group on Indicators and Benchmarks has been to evaluate:
− The pertinence of the suggested indicators in relation to the objectives defined by the Council;
− The availability and relevance of data within each indicator area.
This report emphasises the role of indicators and benchmarks within the Open Method of Co-ordination in the framework of the Detailed Work Programme. The indicators and benchmarks are analysed, objective by objective, with the aim of both measuring performance and progress and pointing to examples of good policy practice by applying wherever possible data based on the 29 selected indicators within the following indicator areas:
5
This process is recorded in the report “Final list of indicators to be used in the framework of the objectives report - Results of the consultation of the Working Groups on the work of the Standing Group on Indicators and Benchmarks”.
6
Teachers and Trainers
Indicator n°1 Age of teachers
Indicator n°2 Number of young people
Indicator n°3 Ratio of pupils to teaching staff Skills for the Knowledge Society
Indicator n°4 Completion of upper secondary education
Indicator n°5 Low-performing students in reading literacy
Indicator n°6-8 Performance in reading, mathematical and scientific literacy
Indicator n°9 Participation in education or training of initially low qualified people
Mathematics, Science and Technology
Indicator n°10 Enrolment in mathematics, science and technology studies
Indicator n°11-13 Graduates in mathematics, science and technology Investments in Education and Training
Indicator n°14 Public expenditure on education
Indicator n°15 Private expenditure on educational institutions
Indicator n°16 Enterprise expenditure on continuing vocational training courses
Indicator n°17-18 Total expenditure on educational institutions per pupil/student
Open Learning Environment
Indicator n°19 Participation in lifelong learning Making Learning more Attractive
Indicator n°20-21 Participation in continuing vocational training
Indicator n°22 Participation rates in education
Indicator n°23 Early school leavers Foreign language learning
Indicator n°24 Pupils learning foreign languages
Indicator n°25 Number of foreign languages learned Mobility
Indicator n°26 Mobility of teachers and trainers
Indicator n°27-29 Mobility of students and trainees
The full title of each of the 29 indicators can be found in annex 1.
3. Adoption by the Council of Five European Benchmarks in Education and Training.
In the Communication “European benchmarks in education and training: follow-up to the Lisbon European Council”7 the Commission proposed five European benchmarks and invited the Council to adopt these benchmarks by May 2003.
Benchmarks were proposed in five areas which are central to the strategic goals set in Lisbon: Early school leavers; Graduates in mathematics, science and technology; Population having completed upper secondary education; Key competencies; and Lifelong learning. This Commission proposal was consequently followed up by Council Conclusions on European benchmarks8.
The Council set five European benchmarks for the improvement of education and training systems in Europe up to 2010:
By 2010, an EU average rate of no more than 10% early school leavers should be achieved.
The total number of graduates in mathematics, science and technology in the European Union should increase by at least 15% by 2010 while at the same time the level of gender imbalance should decrease.
By 2010, at least 85% of 22 year olds in the European Union should have completed upper secondary education.
By 2010, the percentage of low-achieving 15 year olds in reading literacy in the European Union should have decreased by at least 20% compared to the year 2000.
By 2010, the European Union average level of participation in Lifelong Learning should be at least 12.5% of the adult working age population (25-64 age group)
These European benchmarks are not concrete targets for individual countries to be reached by 2010. They are defined by the Council as “reference levels of European average performance”. National governments are invited to consider, on the basis of these benchmarks, how, and to which degree, they can contribute, so that Europe (EU-25), in 2010, has reached the set targets. It is therefore essential that the indicators corresponding to the benchmarks are included in the list of 29 indicators. The following main section of the report is divided into eight chapters, each one concentrating on areas of the thirteen Objectives of the Detailed Work Programme
7
Communication from the European Commission “European benchmarks in education and training: follow-up to the Lisbon European Council” (COM (2002) 629) 20.11.2002. See for an analysis and discussion on the use of benchmarks in the field of education and training: Jaap Scheerens, Maria Hendriks (Eds.) “Benchmarking the Quality of Education”, Study co-financed by the European Commission, Socrates programme, 2002.
8
covered by the 29 indicators and the five European benchmarks. In each chapter an analysis is made of the most recent valid and comparable data in order to evaluate the present levels of European performance. In areas where European benchmarks have been decided upon, the analysis, where possible, draws conclusions on the prospects for education and training systems in Europe of reaching the targets set by 2010.
The report analyses, where possible, data on the following countries:
European Union (EU) :
Belgium, Denmark, Germany, Greece, Spain, France, Ireland, Italy, Luxembourg, Netherlands, Austria, Portugal, Finland, Sweden, UK
Acceding Countries (ACC) :
Cyprus, Czech Republic, Estonia, Hungary, Latvia, Lithuania, Malta, Poland, Slovenia, Slovakia
Candidates Countries (CC) :
Bulgaria, Romania
European Economic Area (EEA) :
Iceland, Liechtenstein, Norway
SECTION B
PERFORMANCE AND PROGRESS OF EDUCATION AND
TRAINING SYSTEMS IN EUROPE
I. IMPROVING THE QUALITY OF TEACHERS AND TRAINERS ...17
II. DEVELOPING SKILLS FOR THE KNOWLEDGE SOCIETY ...22
III. INCREASING RECRUITMENT TO SCIENTIFIC AND TECHNICAL STUDIES ...34
IV. MAKING BEST USE OF RESOURCES ...41
V. OPEN LEARNING ENVIRONMENT...50
VI. MAKING LEARNING MORE ATTRACTIVE ...54
VII. IMPROVING FOREIGN LANGUAGE LEARNING...60
I. IMPROVING THE QUALITY OF TEACHERS AND TRAINERS
1. Introduction
The Detailed Work Programme points out that “attracting and retaining well qualified and motivated people in the teaching profession, which is faced with massive recruitment needs due to the ageing of the teaching population, is a short and medium term priority in most European countries9”. The ageing population is a general concern in the Union which has led to a series of Community initiatives due to the increasing number of retirements foreseen for the coming years in many countries. “In general, the European Union is facing a pension problem, which should be redressed by encouraging active ageing and by discouraging early retirement incentives10.”
“Efforts should be stepped up to increase opportunities for older workers to remain in the labour market, for instance, through flexible and gradual retirement formulas and guaranteeing real access to lifelong learning. A progressive increase of about 5 years in the effective average age at which people stop working in the European Union should be sought by 201011.”
These two recent declarations from the European Council regarding the problem of early retirement illustrate a key issue facing the teaching profession in Europe.
The Detailed Work Programme outlined the following four key issues:
1. Identifying the skills that teachers and trainers should have, given their changing roles in knowledge society
2. Providing the conditions which adequately support teachers and trainers as they respond to the challenges of the knowledge society, including through initial and in-service training in the perspective of lifelong learning
3. Securing a sufficient level of entry to the teaching profession, across all subjects and levels, as well as providing for the long-term needs of the profession by making teaching and training even more attractive
4. Attracting recruits to teaching and training who have professional experience in other fields
Indicators for monitoring performance and progress
Three indicators have been identified to address the issue of teachers and trainers:
Age distribution of teachers together with upper and lower retirement age
Number of young people in the 0-14 and 15-19 age groups and as percentage of
total population
Ratio of pupils to teaching staff by education level
9
The Detailed Work Programme on education and training systems page 15.
10
Presidency conclusions – Brussels, 20 and 21 March 2003 page 20.
11
Quality and availability of data and indicators
It is easy to see that these indicators do not adequately reflect the complexity of this objective area.12 First, the only indicator that policy makers can really influence in the short term is the indicator on the ratio of pupils to teaching staff. Second, the three indicators selected in this objective area measure solely issues that relate to shortages/surpluses of teachers and do not address the strategically very important area of the quality and content of teaching.
However, the increasing average age of teachers is a worrying issue taking into consideration the central role of teachers in responding to changing social and economic conditions in the knowledge economy that is in the process of being established. Although an ageing teaching profession obviously implies a relatively more experienced teaching profession, it also implies increased needs for continuing training for updating and renewing professional competencies. The quality of the teaching profession is a key subject discussed in relation to a number of Objectives such as skills for the knowledge society, mathematics, science and technology, attractiveness of education and training, foreign language learning.
These considerations lead to the conclusion that a series of new indicators need to be developed:
Indicators on teachers and trainers undergoing continuing training. Indicators on shortage/surplus of teachers.
The issue of the definition of “qualified teachers”, which varies widely between European countries, will furthermore have to be addressed as well as the recognised shortcomings with regard to clear definitions and data on “trainers”.
2. Performance and Progress in the field of improving the quality of teachers and trainers
Demography and the Teaching Profession
The number of young people in the Union is falling sharply, and has decreased by almost a quarter since 1975, from 83 million aged 0-14 in 1975 to 64 million in 1999 (see table below). This trend will not be altered by including data on the new Member States. In these countries the downward trend in the number of young people is even more pronounced.
12
Change in the numbers of young people in the 0-14 and 15-19 age groups in the European Union, from 1975 to 1999
(mio) 1975 1980 1985 1990 1995 1999
ν 82.78 76.79 70.00 66.45 65.16 63.51
ν 26.92 29.43 28.76 25.79 23.41 22.99
ν 0-14 age group ν 15-19 age group
Data source: Eurostat, population statistics.
The teaching profession itself has also to face up to demographic change. Within the Union, in many countries more than 30% of secondary teachers are older than 49 and the proportion of older teachers has been growing in recent years.
Percentage of teachers older than 49 years old, ISCED 1 and ISCED 2-3, 2000/01
ISCED 1 ISCED 2 and 3
EU BE DK DE EL ES FR IE IT LU NL AT PT FI SE UK
(:) 29.8 (:) 46.7 (:) (:) 31.1 28.9 48.7 30.7 37.1 (:) 12.1 36.1 44.6 26.0 (:) 21.4 (:) 44.9 (:) (:) 23.6 22.0 30.6 24.5 23.1 (:) 19.2 24.6 41.7 26.0
IS LI NO BG CY CZ EE HU LT LV MT PL RO SI SK
37.6 (:) 36.3 22.0 26.1 (:) (:) (:) 22.9 27.6 24.7 21.1 25.1 19.1 28.3 25.1 (:) (:) 14.5 5.1 (:) (:) (:) 20.7 21.0 33.3 14.6 (:) 17.1 28.3 Data source: Eurostat, UOE.
At lower and upper secondary level, more than 40% of teachers are older than 49 in Germany, Italy and Sweden. However, in other countries the situation is very different. In Portugal and Slovenia the percentage of teachers older than 49 is lower than 20%.
At primary level it is again in Germany and Sweden that more than 40% of teachers are older than 49 years.
recruiting new teachers replacing retiring older teachers. This is an issue further accentuated by the fact that most teachers leave the profession before “normal” retirement age13. The implications of these two factors for teacher education and recruitment are serious, particularly if combined with the difficulty which some countries experience in attracting highly qualified recruits14.
Taking into consideration that the Union presently counts some 4.5 million teachers (2001)15 in primary and secondary education, the need of recruitment into the profession to satisfy replacements amounts, during the period 2000-2015, to significantly more than 1 million new teachers.
The Ratio of Pupils to Teaching Staff
Although the ratio of pupils to teaching staff of course fluctuates exogeneously as a consequence of demographic changes in the number of pupils, it can also in many countries be subject to policy initiatives and used by policy makers to counterbalance the effect of retirement and a likely shortage of teachers.
This ratio is also an important indicator of resources devoted to education, and it is often used as a proxy for quality of teaching and learning, assuming that a smaller ratio of pupils to teaching staff means better pupil access to teaching resources. The link between the ratio of pupils to teaching staff and quality of education is nevertheless highly complex and subject to debate.
Ratio of pupils to teaching staff by educational level, 2000/01
ISCED 1 ISCED 2 ISCED 3
EU BE DK DE EL ES FR IE IT LU NL AT PT FI SE UK
(:) 9.8 13.3 19.8 11.3 11.0 10.9 (:) 10.4 (:) 17.1 9.9 8.0 17.0 16.6 18.9 (:) (:) 10.3 15.7 9.8 (:) 13.9 15.2 9.9 9.1 (:) 9.8 9.9 10.9 12.4 17.5 (:) 13.4 10.2 19.4 12.7 14.7 19.5 20.3 10.8 11.0 17.2 14.3 11.6 16.1 12.4 20.8
IS LI NO BG CY CZ EE HU LT LV MT PL RO SI SK JP US
10.9 (:) 9.2 11.3 13.6 13.1 10.3 12.5 (:) 13.2 18.1 16.8 13.3 13.8 12.9 12.4 (:) (:) (:) 10.9 13.0 15.1 14.5 11.2 11.2 12.0 13.2 9.9 13.1 14.8 13.3 14.5 15.8 (:) 12.6 (:) (:) 17.7 21.1 19.4 14.7 11.3 16.9 17.6 19.0 12.5 (:) 13.1 20.7 20.4 (:) Data source: Eurostat, UOE.
13
Eurydice, “Key Data on Education in Europe” Bruxelles, 2002 - page 142.
14
Report from the Education Council to the European Council “The concrete future objectives of education and training systems” 14 February 2001.
15
There is a lot of variation in the ratio of pupils to teaching staff across countries. It is particularly relevant to compare the ratios at ISCED level 1, where in most countries one teacher is responsible for the class. Here, Denmark Italy, Luxembourg and Portugal have pupil/teacher ratios below 12. Within the EU, France, Germany, Ireland and the UK have ratios above 18. In acceding countries' pupil/teacher ratios range from 11 in Hungary to 21 in Cyprus.
3. Conclusion
Due to the present demographic situation of the teaching profession in the Union, over 1 million new teachers in primary and secondary education will have to be recruited during the period 2000-2015 just to ensure replacements. Pupil-teacher ratios will rise in Europe, if sufficient numbers of new teachers are not recruited, notwithstanding an expected decrease in the number of pupils during the coming years.
This implies that a number of countries should have policies in place for handling this situation in terms of:
recruitment
maintaining teachers in the profession, and retirement
Successful policy practices in these areas are important issues for the exchange of experience and, where relevant, peer reviews.
Moreover, in order to remedy the current lack of data in a number of essential areas, answers should be found to the following questions:
How to measure other key issues undergoing the Detailed Work Programme including percentage of teachers and trainers in continuing training.
II. DEVELOPING SKILLS FOR THE KNOWLEDGE SOCIETY
1. Introduction
Key competencies represent a transferable, multifunctional set of knowledge, skills and attitudes that all individuals need for personal fulfilment and development, social inclusion and employment. These should have been developed by the end of compulsory school or training, and should act as a foundation for further learning as part of Lifelong Learning.
Completing upper secondary education and ensuring that an adequate level of key competencies is acquired by European citizens is extremely important in order to reach the Lisbon objectives for the European knowledge economy and knowledge society. Research demonstrates that participation in lifelong learning is closely linked to successful participation in previous education and to the skills level reached at the end of initial education.
The fundamental role of key competencies in our societies has been spelt out in the detailed work programme, which enumerates the following principal areas of basic skills
Numeracy and literacy (foundation skills),
Basic competencies in mathematics, science and technology; Foreign languages;
ICT skills and use of technology; Learning to learn skills;
Social skills;
Entrepreneurship and General culture.
The key issues that should be addressed within this area were identified as follows in the detailed work programme:
1. Identifying new basic skills, and how these skills together with the traditional basic skills can be better integrated in the curricula, learned and maintained through life
2. Making attainment of basic skills genuinely available to everyone, including those less advantaged, those with special needs, school drop-outs and to adult learners
3. Promoting official validation of basic skills, in order to facilitate ongoing education and training and employability
Indicators for monitoring performance and progress
These indicators should be read taking into account especially the benchmarks set by the Council, which cover both dimensions.
− Percentage of those aged 22 who have successfully completed at least upper
secondary education (ISCED 3).
− Percentage of adults with less than upper secondary education who have
participated in any form of education or training, in the last 4 weeks by age group
(25-34, 35-54 and 55-64).
− Percentage of pupils with reading literacy proficiency “level 1 and lower” on the
PISA reading literacy scale.
− Distribution and mean performance of students, per country, on the PISA reading
literacy scale.
− Distribution and mean performance of students, per country, on the PISA
mathematical literacy scale.
− Distribution and mean performance of students, per country, on the PISA science
literacy scale.
The indicators chosen for this area give a satisfactory coverage of the key issue relating to skills availability (making attainment of basic skills genuinely available to everyone) by taking into account completion of upper secondary education, participation in education and, most importantly, attainment levels. However it should be a priority area to develop new indicators in the field of direct skills assessment. The key issue concerning the identification of new skills does not lend itself at present to being measured through indicators but rather to being investigated through examination of good practice. The same consideration applies to the key issue on validation of basic skills.
Quality and availability of data and indicators.
“Key competencies” should be a priority area for the development of new indicators in the field of direct skills assessment both at school age and for adults. The Council has set two benchmarks in this crucial area. One of them is supported by existing data from the PISA survey. The new phases of PISA already launched ensure continuing delivery of new data until at least 2010. Such data should be comparable with the data analysed above and it will therefore be possible to measure progress in this field in the participating countries (all EU member states and an increasing number of the new Member States).
Experience with the PISA survey16 has shown that there is room for improving methodologies and analysis related to the survey in general and to the national implementation of the survey in particular, in order to reinforce the validity and the comparability of the results. Increasing the cooperation between the European participating countries could clearly support such development. Close cooperation in the field with the OECD Secretariat should be ensured as much as possible.
16
In the field of key competencies, however, we find areas where new indicators are clearly needed to support the implementation of the Detailed Work Programme in the field of education and training and the follow up of the Lisbon objectives. This appears to be especially urgent in the case of:
learning to learn competence foreign language competence
Learning to learn competence, should be considered a prerequisite for skills oriented education and training approaches. Although some attempts have been made in this field within the PISA survey, a thorough approach should be adopted in order to develop a comprehensive tool to be used across a wide age range to measure these fundamental competencies.
Measuring language competencies is the most urgent priority, in a European Union which considers language diversity one of the main assets to be maintained and further developed. The Barcelona European Council has called for the development of such an indicator and work is in progress within the Commission to ensure its development at the earliest possible point in time.
Much remains to be done also in the field of adult competences to ensure a satisfactory coverage of the skills level of the adult population. Some results will be obtained by the ALL survey and more descriptive data will be gathered through the planned Adult Education Survey. A direct assessment of skills remains however at the heart of this matter. Some initiatives are currently in the pipeline within both the OECD and the Commission. Close co-operation in this crucial area is strongly recommended.
Developing the spirit of enterprise and entrepreneurial competence has been one of the priorities in defining the package of key competences in the knowledge-based society. The Commission’s DG Enterprise has conducted a project on best procedure on education and training for entrepreneurship17 with an indicative list of possible qualitative and quantitative indicators to measure progress in teaching entrepreneurship at various levels of education. Co-operation with the working group responsible for key competencies is needed to find the best possible ways to measure progress in this area.
2. Monitoring progress in the field of skills development for the knowledge society
Increasing the level of completion of upper secondary education
Completion of upper secondary level education by the greatest proportion of people in a knowledge society is a fundamental objective within the Lisbon process. Without high levels of general education especially among the active population, the dynamism and competitiveness of the economy and the society at large would be
17
European Commission final report of the Expert Group “Best procedure” Project on Education and Training for Entrepreneurship. European Commission, November 2002. (mimeo)
jeopardized. This is why completion of upper secondary education was singled out by the Ministers for education as one of the main areas for European Benchmarks.
European Benchmark for 2010
“By 2010, at least 85% of 22 year olds in the European Union should have completed upper secondary education18
This benchmark like all five benchmarks adopted by the Council (Education) in May 2003, was defined as an “average level of European performance”. It is therefore not a target set for individual countries but a common European target of average performance. The following indicator is applied for measuring progress in the field:
Percentage of those aged 22 who have successfully completed at least upper
secondary education (ISCED 3).
The figure below shows that the target of reaching a level of completion of upper secondary level education of 85%, in 2010, for those aged 22, is a significant challenge for the Member countries. The present average level in the Union is 75.4% (2002). It should be kept in mind that while several countries have only increased these figures slightly in recent years others have made great progress, like, for instance, Portugal. It should also be noted that “upper secondary level education” (ISCED 3) covers educational strands of very different order. As it can be seen in the Annex to this report, “ISCED 3” education covers both upper secondary education that gives access to a higher educational strand (ISCED 3A and 3B giving access to 5A and 5B respectively) and an upper secondary education strand, ISCED 3C, that does not give such access. In some countries “upper secondary level education” includes a relative high proportion of ISCED 3C that does not give access to higher education (ISCED 5). This is for example the case in France, Poland, Slovenia and the UK.
Completion of upper secondary education
Indicator: Percentage of those aged 22 who have successfully completed at least upper secondary education (ISCED 3), 2002
European Union
Acceding countries European Union + Acceding countries
Japan
United States
Data source: Eurostat, Labour force survey. Additional note : - Malta= Data not available.
- In the European Union average, UK is not included. A definition of upper secondary school competion ha s to be agreed
18
Indicator: Percentage of those aged 22 who have successfully completed at least upper secondary
Over three-quarters of young people (75.4%) in the Union have successfully completed upper secondary education. On average, in the Union and the acceding countries, almost 79% of 22-year-olds have successfully completed at least upper secondary education. No comparable data exist presently in the field as concerns Japan and the US.
Several EU countries are at present achieving completion rates beyond 80% (see table below) such as Austria, Belgium, France, Greece, Ireland, Finland and Sweden. Conversely, Portugal has the lowest percentage among the Member States, 45%, a level that should however be seen in the context of its rapid growth during recent years.
As regards the acceding countries we observe in all of these a completion rate for upper secondary education that lies around the EU average figure or above. In fact most new member countries perform much better than the EU-15 average level in the field. The cases of Slovakia (94.6%), the Czech Republic (93.4%) and Poland (91.0%) are especially noteworthy. The average level of completion of upper secondary level education (22 years olds) in the new acceding countries, is thus 90.1 which is already above the target set for the Union for 2010.
As mentioned in the introduction to this chapter, completion of upper secondary education by the greatest possible proportion of young people is central to meeting the challenges of the Lisbon objectives. The Council has set a European Benchmark of 85% of 22 year olds completing upper secondary education by 2010, a target that can be considered as being fully attainable especially when new member countries enter the Union. Present trends in the field give reason for optimism. The Union can reach the target set for 2010 in the field if present trends are continued and even reinforced by the exchange of experiences and peer review of good policy practices.
Percentage of those aged 22 who have successfully completed at least upper secondary education (ISCED 3), 2002
,
BE DK DE EL ES FR IE IT LU NL AT PT FI SE UK
82.6 66.8 77.4 82.1 66.6 82.9 85.6 72.9 74.2 73.9 86.5 44.9 87.3 89.3 (:) ,
EU ACC EU + ACC CY CZ EE HU LT LV PL SI SK
75.4 90.1 78.7 86.9 93.4 89.2 87.2 83.5 71.2 91.0 88.1 94.6 Data source: Eurostat, Labour force survey, 2002.
Additional note : UK is not included. A definition of upper secondary school competion has still to be agreed
If we analyse the more complete "Structural indicator" on "Educational attainment (20-24)", based on the educational attainment of the percentage of the population aged 20-24 having completed at least upper secondary education, and we compare it with the previous one, we note some differences.
Youth education attainment level - Total - Percentage of the population aged 22 and 20 to 24 having completed at least upper secondary education, 2002
,
aged 22 aged 20-24
BE DK DE EL ES FR IE IT LU NL AT PT FI SE UK
82,6 66,8 77,4 82,1 66,6 82,9 85,6 72,9 74,2 73,9 86,5 44,9 87,3 89,3 (:) 81,1 79,6 73,3 81,3 64,9 81,7 83,9 69,1 69,8 73,3 85 43,7 86,2 86,7 77,2*
UE ACC UE+ACC BG CY CZ EE HU LT LV MT PL RO SI SK
75,4 90,1 78,7 (:) 86,9 93,4 89,2 87,2 83,5 71,2 (:) 91 (:) 88,1 94,6 73,8* 87,9 76,6* 77,5 85,3 91,7 80,4 85,7 79,3 73,2** 39** 88,1 75,3 90 94 Data source: Eurostat, Labour force survey.
Additional notes : * : Provisional data ** : Break in series
The differences relate to the performances of individual countries (e.g.: Denmark) and this confirms the limited validity of this indicator.
The trends shown by the previous indicator appear however unchanged. The position of the acceding countries comes out as even more favourable in relation to the benchmark and in general a slightly more positive outlook can be detected looking at the wider age range throughout Europe.
Percentage of adults with less than upper secondary education who have participated in any form of education or training, in the last 4 weeks
by age group (25-34, 35-54 and 55-64), in the European Union, from 1995 to 2002
% 1999 2000 2001 2002
µ 4.6 4.9 5.0 4.3
λ 2.3 2.3 2.2 2.3
λ 0.9 1.0 1.0 1.0
µ 25-34 age group λ35-54 age group λ 55-64 age group Data source: Eurostat, Labour force survey.
Additional note:
This indicator complements the previous one by showing a considerable increase in participation in education and training. The increase is particularly noticeable in participation in the younger group and can therefore be interpreted as a positive sign for the development of lifelong learning. It remains to be seen whether these trends will steadily increase in order to ensure that the benchmark adopted in the area of lifelong learning is achieved.
Developing key competencies
The second set of indicators linked to the area of “skills for the knowledge society” relates specifically to the measurement of attainment levels. At present, the most reliable comparable indicator of key competencies is provided by the OECD PISA 2000 survey that covers the proficiency levels in reading literacy, for 15-year-olds. Up to now, PISA 2000 can be considered the most comprehensive output survey in this complex area. These data can therefore be considered reliable proxies for measuring some of the foundation “skills for the knowledge society”.
All individuals need a core set of knowledge, skills and attitudes for employment, social inclusion, subsequent learning and personal fulfilment and development. The PISA 2000 survey makes it possible for us to identify population groups who are inadequately prepared for such challenges and for lifelong learning as regards the foundation competencies such as literacy and mathematics. It is on the bases of such considerations that the Ministers for Education adopted a specific benchmark targeting low performance in reading literacy.
European Benchmark for 2010
By 2010, the percentage of low-achieving 15 years old in reading literacy in the European Union should have decreased by at least 20% compared to the year 2000.
This benchmark, adopted by the Council in May 2003, is based on an indicator taken from the PISA survey and in particular on the percentage of pupils with reading literacy proficiency at level 1 and lower in the PISA reading literacy scale.
Key Competencies
Indicator : Percentage of pupils with reading literacy proficiency level 1 and lower in the PISA reading literacy scale, 2000
European Union
Acceding countries European Union + Acceding countries
Japan
United States
Data source: OECD, PISA 2000 database.
Explanatory note
By 2010, the percentage of low-achieving 15 years old in reading literacy in the European Union should have decreased by at least 20% compared to the year 2000.
Each proficiency level is associated with certain tasks which students at this proficiency level are assumed to be able to complete. Students who have reached the highest level (5) are expected to be capable “of completing sophisticated reading tasks, such as managing information that is difficult to find in unfamiliar texts” or “ being able to evaluate critically and build hypotheses” (OECD, 2001). At the lowest level (1) of proficiency, students are capable of “completing only the least complex reading tasks developed for PISA, such as locating a single piece of information, identifying the main theme of a text, or making a simple connection with everyday knowledge” (OECD, 2001).
The analysis of the PISA results shows that a certain proportion of pupils in all countries participating in the survey do not reach even the lowest “proficiency level (1)”. While performance at level 1 or below cannot be directly equated with illiteracy it is safe to assume that students at this level of attainment will experience serious difficulties when dealing with written information and thus with any learning process dependent upon written material.
Finland, Netherlands19, Austria, Ireland, Sweden and UK all have less than 15% of 15 year olds that are low-performers in the sense of the PISA reading literacy survey. But other countries of the Union experience higher proportions of pupils in this category. In Germany, Portugal and Greece more than 20% are low performers according to the survey. In this field, the performance of some candidate countries, where the proportion of low performers reaches more than 40% (e.g.: Bulgaria) calls on our attention. As concerns the performance in third countries one notices that Japan, where the proportion of low performers is as low as 10.1 of 15 year olds is on a par with some of the highest-performing countries in Europe, whereas the US with 17.9% is performing less well than the present EU average level.
The table below shows that, on average, some 17.2% of 15 year olds are low performers in the member countries. Following the European benchmark adopted by the Council this proportion should be decreased by 20% and reach 13.7% in 2010 as a European average performance level. To reach such lower levels by 2010 will be a major challenge for many countries. It would demand that both the more and the less successful countries in the field, find ways and means for further progress, attacking the problem of low performance inreading literacy among 15 year olds. In this field it is very clear that some countries have very good experience and practices to share to the benefit of others. Looking at the present situation it is reasonable to ask which practices have been implemented in, for example, Finland and the Netherlands to make these countries so successful in limiting the proportion of low-performing 15 year olds in reading literacy.
19
“Percentage of pupils with reading literacy proficiency level 1 and lower in the PISA reading literacy scale”, 2000
EU BE DK DE EL ES FR IE IT LU NL AT PT FI SE UK
17.2 19.0 17.9 22.6 24.4 16.3 15.2 11.0 18.9 35.1 9.5 14.6 26.3 7.0 12.6 12.8
IS LI NO BG CY CZ EE HU LT LV MT PL RO SI SK JP US
14.5 22.1 17.5 40.3 (:) 17.5 (:) 22.7 (:) 30.1 (:) 23.2 41.3 (:) (:) 10.1 17.9 Source: OECD PISA 2000 database.
Whereas the distribution across proficiency levels indicates the proportion of students in each country that can demonstrate a specified level of knowledge and skills, the following indicator (The distribution and mean performance of students,
per country, on the PISA reading literacy scale) focuses on the relative distribution
Distribution and mean performance of students, per country, on the PISA reading literacy scale, 2000
σ Percentile 10 µ Mean τ Percentile 90
EU BE DK DE EL ES FR IE IT LU NL AT PT FI SE UK
mean 500 507 497 484 474 493 505 527 487 441 532 507 470 546 516 523
IS LI NO BG CY CZ EE HU LT LV MT PL RO SI SK JP US
mean 507 483 505 430 (:) 492 (:) 480 (:) 458 (:) 479 428 (:) (:) 522 504 Source: OECD, PISA 2000 database.
Although the testing in mathematical and scientific literacy was less comprehensive in PISA 2000 than the one on reading literacy, these two indicators provide additional information about the skills acquired by 15 year old students. (See the Annex table 1.2 C-E)
recruitment to scientific and technical studies and to identify good practice in these very relevant areas.
Many countries achieved similar results in reading, mathematical and scientific literacy. There are, however, some exceptions. Denmark, Hungary and Japan are among the countries that show better performances in mathematical than in reading literacy. Countries with relative strength in reading rather than in maths are Finland, Greece, Ireland, Italy and Sweden. In the comparison between reading and scientific literacy, we note that Austria, the Czech Republic, Hungary and the United Kingdom perform better in science than in reading literacy, while the opposite relates to countries such as Belgium, Finland, and Ireland.
Numeracy and literacy (foundation skills) as well as basic competencies in mathematics, science and technology are all included in the list of key competencies. High attainment levels in one of these areas, but not in others, in specific countries, could point, on a national level, to experiences and good practices that could be applied to improve overall performance.
3. Conclusion
The two European benchmarks that have been adopted by the Council in this field to identify levels of European average performance for 2010: “completion of upper secondary education” and “attainment levels in reading literacy” highlights the vital importance of this area. The analysis that we have presented above shows that the European Union is on track to reach its objectives in relation to the completion of upper secondary education. The European benchmark set by the Council of reaching 85% of 22 year olds completing upper secondary education by 2010 as European average performance is a target that can be achieved, especially when the new member countries enter the Union.
The objective concerning “new skills” or “key competencies” as defined by experts, is one of the cornerstones in the education and training strategy for the achievement of the Lisbon objectives. Without sufficient levels of key competencies, including necessary skills, attitudes and knowledge, Europe will not be able to answer the challenges of the knowledge society.
The search for good practice should not be limited to Europe either. In our analysis we highlighted the cases of Finland, but also of Japan, which show that it is possible to combine high performance standards with an equitable distribution of learning outcomes among pupils. Other countries could learn what practices are behind such success stories.
The area of “key competencies“ will clearly be one of the central areas where new indicators need to be developed. Further developments are needed in the areas of adult competencies and entrepreneurship and, as stated above, indicators in following fields will have to be considered absolute priorities in this context:
Adult competencies
III. INCREASING RECRUITMENT TO SCIENTIFIC AND TECHNICAL STUDIES
1. Introduction
The issue of increasing recruitment to scientific and technical studies has been emphasised on numerous occasions in various settings. In the Detailed Work Programme, for instance, it is stressed that:
“Scientific and technological development is fundamental for a competitive knowledge society.[…]. All citizens need a basic understanding of mathematics,
science and technology. If Europe is to maintain, let alone to improve, its position in
the world, and to meet the Lisbon targets, it must do more to encourage children and
young people to take a greater interest in science and mathematics […]20.”
Moreover, by adopting on 5 May 2003 a benchmark in this area, the Council wanted to underline that it was willing to put action behind these words. In its Conclusions on European Benchmarks, the Council made reference to the necessity of an adequate output of scientific specialists in order for Europe to become the most dynamic and competitive knowledge-based economy in the world. Moreover, it underlined that the education of these specialists was all the more important in the light of the Barcelona European Council goal of increasing the overall spending on research and development (R&D) with the aim of approaching 3% of GDP by 201021. The Communication (COM(2003)226 final) “Investment in research: an action plan for Europe” evaluates the future needs in R&D personnel in 2010, which implies the need of new skilled persons: an increase of 1.2 million R&D personnel, of which 700 000 researchers, is foreseen. Education and training systems have to be aware of the efforts which are necessary to provide the number of graduates and PhDs who will make their career in research. In order to reach this objective, it is recognised inter alia that more women are needed in the scientific and technological professions22. The actual benchmark reads23:
European Benchmark for 2010
The total number of graduates in mathematics, science and technology in the European Union should increase by at least 15% by 2010 while at the same time the level of gender imbalance should decrease.24
20
The Detailed Work Programme on the Follow-up of the objectives of education and training systems in Europe, op.cit.
21
See European Commission “Third European Report on Science and technology Indicators, 2003” Dg RTD, Bruxelles, 2003.
22
European Commission, “She Figures 2003” OPOCE, Luxembourg, 2003, 118pp. ISBN: 92-894-5812-7
23
Council conclusions of 5 May 2003 on reference levels of European average performance in education and training (Benchmarks) (2003/C 134/02).
24
Indicator: “Total number of tertiary (ISCED 5A, 5B and 6) graduates from mathematics, science and
The European Council has also emphasised that “Special attention must be given to ways and means of encouraging young people, especially women, in scientific and technical studies as well as ensuring the long-term recruitment of qualified teachers in these fields25”.
However, it is interesting to note that Europe “produces” more science graduates (PhDs)than the United States but has fewer researchers in the labour market. The way in which research careers are structured and organised in Europe, does not allow Europe to fully exploit its potential in this field. The Commission has analysed26 the structural weaknesses which condition and shape research careers in Europe and these, together with the different administrative, cultural, geographical and legal environments in which researchers work, prevent the development of proper career perspectives at European level as well as the emergence of a real employment market for researchers in Europe. In order to overcome this, the Commission has proposed a range of concrete measures aimed at providing a better overall coordination of efforts in favour of the recognition of the researcher’s profession in Europe thus establishing the dynamics for a European labour market for researchers.
In the Detailed Work Programme, four key issues are enumerated:
1. Increasing the interest in mathematics, science and technology from an early age 2. Motivating more young people to choose studies and careers in the fields of
mathematics, science and technology in particular research careers and scientific disciplines where there are shortages of qualified personnel, in a short- and medium-term perspective, in particular through the design of strategies for educational and vocational guidance and counselling
3. Improving gender balance among people learning mathematics, science and technology
4. Securing a sufficient numbers of qualified teachers in mathematics and scientific and technical subjects
Indicators for monitoring Performance and Progress
The following indicators have been selected to monitor progress in the area:
Students enrolled in mathematics, science and technology as a proportion of all
students in tertiary education (ISCED 5A, 5B and 6)
Graduates in mathematics, science and technology (ISCED 5A, 5B and 6) as
percentage of all graduates (ISCED 5A, 5B and 6)
Total number of tertiary (ISCED 5A, 5B and 6) graduates from mathematics,
science and technology fields
Number of tertiary graduates in mathematics, science and technology per 1000
inhabitants aged 20-29 - Broken down by ISCED levels 5A, 5B and 6
The selected indicators, which are all to be broken down by sex, mainly cover key issue 3 i.e. improving the gender balance. However, key issues 1 and 2 (i.e. increasing
25
Stockholm European Conclusions of 23/24 March 2001.
26