IMPACT TEST SIMULATION WITH DIFFERENT VELOCITY
USING FEA FOR BUMPER CAR
This report is submitted in accordance with requirement of the Universiti Teknikal Malaysia Melaka (UTeM) for the Bachelor Degree of Mechanical Engineering
(Structure and Material)(Hons.)
By
SYED HAFIZ IFWAT BIN WAN KASSIM
B041410021
930512-13-6333
DECLARATION
I hereby, declared this report entitled “Impact Test Simulation with Different Velocity Using FEA for Bumper Car” is the results of my own research except as cited in
references.
Signature : ………..
Author’s Name : SYED HAFIZ IFWAT BIN WAN KASSIM
APPROVAL
This report is submitted to the Faculty of Mechanical Engineering of Universiti Teknikal Malaysia Melaka (UTeM) as a partial fulfilment of the requirements for the degree of Bachelor of Mechanical Engineering (Structure and Material) (Hons.). The member of the
supervisory is as follow:
i
ABSTRAK
ii
ABSTRACT
iii
DEDICATION
To my beloved father,
Wan Kassim Bin Haji Tuanku Taibu, My beloved mother,
Normardiah Binti Mohd Musa, My precious sisters,
Sharifah Zalikha Izzati Binti Wan Kassim, Sharifah Athirah Izyan Binti Wan Kassim, And my dearest brother,
iv
ACKNOWLEDGEMENT
In the name of ALLAH, the most gracious, the most merciful, with the highest praise have given me the opportunity to complete this final year project successfully without any difficulties.
I am deeply indebted to my supervisor, Dr Mohd Basri Bin Ali for his kind supervision, great advice, meaningful guidance and helpful support as well as exposing me with valuable experiences throughout this entire final year project.
Furthermore, I would like to dedicate my appreciation towards the lecturers of Faculty of Mechanical Engineering (FKM) whom have wholeheartedly provided assistance in terms of their teachings and advice to assist me in the progress of this final year project.
v
TABLE OF CONTENT
Abstrak i
Abstract ii
Dedication iii
Acknowledgement iv
Table of Contents v
List of Tables viii
List of Figures xi
List of Abbreviations xvi
List of Symbols xvii
CHAPTER 1: INTRODUCTION 1
1.1 Background of Study 1
1.2 Problem Statement 4
1.3 Objectives 5
1.4 Scope Of Project 5
CHAPTER 2: LITERATURE REVIEW 6
2.1 Car Bumper System 6
2.1.1 Bumper Beams 7
2.1.2 Fascia 8
2.1.3 Energy Absorber 8
2.2 Impact Mechanics 9
2.2.1 Low Speed Impact Test 9
2.2.2 High Speed Impact Test 11
2.3 Conservation of Energy 11
vi
2.5 Mesh Size 17
CHAPTER 3 : METHODOLOGY 18
3.1 Project Planning 18
3.2 Relationship Between Objectives and Methodology 20
3.3 Identifying the Problems 21
3.4 Direction of Impact 23
3.5 Material Selection 25
3.6 Velocity Selection 26
3.7 Meshing Size 27
3.8 Abaqus Software Simulation 28
CHAPTER 4: RESULTS & DISCUSSION 33
4.1 Meshing Sizes and Elements 33
4.1.1 Number of Elements Generated 36 4.2 Impact Test Results for 15 mm Mesh Size 37
4.2.1 Velocity of 70 km/h 37
4.2.2 Velocity of 90 km/h 47
4.3 Impact Test Results for 18 mm Mesh Size 57
4.3.1 Velocity of 70 km/h 57
4.3.2 Velocity of 90 km/h 66
4.4 Impact Test Results for 20 mm Mesh Size 76
4.4.1 Velocity of 70 km/h 76
4.4.2 Velocity of 90 km/h 85
4.5 Theoretical Approach and Results Comparison with Simulation 94 4.6 Comparison of Impact Test Simulation and Previous Studies 116
CHAPTER 5: CONCLUSION & FUTURE WORK 120
vii
REFERENCES 123
viii
LIST OF TABLES
TABLE TITLE PAGE
2.1 Design Criterion 11
2.2 Results Obtained Through Impact Simulation (Vani and
Jayachandraiah, 2015) 16
3.1 Relationship between Objectives and Methodology 20
3.2 Mechanical Properties of Chosen Materials (H. Zainuddin et al.,
2016) 25
4.1 Different Meshing Sizes for Impactor 34 4.2 Different Meshing Sizes for Bumper System 35 4.3 Number of Element for Impactor and Bumper System 36 4.4 Node 1288 Values (15 mm Mesh Size and 70 km/h Velocity) 38 4.5 Node 1289 Values (15 mm Mesh Size and 70 km/h Velocity) 40 4.6 Node 1575 Values (15 mm Mesh Size and 70 km/h Velocity) 42
4.7 Minimum and Maximum Values for Internal Energy and Kinetic
Energy (15 mm Mesh Size and 70 km/h Velocity) 46 4.8 Node 1288 Values (15 mm Mesh Size and 90 km/h Velocity) 47 4.9 Node 1289 Values (15 mm Mesh Size and 90 km/h Velocity) 49 4.10 Node 1575 Values (15 mm Mesh Size and 90 km/h Velocity) 51
4.11 Minimum and Maximum Values for Internal Energy and Kinetic
ix 4.14 Node 1575 Values (18 mm Mesh Size and 70 km/h Velocity) 61
4.15 Minimum and Maximum Values for Internal Energy and Kinetic
Energy (18 mm Mesh Size and 70 km/h Velocity) 65 4.16 Node 1288 Values (18 mm Mesh Size and 90 km/h Velocity) 66 4.17 Node 1289 Values (18 mm Mesh Size and 90 km/h Velocity) 69 4.18 Node 1575 Values (18 mm Mesh Size and 90 km/h Velocity) 71
4.19 Minimum and Maximum Values for Internal Energy and Kinetic
Energy (18 mm Mesh Size and 90 km/h Velocity) 75 4.20 Node 1288 Values (20 mm Mesh Size and 70 km/h Velocity) 76 4.21 Node 1289 Values (20 mm Mesh Size and 70 km/h Velocity) 78 4.22 Node 1575 Values (20 mm Mesh Size and 70 km/h Velocity) 80
4.23 Minimum and Maximum Values for Internal Energy and Kinetic
Energy (20 mm Mesh Size and 70 km/h Velocity) 84 4.24 Node 1288 Values (20 mm Mesh Size and 90 km/h Velocity) 85 4.25 Node 1289 Values (20 mm Mesh Size and 90 km/h Velocity) 87 4.26 Node 1575 Values (20 mm Mesh Size and 90 km/h Velocity) 89
4.27 Minimum and Maximum Values for Internal Energy and Kinetic
Energy (20 mm Mesh Size and 90 km/h Velocity) 93
4.28 Theoretical Reaction Force for Node 1575 (15 mm Mesh Size and
70 km/h Velocity) 96
4.29 Theoretical Reaction Force for Node 1575 (15 mm Mesh Size and
90 km/h Velocity) 98
4.30 Theoretical Reaction Force for Node 1289 (18 mm Mesh Size and
70 km/h Velocity) 101
4.31 Theoretical Reaction Force for Node 1575 (18 mm Mesh Size and
x 4.32 Theoretical Reaction Force for Node 1289 (20 mm Mesh Size and
70 km/h Velocity) 106
4.33 Theoretical Reaction Force for Node 1289 (20 mm Mesh Size and
90 km/h Velocity) 108
4.34 Theoretical and Simulation Values 111 5.1 Mechanical Properties of Carbon Fibre Composite, T300/5208
xi
LIST OF FIGURES
FIGURE TITLE PAGE
1.1 Example of a Car Bumper 2
2.1 Automotive Bumper System Component (Nizam et al., 2004) 6 2.2 Common Bumper (Davoodi et al., 2012) 8 2.3 Actual Function of Car Bumper (Jamail, 2009) 9 2.4 Simulation of Frontal Collision (Chotika et al., 2011) 10 2.5 Graph of Internal, External and Total Energy during Frontal
Impact (Chotika et al., 2011) 13
2.6 Energy Curve of the Model with the Bumper Beam Made by Steel
(Wang and Li, 2015) 14
2.7 Colliding Bodies Moving at 80 km/h (Vani and Jayachandraiah,
2015) 16
3.1 Flow Chart of Project 19
3.2 Procedures to Identify Problems 22
3.3 Isometric View of Impactor and Bumper System 23 3.4 Front View of Impactor and Bumper System 24 3.5 Top View of Impactor and Bumper System 24
3.6 Direction of Velocity in Y-Axis 26
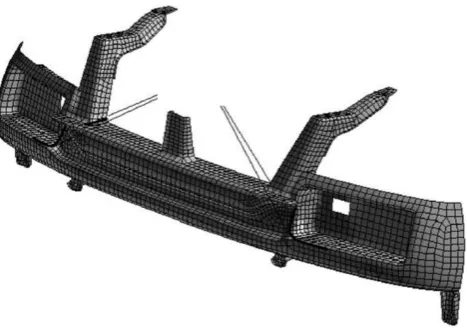
3.7 Front View of GEN 2 Bumper 27
3.8 Rear View of GEN 2 Bumper 28
xii
3.10 Applying Material Properties 29
3.11 Assembly of Imported Parts 29
3.12 Choosing the Step Time 30
3.13 Choosing the Interaction 30
3.14 Creating Boundary Condition for the Assembled Parts 31 3.15 Creating Velocity for the Impactor 31
3.16 Creating Job for Simulation 32
4.1 Graph of Number of Elements against Meshing Size 36 4.2 Area under Graph for Node 1288 (15 mm Mesh Size and 70 km/h
Velocity) 40
4.3 Area under Graph for Node 1289 (15 mm Mesh Size and 70 km/h
Velocity) 42
4.4 Area under Graph for Node 1575 (15 mm Mesh Size and 70 km/h
Velocity) 44
4.5 ReactionForce against Displacement Graph for 15 mm Meshing
and 70 km/h Velocity 45
4.6 Energy against Time Graph for 15 mm Meshing and 70 km/h
Velocity 46
4.7 Area under Graph for Node 1288 (15 mm Mesh Size and 90 km/h
Velocity) 49
4.8 Area under Graph for Node 1289 (15 mm Mesh Size and 90 km/h
Velocity) 51
4.9 Area under Graph for Node 1575 (15 mm Mesh Size and 90 km/h
Velocity) 53
4.10 Reaction Force against Displacement Graph for 15 mm Meshing
xiii 4.11 Energy against Time Graph for 15 mm Meshing and 90 km/h
Velocity 55
4.12 Area under Graph for Node 1288 (18 mm Mesh Size and 70 km/h
Velocity) 59
4.13 Area under Graph for Node 1289 (18 mm Mesh Size and 70 km/h
Velocity) 61
4.14 Area under Graph for Node 1575 (18 mm Mesh Size and 70 km/h
Velocity) 63
4.15 ReactionForce against Displacement Graph for 18 mm Meshing
and 70 km/h Velocity 64
4.16 Energy against Time Graph for 18 mm Meshing and 70 km/h
Velocity 65
4.17 Area under Graph for Node 1288 (18 mm Mesh Size and 90 km/h
Velocity) 68
4.18 Area under Graph for Node 1289 (18 mm Mesh Size and 90 km/h
Velocity) 70
4.19 Area under Graph for Node 1575 (18 mm Mesh Size and 90 km/h
Velocity) 72
4.20 Reaction Force against Displacement Graph for 18 mm Meshing
and 90 km/h Velocity 73
4.21 Energy against Time Graph for 18 mm Meshing and 90 km/h 74 4.22 Area under Graph for Node 1288 (20 mm Mesh Size and 70 km/h
Velocity) 78
4.23 Area under Graph for Node 1289 (20 mm Mesh Size and 70 km/h
Velocity) 80
4.24 Area under Graph for Node 1575 (20 mm Mesh Size and 70 km/h
xiv 4.25 Reaction Force against Displacement Graph for 20 mm Meshing
and 70 km/h Velocity 82
4.26 Energy against Time Graph for 20 mm Meshing and 70 km/h
Velocity 84
4.27 Area under Graph for Node 1288 (20 mm Mesh Size and 90 km/h
Velocity) 87
4.28 Area under Graph for Node 1289 (20 mm Mesh Size and 90 km/h
Velocity) 89
4.29 Area under Graph for Node 1575 (20 mm Mesh Size and 90 km/h
Velocity) 91
4.30 Reaction Force against Displacement Graph for 20 mm Meshing
and 90 km/h Velocity 91
4.31 Energy against Time Graph for 20 mm Meshing and 90 km/h
Velocity 93
4.32 Graph of Theoretical Reaction Force against Displacement for
Node 1575 (15 mm Mesh Size and 70 km/h Velocity) 97 4.33 Area under Graph for Theoretical Value of Node 1575 (15 mm
Mesh Size and 70 km/h Velocity) 97
4.34 Graph of Theoretical Reaction Force against Displacement for
Node 1575 (15 mm Mesh Size and 90 km/h Velocity) 99 4.35 Area under Graph for Theoretical Value of Node 1575 (15 mm
Mesh Size and 90 km/h Velocity) 100
4.36 Graph of Theoretical Reaction Force against Displacement for
Node 1289 (18 mm Mesh Size and 70 km/h Velocity) 102 4.37 Area under Graph for Theoretical Value of Node 1289 (18 mm
Mesh Size and 70 km/h Velocity) 102
4.38 Graph of Theoretical Reaction Force against Displacement for
xv 4.39 Area under Graph for Theoretical Value of Node 1575 (18 mm
Mesh Size and 90 km/h Velocity) 105
4.40 Graph of Theoretical Reaction Force against Displacement for
Node 1289 (20 mm Mesh Size and 70 km/h Velocity) 107 4.41 Area under Graph for Theoretical Value of Node 1289 (20 mm
Mesh Size and 70 km/h Velocity) 107
4.42 Graph of Theoretical Reaction Force against Displacement for
Node 1289 (20 mm Mesh Size and 90 km/h Velocity) 109 4.43 Area under Graph for Theoretical Value of Node 1289 (20 mm
Mesh Size and 90 km/h Velocity) 110
4.44 Comparison Graph between Theoretical and Simulation for Node
1575 (15 mm Meshing and 70 km/h) 112
4.45 Comparison Graph between Theoretical and Simulation for Node
1575 (15 mm Meshing and 90 km/h) 112
4.46 Comparison Graph between Theoretical and Simulation for Node
1289 (18 mm Meshing and 70 km/h) 113
4.47 Comparison Graph between Theoretical and Simulation for Node
1575 (18 mm Meshing and 90 km/h) 113
4.48 Comparison Graph between Theoretical and Simulation for Node
1289 (20 mm Meshing and 70 km/h) 114
4.49 Comparison Graph between Theoretical and Simulation for Node
1289 (20 mm Meshing and 90 km/h) 114
4.50 Three-Point Bending Crash Test with Experimental Results
Compared with Abaqus Simulation (N. Tanlak et al., 2015) 117 4.51 Energy Curve of Bumper Made by Steel Compared with Abaqus
Simulation (Wang and Li, 2015) 118
4.52 Reaction Force for Lightweight Frontal Bumper Compared with
xvi
LIST OF ABBEREVATIONS
NHTSA National Highway Traffic Safety Administration PP Polypropylene
3D Three Dimension
ECE Economic Commission for Europe OEM Original Equipment Manufacturer RCAR Research Council for Automobile Repair NCAP New Car Assessment Program
IIHS Insurance Institute for Highway Safety FEA Finite Element Analysis
xvii
LIST OF SYMBOLS
𝑊 Work
𝐹 Force 𝑑 Distance 𝐸𝑘 Kinetic Energy
𝑚 Translational Inertia 𝑣 Velocity
𝑣𝑖 Initial Velocity 𝑣𝑓 Final Velocity
𝑋 Sample Mean or Average ∑𝑋𝑠 Sum of All The Variables
1
CHAPTER 1
INTRODUCTION
1.1Background of Study
The vehicle bumper system, which includes the front and rear parts are designed to have the ability to resist impact during a collision without resulting damage to other components and safety systems that the vehicle owns. However, the existing designs of bumper systems are not capable of fully reducing injury towards the passengers during high speed impact collision. The United States National Highway Traffic Safety Administration (NHTSA) released the first regulation for vehicle bumpers in the year 1971. Federal Motor Vehicle Safety Standard No. 215 (FMVSS 215), “Exterior Protection” standard forbids functional damage towards specified safety related components when the vehicle is put through a barrier crash test at 8 km/h for front bumper systems and 4 km/h for rear bumper systems. Furthermore, the standards were upgraded in the year 1974, which requires the ability to resist damage from impacts at angles with speeds at 8 km/h for vehicles with standardized height of the front and rear bumpers (Ayyappa et al., 2014).
2 During a collision, the bumper is the first component to collide with a pedestrian. According to statistics, more than a third of 1.2 million people were killed and 10 million were injured annually in road traffic crashed worldwide are pedestrian (Davoodi et al., 2007). This issue raises awareness for public health, trauma medicine and traffic safety professionals.
According to a study conducted by Richards (2010), speed of a moving vehicle is one of the top contributors towards road traffic accidents. In terms of pedestrian road accidents, the change in velocity of vehicles are closely related with the severity of injury that the pedestrian experience. Based on the datasets acquired, risk for fatalities to occur increases with impact speeds around 48 km/h. Furthermore, when the impact speed increases towards 64 km/h, the probability of pedestrian fatalities to occur increases up to between 3.5 and 5.5 times.
[image:22.595.176.410.116.282.2]However, light-weight design has obtained more attention from automotive industries due to the need of energy conservation and environmental protection. In order to satisfy the following requirements, the best method taken is material replacement. Other methods such as structural optimization and advanced manufacturing technology is deemed less efficient when compared to material replacement method (Liu et al., 2016).
3 When integrating light-weight designs and improving the crashworthiness of vehicle safety components, composite materials were implemented during the manufacturing of bumpers. Composite materials possess high specific strength, high specific stiffness and high energy absorption capabilities (Liu et al., 2016). Compared to conventional materials such as steel and aluminium, composite materials showed equal strength and rigidity, reduction of total material used, ease of manufacturing and reduction in production cost (Hosseinzadeh et al., 2004).
Meanwhile, the ability of the bumper system to absorb energy is a crucial factor in determining the level of safety for the passengers. Vehicles with lighter overall weight are preferred by the costumers due to its fuel consumption when compared to heavier vehicles. However, lightweight vehicles cannot provide much safety for the passengers under impact conditions. Therefore, manufacturers are designing vehicles with deformable structures with crumple zones in order to increase the capability to absorb kinetic energy through plastic deformation during a frontal collision incident (Chotika et al., 2011).
1.2Problem Statement
Bumper beams are both attached to the front and rear end of vehicles plays an important role in absorbing energy. During a crash, bumper beams acts as crash-boxes which receives loads mainly in axial direction. The amount of energy absorbed by the bumper beams determines the damage applied to other parts of the vehicle and risk of injuries to the passengers. Hence, designs of bumper beams are very crucial for improving its effectiveness to absorb energy, which is also known as crashworthiness (Niyazi et al., 2015).
4 According to Fang et al. (2005), a crash simulation and assessment of its corresponding parameters are achievable with the help of finite element analysis (FEA). This is due to the programs which were configured specifically for dynamic contact problems. Moreover, crashworthiness characteristics of a vehicle structure can be modified and further optimized by combining simulation tools with non-linear mathematical programming methods. From the previous researches, it is shown that the study of energy absorption related to velocity is important in order to improve the vehicle performance and total manufacturing cost.
Furthermore, when conducting a simulation or analysis, size of meshing (mesh density) used is a critical factor. This is because the size of meshing directly determines the accuracy of the simulation results and the computing time. Generally, models with finer mesh (small element size) provides a higher accuracy in its result but longer computing time, whereas a coarse mesh (large element size) provides less accurate results but a shorter computing time (Shashikant et al., 2015). The study of energy absorption related to different velocities and effect of meshing size is important to improve the current performance of bumper systems during crashes.
1.3Objectives
This project focuses on impact test simulation with different velocities using finite element analysis (FEA) for car bumper. The objectives of this project are as follows:
i. To determine the energy absorbed with different velocity and meshing size.