This is a repository copy of
Expression microdissection isolation of enriched cell
populations from archival brain tissue
.
White Rose Research Online URL for this paper:
http://eprints.whiterose.ac.uk/99547/
Version: Accepted Version
Article:
Heath, P.R., Appleby-Mallinder, C., Wyles, M.D. et al. (3 more authors) (2016) Expression
microdissection isolation of enriched cell populations from archival brain tissue. Journal of
Neuroscience Methods. ISSN 0165-0270
https://doi.org/10.1016/j.jneumeth.2016.05.007
[email protected] https://eprints.whiterose.ac.uk/ Reuse
This article is distributed under the terms of the Creative Commons Attribution-NonCommercial-NoDerivs (CC BY-NC-ND) licence. This licence only allows you to download this work and share it with others as long as you credit the authors, but you can’t change the article in any way or use it commercially. More
information and the full terms of the licence here: https://creativecommons.org/licenses/
Takedown
If you consider content in White Rose Research Online to be in breach of UK law, please notify us by
Elsevier Editorial System(tm) for Journal of Neuroscience Methods
Manuscript Draft
Manuscript Number: JNEUMETH-D-16-00018R1
Title: Expression microdissection isolation of enriched cell populations from archival brain tissue
Article Type: Research Paper
Section/Category: Basic Neuroscience
Keywords: Expression microdissection; Laser capture microdissection; Neurones; Astrocytes; RNA; RNA integrity number
Corresponding Author: Dr. Paul Roy Heath, Corresponding Author's Institution:
First Author: Charlie Appleby-Mallinder
Order of Authors: Charlie Appleby-Mallinder; Matthew D Wyles; Julie E Simpson; Stephen B Wharton; Paul G Ince; Paul Roy Heath
Abstract: Background: Laser capture microdissection (LCM) is an
established technique for the procurement of enriched cell populations that can undergo further downstream analysis, although it does have limitations. Expression microdissection (xMD) is a new technique that begins to address these pitfalls, such as operator dependence and contamination.
New Method: xMD utilises immunohistochemistry in conjunction with a chromogen to isolate specific cell types by extending the fundamental principles of LCM to create an operator-independent method for the procurement of specific CNS cell types.
Results: We report how xMD enables the isolation of specific cell populations, namely neurones and astrocytes, from rat formalin fixed-paraffin embedded (FFPE) tissue. Subsequent reverse transcriptase-polymerase chain reaction (RT-PCR) analysis confirms the enrichment of these specific populations. RIN values after xMD indicate samples are sufficient to carry out further analysis.
Comparison with existing method: xMD offers a rapid method of isolating specific CNS cell types without the need for identification by an
operator, reducing the amount of unintentional contamination caused by operator error, whilst also significantly reducing the time required by the current basic LCM technique.
5th January 2016
Department of Neuroscience
Faculty of Medicine, Dentistry & Health
Paul R. Heath. B.Sc., Ph.D., P.G.Cert.H.E., F.H.E.A., Senior Scientific Officer
Manager Microarray Core Facility
Sheffield Institute for Translational Neuroscience University of Sheffield
385aGlossop Road Sheffield
S10 2HQ
Telephone: +44 (0)114 2222254 Fax: +44 (0)114 2222290 E-mail: [email protected]
Dear Prof Crunelli
Please find attached a copy of the paper “Expression microdissection isolation of enriched cell populations from archival brain tissue” which we wish to submit to Journal of Neuroscience Methods
.
In this paper we demonstrate a new methodology for isolating enriched cell populations from post-mortem formalin-fixed and paraffin embedded central nervous system tissue using immunohistochemistry and a modified laser capture microdissection technique, expression microdissection. This new approach will enable the investigation of the role of individual CNS cell populations in a range of neurological diseases.
We have read and have abided by the statement of ethical standards for manuscripts submitted to the Journal of Neuroscience Methods.
Should you require any further information, please do not hesitate to contact me.
.
Yours sincerely
,
*Ethical Standards Agreement
Department of Neuroscience
Faculty of Medicine, Dentistry & Health
Dr Paul Heath
Sheffield Institute for Translational Neuroscience University of Sheffield
385aGlossop Road Sheffield
S10 2HQ
26th April 2016 Telephone: +44 (0)114 2222254
E-mail: [email protected]
.
Dear Prof Crunelli
Revision of manuscript JNEUMETH-D-16-00018
Thank you for giving us the opportunity to revise our paper for your journal. We appreciate the
constructive comments of the referees, please find below our response to their comments. The
changes made to the paper are indicated below and are marked in red in the manuscript.
Response to Referee 1
1. First, in figure 3, there are several regions that have been extracted in figure 3B and 3D that are
not positive in the pre-extracted images.
Also, the arrows in 3A don't match 3B and same for 3C and 3D.
Also in these images, there is extra tissue around each cell removed by this methodology,
however there is no scale bar or objective used for these images shown, so the "extra" regions
around the cell cannot be quantified. These images show that this method is not exact.
We agree with the reviewer that this approach will not isolate a pure population, rather it
will enable a significantly enriched fraction to be obtained. We have amended the text to
ensure that the limitation of this technique is highlighted. We have also amended the
figures as recommended by the reviewer to clearly label the xMD-ed cells.
2. It would be good to quantify the amount of extra tissue extracted via this method compared to
LCM using the caps provided by Life Technologies.
xMD approach will not isolate a pure population of cells. By presenting the XMD approach
in this manuscript it will provide an alternative approach for researchers.
3. Figure 4 shows very poor Agilent results with rampant background and very low RIN, which while
low RINs are expected from PPFE tissue, the high background does not accurately measure the
RNA content.
We are familiar with this problem from our LCM work with post mortem tissue. It appears to
be a feature of the degraded RNA that one encounters in these preparations. We
acknowledge that it does not accurately measure RNA content but enables us to compare
sample quality.
4. They also only show this for one sample and do not show it from the glial cells verses neurons. It
is very important with a new methodology to show more than one sample. There should be a
table or figure of all of the results using this methodology with before and after RINs.
We agree with the reviewer and have now included additional examples of isolated glia,
with RIN values before and after xMD, in Figure 4.
5. The authors state that they use "Approximately 200 cells were collected RNA extraction was
conducted with the following protocol." They do not quantify how much RNA they use for the
reverse transcription step, which will be very different amounts of RNA starting RNA from neurons
verses glial cells. Qiagen estimates a yield of 10-30pg of total RNA per cell, with mRNA
accounting for only 1-5% of that number. However, when doing the RT-PCR they state they use
50ng of cDNA. They do not state how the cDNA is measured. Is this estimated from the RNA
starting amounts? There should be an Agilent DNA chip done on these samples to show the
purity, amount and fragment size of the cDNA present.
The estimation of RNA quantity is generated from the NanoDrop value. We acknowledge
that this is inaccurate but we have found from previous work that when converted to cDNA
or used in a microarray that we can use these values as a guide. We have not found that
Agilent DNA chips for cDNA are particularly helpful in this regard.
6. A negative control experiment showing that simply binding the film to the stained sections does
not result in adhesion of the cells should be done and shown as well.
A negative control, omitting the primary antibody, was included and demonstrated no
specific immunoreactivity and no resulting cellular adhesion. An example of the xMD
negative controls is included in the appendix.
Response to Referee 2
1. To demonstrate advantages of xMD, authors selected the brain region where the cell density is
relatively low as shown in Figure 3. How does this technique work if the regions with tightly
packed cell bodies of the different cell types are studied?
xMD in the white matter of the same tissue has been conducted with successful results,
however, for demonstration purposes for the paper it was more appropriate to showcase
the technique using the less densely populated cortical region. Other studies have used
different tissues with higher cellular densities to obtain cells via xMD (Hanson et al. 2004,
Tangrea et al. 2011). This has now been highlighted in the discussion.
2. As seen in Figure 3, xMD results in capturing excessive areas that surround the cells. Is it
possible to reduce these excessive areas or adjust their size?
While alternative films with different polymer densities could be used, currently adjusting
laser pulse, duration and intensity will not reduce the size of the area activated by the
action of the laser. This is also a recognised limitation of the standard LCM approach.
We agree with the reviewer that not all astrocytes are GFAP
+and that a good pan-astrocyte
marker is currently lacking. However, not all astrocytes are EAAT1
+and S100B is not
selective for astrocytes alone. It is certainly an important consideration that users of this
technique should be aware of, and we have now added this discussion to the text.
4. Positive controls for CD68 and OLIG2 must be added. To confirm the enrichment, real-time PCR
analysis of xMD and non-xMD samples from the same region of the brain is required. This
approach also provides positive controls for all tested genes and allows for the quantitative
estimation of the enrichment.
Positive controls of total extracts were included in each run, and have now been added to
Figure 5.
5. I cannot agree with the view that the exclusion of an operator from the process reduces
specific contamination. In contrast with this view, I believe that an operator may reduce
non-specific contamination. For instance, in the case when the automatic recognition of the cells of
interest is used for common laser capture microdissection, an operator can control the recognition
process and exclude objects that were recognized by mistake. Moreover, the accuracy of the cell
isolation by laser capture microdissection may be supported by making images before and after
the laser capture microdissection procedure. At the same time, it seems that xMD may be used for
perfectly stained preparations. If some artifacts of the staining are present, inadequate isolation by
xMD may occur. Give reasons for your view.
We completely agree with the reviewer that high background staining and artefacts will
interfere with the isolation of an enriched population, contributing to contamination of the
extract. It is imperative that time is spent optimising each antibody to ensure a specific
pattern of immunoreactivity is obtained with minimal background staining. We have
amended the text accordingly.
Minor concerns:
The figure numbers mentioned in the text are mostly improper. Check the numeration of the figure
references in the text.
Scale bars are absent in Figures 2 and 3 in my version of the manuscript.
Check spelling of 'Chromogen' through the text.
Clarify Figure 4. Where is RNA integrity number before and after xMD?
We thank the reviewer for making us aware of these errors and have amended the text
accordingly.
Response to Referee 3
1. Data display
—
The authors have gene expression data regarding cell-specific captures for six rats.
Rather than show an agarose gel, the authors should display the data quantitatively. The gene
expression data for GFAP, OLIG2, CD68, and Tub3 could have been easily shown as relative
expression levels for the six samples in both cell types--provided the authors can quantify with a
standard.
While we agree with the reviewer that qPCR would have been an alternative approach, in
the current study we were looking to achieve a semi-quantitative assessment of cellular
enrichment and felt the standard PCR would demonstrate this adequately.
2. Efficiency
—
200 hundred cells were collected, but 50 ng was used per PCR reaction for each gene.
According to Figure 4, (possibly beyond sensitivity of Agilent) the author demonstrates 4-6
nanograms per sample, likely per microliter (author did not indicate). Elution was 20 microliters
therefore the author could perform gene expression analysis for only 2 genes per RNA purification.
Each capture may contain varying amounts of neuropil thus resulting in variable RNA amounts.
3. Lack of appropriate experimental controls
—
I feel confident that the authors performed a
nonspecific secondary binding experiment, but failed to mention it in the written manuscript. I find
the ABC kit can allow nonspecific binding to frozen tissue, but may be less susceptible to
nonspecific binding with FFPE tissue, but at least a mention of a negative control would have
been a good practice to prove there is limited nonspecific gene expression.
As mentioned above in the response to Reviewer 1, negative controls were included in the
experiments. Both omission of the primary antibody and an isotype control were included,
neither of which gave any non-specific immunoreactivity. We apologise for omitting this in
the manuscript and have amended the text accordingly.
4. Housekeeping gene/loading control
—
The authors did not mention whether a loading control or
housekeeping gene (s) was used to standardize expression levels of the cell-specific marker
genes. The authors may have standardized to RNA amounts or number of cells, but the RNA
quantity shown in the picochip in the samples in figure 4 appear to be above the level of sensitivity.
The PCR was standardised using equivalent amounts of cDNA.
Figures/technical aspects:
5. Gene names should be italicized throughout manuscript, HUGO name should be used
consistently.
The text has been amended.
6. Figure 1. I would rather a rudimentary experiment (possible addition with this figure) that
demonstrates the intensity of EVA/DAB binding can affect the number of cells captured i.e. a
primary or secondary dilution curve demonstrating changes in the amounts of GFAP and TUB3
expression.
Each antibody was optimised and the conditions which produced the highest level of
specific immunoreactivity with the lowest levels of background staining were selected from
a range of antibody titrations.
7. Combine Figure 2 and Figure 3. For completeness, the authors could have displayed a negative
control in panel 1, immunohistochemical identification for NeuN or GFAP in panel 2, and captured
area in panel 3 for one figure.
An example of the negative control included in each experiment has been added as an
appendix.
While we appreciate the Reviewer’s suggestion to combine Figures 2 and 3, we
feel that they are more suited to being independent figures.
8. Figure 4. The authors exceed the sensitivity of the picochip (5000 picograms) leading to potential
errors regarding RNA amount and RIN.
We take the point that we are struggling with the estimation of RNA quality and have
discussed this in the response to both previous reviewers. We continue to use the
methodologies we are familiar with as a guide to our subsequent experimentation. We have
investigated other measurement technologies but nothing has, yet, given us any better
results.
9. Figure 5. No referral in manuscript, although I assume authors meant to indicate Figure 5 rather
than Figure 4 on page 7.
We apologise for this oversight and have amended the manuscript accordingly.
Yours sincerely
Expression microdissection isolation of enriched cell populations from archival brain
tissue
Authors:
C. Appleby-Mallinder, M.D. Wyles, J.E. Simpson, S.B. Wharton, P.G. Ince, P.R. Heath
Affiliations:
Sheffield Institute for Translational Neuroscience, University of Sheffield, UK
Corresponding author:
Dr Paul Heath
Sheffield Institute for Translational Neuroscience
385A Glossop Road
Sheffield, UK
S10 2HQ
Tel: +44 (0) 114 222 2254
Fax: +44 (0) 114 222 2290
Email:
[email protected]
*Title page-incl. type of article and authors name and affiliation
Highlights:
Expression microdissection (xMD) reduces issues of laser capture microdissection
xMD reduces procedure length compared to LCM
xMD can isolate immunopositive central nervous system cells (CNS) from FFPE
tissue
RNA integrity number suggests RNA is of sufficient quality for further analysis
CNS cells isolated by xMD show enriched populations, confirmed by RT-PCR
1
Expression microdissection isolation of enriched cell populations from archival brain
tissue
Authors:
C. Appleby-Mallinder, M.D. Wyles, J.E. Simpson, S.B. Wharton, P.G. Ince, P.R. Heath
Affiliations:
Sheffield Institute for Translational Neuroscience, University of Sheffield, UK
Corresponding author:
Dr Paul Heath
Sheffield Institute for Translational Neuroscience
385A Glossop Road
Sheffield, UK
S10 2HQ
Tel: +44 (0) 114 222 2254
Fax: +44 (0) 114 222 2290
Email: [email protected]
Highlights:
Expression microdissection (xMD) reduces issues of laser capture microdissection xMD reduces procedure length compared to LCM
xMD can isolate immunopositive central nervous system cells (CNS) from FFPE tissue
RNA integrity number suggests RNA is of sufficient quality for further analysis CNS cells isolated by xMD show enriched populations, confirmed by RT-PCR
analysis
*Manuscript (With Page Numbers)
2
Abstract
Background: Laser capture microdissection (LCM) is an established technique for the
procurement of enriched cell populations that can undergo further downstream analysis,
although it does have limitations. Expression microdissection (xMD) is a new technique that
begins to address these pitfalls, such as operator dependence and contamination.
New Method: xMD utilises immunohistochemistry in conjunction with a chromoagen to
isolate specific cell types by extending the fundamental principles of LCM to create an
operator-independent method for the procurement of specific CNS cell types.
Results: We report how xMD enables the isolation of specific cell populations, namely
neurones and astrocytes, from rat formalin fixed-paraffin embedded (FFPE) tissue.
Subsequent reverse transcriptase-polymerase chain reaction (RT-PCR) analysis confirms
the enrichment of these specific populations. RIN values after xMD indicate samples are
sufficient to carry out further analysis.
Comparison with existing method: xMD offers a rapid method of isolating specific CNS
cell types without the need for identification by an operator, reducing the amount of
unintentional contamination caused by operator error, whilst also significantly reducing the
time required by the current basic LCM technique.
Conclusions: xMD is a superior method for the procurement of enriched cell populations
from post-mortem tissue, which can be utilised to create transcriptome profiles, aiding our
understanding of the contribution of these cells to a range of neurological diseases. xMD
also addresses the issues associated with LCM, such as reliance on an operator to identify
target cells, which can cause contamination, as well as addressing the time consuming
nature of LCM.
Abbreviations:
CNS; central nervous system, LCM; laser capture microdissection, EVA; ethylene vinyl
acetate, DAB; 3’3-diaminobenzidine, xMD; expression microdissection, FFPE; formalin fixed paraffin embedded, RT-PCR; reverse transcriptase polymerase chain reaction, ABC;
avidin/biotinylated complex, DEPC; diethylpyrocarbonate, TBS; Tris-buffered saline, UV;
ultra violet, RIN; RNA integrity number.
Keywords:
Expression microdissection; Laser capture microdissection; Neurones; Astrocytes; RNA;
3
1. Introduction
It has long been recognised that in order to unravel the underlying pathologies of
central nervous system (CNS) disorders, it is necessary to identify the contributions of
individual cell types to the overall disease process. We previously reported an immuno-LCM
technique that combines rapid immunostaining with standard laser capture microdissection
(LCM) to enable the isolation of an enriched population of cells from frozen post-mortem
tissue [15]. Using this approach, we have carried out a number of studies to enrich for
populations of specific CNS individual cell types to compare the gene expression profile of
disease and non-disease cells, including oligodendrocytes [1], astrocytes [3] and neurones
[8, 11]. This approach has been useful in identifying disease-relevant gene expression
related changes which can then be investigated further, but the protocols are somewhat
lengthy and it can, on occasion, be difficult to confidently identify certain cells.
The development of the expression microdissection (xMD) technique [12], later
refined [7], offers a new approach to streamline and simplify the isolation of specific cell
populations, removing the need for a microscope or cell identification by the user, making it
an operator independent process. Similar to the LCM preparation process, for xMD, tissue
sections undergo Immunohistochemistry for a cell-type-specific antigen. Tissue sections are
then covered with an ethylene vinyl acetate (EVA) polymer film and the whole tissue is
irradiated with a low energy infra-red laser. When the laser is fired over an immunopositive
cell, the EVA film melts, causing a thermoplastic bond to occur between the EVA film and
the immunopositive cell, adhering the cell to the EVA film. The film can then be removed
from the tissue, taking with it only the immunopositive cells that have formed a thermoplastic
bond with the EVA polymer, after which they can then be placed in extraction buffer for
further downstream analysis (Figure 1).
In the current study, formalin-fixed paraffin embedded (FFPE) post-mortem tissue
was used to highlight how this resource can be used in conjunction with the expression
microdissection technique to acquire enriched central nervous system (CNS) cell
populations, namely neurones and astrocytes. For the purpose of this proof of principle study
the neurone marker NeuN and a widely used astrocyte marker GFAP were the antibodies of
choice. Histopathologically well-characterised archival FFPE tissue is currently an
underutilised resource that has the potential to unravel underlying mechanisms contributing
to disease pathogenesis. To date, two studies have been conducted utilising this method as
a means to isolate specific cell types [4, 6]. However, neither of these studies isolated CNS
cells, making the method described here novel for these specific cell types.
This paper describes the detailed methodology of xMD which can be used to isolate
enriched populations of specific cell types from FFPE tissue, and confirms this enrichment
4
FFPE cohorts to investigate the contribution of specific cell types to the pathogenesis of a
range of neurological diseases.
2. Materials and Methods
2.1 Rat brain tissue
Formalin fixed paraffin embedded (FFPE) post mortem rat brain tissue blocks were
obtained from 6 Sprague Dawley adult rats. Cell isolation was carried out from the
hippocampal region.
2.2 Immunohistochemistry
5µm sections were collected onto sterile charged slides. Sections were dewaxed in
xylene and rehydrated to DEPC-water in a graded series of alcohols (100%, 100%, 95%,
70% EtOH for 5 min each). Immunohistochemistry was used following the standard
avidin/biotinylated enzyme complex (ABC) staining method (Vector Laboratories, UK). All
work was carried out at room temperature (RT) under RNase-free conditions. Sections were
blocked in 1.5% relevant normal serum for 30 min, then incubated in the appropriate specific
antibody (glial fibrillary acidic protein [Dako catalogue number Z0334] 1:500; NeuN
[Chemicon catalogue number MAB377] 1:100) diluted in blocking serum for 1 hour before
washing with Tris-buffered saline (TBS) for 5 min. Sections were then incubated with 0.5%
biotinylated secondary antibody for 30 min, washed with TBS for 5 min, and then incubated
with 2% horse-radish peroxidise conjugated ABC for 30 min and washed with TBS for 5 min.
Antibody staining was visualised with 3,3’-diaminobenzidine (DAB) as chromogen (Vector Laboratories, UK) for 3 min. Sections were rinsed in DEPC-water and dehydrated in graded
alcohols (70%, 95%, 100%, 100% for 15 s each) then cleared in xylene for 5 mins. Sections
were left to air dry in an air flow hood for approximately one hour prior to baking. Each
antibody was optimised in order to ensure a specific pattern of immunoreactivity was
achieved with minimal background staining. The optimisation process included the
appropriate negative controls with primary antibody exclusion and an isotype control to
ensure there was no non-specific reactivity.
2.3 Film and slide preparation for microdissection
CoTran 19% ethylene-vinyl acetate (EVA) film (3M, cat. No. 3M CoTran 9715) was
sterilised in an ultraviolet (UV) air flow hood for 20 min. Using a sterile scalpel and forceps,
the film was positioned over the slide so that all the tissue section was covered, and the film
was cut to fit the slide, leaving a 2-3mm border to prevent the film catching on the LCM
5
out and pressure was applied using a roller to increase the film-section contact area. Slides
were then placed back in the oven for a further 10 min.
2.4 LCM cap preparation
The film layer of a CapSure Macro LCM cap (Life technologies or Applied
Biosystems Arcturus Engineering, Mountain View, CA, USA) was peeled off using sterile
forceps and discarded, and the cap placed back into the tray. Although the cells are not
collected onto the LCM cap, it is still needed to focus the laser when carrying out the xMD
process.
2.5 Expression Microdissection
Expression microdissection was performed using a Veritas LCM system (Applied
Biosystems). The following parameters were used: 50µm spot size, 50ms laser pulse
duration and 70mW laser power, set to continuously fire.
2.6 RNA extraction
After microdissection, a sterile scalpel was used to cut the film surrounding the target
area and carefully removed from the slide before being placed in a sterile 0.2ml Eppendorf
tube. Total RNA was extracted from microdissected cells using a modified protocol that
utilised the Recoverall Total Nucleic Acid Kit for FFPE (Life Technologies, CA, USA) and
RNAqueous Micro kit (Life Technologies, CA, USA). Approximately 200 cells were collected.
RNA extraction was conducted with the following protocol. Protease digestion, and nucleic
acid isolation were carried out as in the manufacturer’s protocol for Recoverall Total Nucleic
Acid Kit for FFPE kit (step C1 through to step D2). Briefly, 100µl digestion buffer and 4µl
protease was added to the Eppendorf containing the film. Samples were then mixed by
swirling followed by incubation at 50°C for 15 mins, then 80°C for 15 mins. 120µl isolation
additive and 275µl 100% ethanol were then added to the mixture and mixed by pipetting.
Samples were then transferred to cartridge filters included in the RNAqueous Micro kit for
wash steps, elution and DNase treatment, carried out as in the manufacturer’s protocol (step
B5 through to step C4). All the sample was loaded onto the cartridge assembly and
centrifuged for 1 min at 10,000xg. 180µl wash buffer 1 was added to the cartridge assembly
and centrifuged for 1 min at 10,000xg. This was followed by two washes with wash buffer
2/3, each of which was centrifuged for 30s at 10,000xg. The cartridge assembly was then
centrifuged for 1 min at 10,000xg to remove any residual fluid. 10µl elution solution,
preheated to 95°C was added to the cartridge assembly and incubated for 5 mins at RT,
followed by centrifugation for 1 min at 10,000xg. This step was repeated to produce a final
6
buffer and 1µl DNase I was added and mixed by gentle pipetting. Samples were then
incubated for 20 mins at 37°C. 2µl DNase inactivation reagent was added and incubated for
2 mins at RT. Samples were then centrifuged for 90s at 16,000xg.
A NanoDrop 1000 spectrophotometer (Thermoscientific, UK) was used to determine
the quantity of the RNA and 2100 Bioanalyzer, RNA 6000 Pico LabChip (Agilent, Palo Alto,
CA, USA) was used to determine RNA quality.
2.7 Reverse transcriptase polymerase chain reaction (RT-PCR)
Reverse transcriptase polymerase chain reaction (RT-PCR) is a standard and
reliable method of assessing the cell phenotype specific genes from the RNA extracted from
LCM isolated cells [14], as well as xMD isolated cells [6], making this a viable method of
validating the isolation of an enriched, specific cell population, as well as indicating
contamination levels of non-specific cells.
cDNA was synthesised using the Superscript III reverse transcriptase kit (Life
Technologies, CA, USA) with random primers, as described in the manufacturer’s protocol.
Gene-specific PCR primers were either designed in house or obtained from commercially
available sources. PCR was performed using 50ng cDNA, 2x ReddyMix PCR master-mix
(Thermoscientific, UK) with optimised concentrations of forward and reverse primers (Table
1), in a total volume of 20µl. A denaturation step at 95°C for 10 min was followed by
amplification of the products: 30 cycles at 95°C for 15s, 60°C for 60s, then 72°C for 15 min.
[image:16.595.58.502.467.616.2]PCR products were visualised on a 3% agarose gel stained with ethidium bromide.
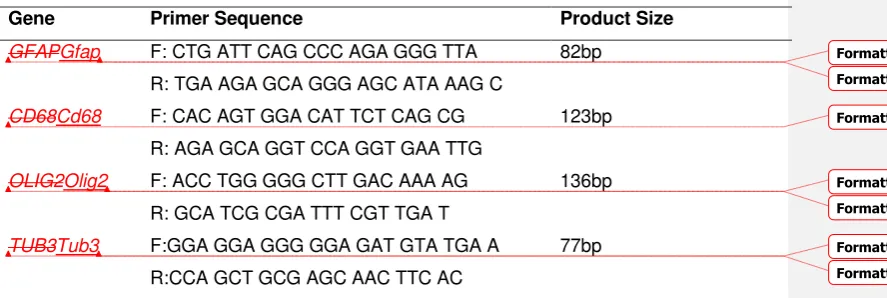
Table 1. Primer sequence
Gene Primer Sequence Product Size
GFAPGfap F: CTG ATT CAG CCC AGA GGG TTA
R: TGA AGA GCA GGG AGC ATA AAG C
82bp
CD68Cd68 F: CAC AGT GGA CAT TCT CAG CG
R: AGA GCA GGT CCA GGT GAA TTG
123bp
OLIG2Olig2 F: ACC TGG GGG CTT GAC AAA AG
R: GCA TCG CGA TTT CGT TGA T
136bp
TUB3Tub3 F:GGA GGA GGG GGA GAT GTA TGA A
R:CCA GCT GCG AGC AAC TTC AC
77bp
Key: F, Forward; R, Reverse
3. Results
3.1 Expression microdissection enables the enriched isolation of specific cell-types from
FFPE tissue
Formatted: Font: Italic
Formatted: Font: Italic
Formatted: Font: Italic
Formatted: Font: Italic
Formatted: Font: Italic
Formatted: Font: Italic
7
Standard immunohistochemistry enabled the identification of the target cell type.
NeuN+ neurones displayed large round immunopositive nuclei, while GFAP+ astrocytes
displayed stellate morphology with processes extending out of the cell body (Figure 2C).
NeuN+ neurones and GFAP+ astrocytes were isolated using expression microdissection on
a Veritas laser-capture microdissection system. The laser irradiated the entire tissue, only
activating the EVA polymer film over the immunopositive cells that bound the DAB
chromaogen, due to the transient increase in temperature, fusing the film with the underlying
cells. When the film was lifted off, the unwanted (unlabelled) cells were left behind (Figure
2B & 3D).
3.2 RNA quality
Following RNA isolation from the xMD isolated specific immunoreactive cells, the RIN
value was assessed (Figure 43). In the representative examples shown, before xMD the RIN
value was 3.0, and after xMD the RIN value decreased by 0.3to 2.4.
3.3 PCR of cell phenotype specific transcripts confirms enrichment of specific cell
populations using xMD
Expression microdissection is suitable for the procurement and isolation of neurones
and astrocytes, resulting in enriched target cell samples. RNA isolated from NeuN+ cells had
high levels of Tubulin 3 transcripts with no transcripts for GfapGFAP, CD68Cd68or
OLIG2Olig2, confirming that extracted RNA represents a highly-enriched neuronal
population (Figure 5). This was also true for GFAP+ cells, which had high levels of GFAP
Gfaptranscripts with lower levels of Tubulin 3 and no detectable CD68Cd68and OLIG2
Olig2transcripts (Figure 5).
4. Discussion
The isolation of enriched cell populations from post-mortem material is key to
identifying the role(s) these cells play in neurological diseases. To date, the majority of
studies have examined disease-associated changes in gene expression in whole tissue
extracts, which likely mask the specific contribution of individual cell populations [2, 5, 16]. In
the current study we demonstrate that enriched cell populations can be successfully isolated
from CNS tissue by xMD. Whilst not being entirely homogeneous, the extract achieved using
this approach is highly enriched for the cell type of interest, as confirmed by RT-PCR. While
isolated neurones had no detectable levels of glial transcripts, low levels of neuronal
transcripts were present in the xMD-isolated astrocytes, likely reflecting the target cells’
proximity to axons. Therefore, xMD is suitable for the procurement and isolation of neurones
Formatted: Font: Italic
Formatted: Font: Italic
Formatted: Font: Italic
Formatted: Font: Italic
8
and astrocytes from post-mortem FFPE tissue, resulting in enriched target cell samples. In
addition to demonstrating the high recovery rate of the specific cell of interest, we also show
that the RNA integrity of the xMD isolated cells is suitable for further downstream analysis,
confirming previous xMD studies [4, 6].
FFPE CNS tissue blocks are widely used to immunohistochemically characterise the
detailed cellular pathology associated with specific neurological diseases. Whilst classical
neuropathology is a key element of many studies, we demonstrate that the quantity and
quality of RNA collected from FFPE tissue utilising the xMD method is of sufficient quality to
carry out further molecular analyses. We demonstrate cellular isolation from cortical regions,
but it should be noted that other studies have used different tissues with higher cellular
densities to obtain cells via xMD[7, 12]. While it is inevitable that some RNA will be
degraded during the fixation and processing of the tissue, we demonstrate that the RIN
value of the isolated cells is comparable with cells isolated from frozen CNS tissue [15]. In
theory, this method could also be applied to frozen tissue; however, a modified rapid
immunostaining protocol, as previously described [15], is advised. Previous studies have
also shown that samples with a wide range of RIN values (RIN 1-8.5) can be used in gene
expression studies with successful outcomes [10, 13].
In the current study we demonstrate that xMD is a robust approach for isolating an
enriched population of specific CNS cell types, and suggest that with optimisation, this
method could be extended and further applied to the isolation of any desired cell type
provided a suitable cell-specific antibody is available to allow binding of a chromoagen in
order for the xMD process to be carried out. Whilst we performed this study on rat tissue, it
could in theory, be used to isolate other CNS specific cell types from other species, including
human and mouse. Human tissue has been shown to be suitable for use in conjunction with
xMD [4, 6].
xMD, whilst still in its infancy, addresses many of the limitations associated with basic
LCM techniques, such as the need for operator-based identification of the cell of interest
based on morphology, which can result in the non-specific cell contamination of the enriched
cell sample. The current study outlines the detailed methodology of how different CNS cell
types can be microdissected without the need for visualisation by an operator, thereby
reducing the chance of a cell being wrongly identified. It also prevents the isolation of a cell
with similar morphology to the cell type of interest from being mistakenly picked, as only cells
that are immunopositive adhere to the film when the tissue is irradiated. xMD also negates
the need for a microscope or visualisation of the cell of interest, making the process
operator-independent.
A further advantage of the xMD technique is its potential to address the low recovery
9
to the EVA polymer film than can be identified by the operator using LCM. LCM is also a
highly time consuming process and this too is addressed by xMD, as the laser can be set to
continuously fire without an operator being present during this process. Therefore, xMD can
be employed to rapidly isolate enriched cell-specific populations from post-mortem material.
Further developments into xMD are still occurring [7]. These include the
development of a handheld device that would further streamline the process, making it less
time consuming for the operator due to the laser only having to fire over the tissue a few
times in quick succession, meaning that this process in theory make take just a few minutes.
A handheld device would also make it more accessible to laboratories where LCM
equipment is not readily available.
5. Conclusion
To summarise, this paper documents a detailed methodological approach for the
isolation of specific cell types from FFPE tissue utilising expression microdissection as the
method of isolation, whilst also addressing and overcoming the pitfalls of LCM to acquire
enriched CNS cell populations. Whilst the use of FFPE tissue does have its limitations, it is
an extremely valuable resource that is widely available and easy to store, making the RNA
obtained from xMD-isolated specific, enriched cell populations from FFPE material a viable
option for studying changes in the gene expression profile associated with the pathogenesis
of a range of neurological diseases.
While xMD has some limitations, this technique allows enriched cell populations to be
isolated from FFPE tissue, thereby enabling the role of these cells in neurological disease to
be investigated. Utilising this approach, specifically by applying it to well characterised
human tissue, would enable underlying pathogenic mechanisms to be elucidated and to
identify potential targets for developing novel treatment strategies. In this respect, xMD is
more relevant than other useful, but less reflective, approaches to understanding
neurodegenerative disease, such as the use of cell lines and animal models [9].
6. Acknowledgements
The authors would like to thank Lynne Baxter for her expert technical assistance and
Professor Michael Tangrea for online support.
10
[1] Y.T. Asi, J.E. Simpson, P.R. Heath, S.B. Wharton, A.J. Lees, T. Revesz, H. Houlden,
J.L. Holton, Alpha-synuclein mRNA expression in oligodendrocytes in MSA, Glia 62
(2014) 964-970.
[2] K. Bossers, G. Meerhoff, R. Balesar, J.W. van Dongen, C.G. Kruse, D.F. Swaab, J.
Verhaagen, Analysis of gene expression in Parkinson's disease: possible
involvement of neurotrophic support and axon guidance in dopaminergic cell death,
Brain pathology 19 (2009) 91-107.
[3] C.J. Garwood, L.E. Ratcliffe, S.V. Morgan, J.E. Simpson, H. Owens, I.
Vazquez-Villasenor, P.R. Heath, I.A. Romero, P.G. Ince, S.B. Wharton, Insulin and IGF1
signalling pathways in human astrocytes in vitro and in vivo; characterisation,
subcellular localisation and modulation of the receptors, Molecular brain 8 (2015) 51.
[4] A.C. Grover, M.A. Tangrea, K.G. Woodson, B.S. Wallis, J.C. Hanson, R.F. Chuaqui,
J.W. Gillespie, H.S. Erickson, R.F. Bonner, T.J. Pohida, M.R. Emmert-Buck, S.K.
Libutti, Tumor-associated endothelial cells display GSTP1 and RARbeta2 promoter
methylation in human prostate cancer, Journal of translational medicine 4 (2006) 13.
[5] E. Grunblatt, N. Zander, J. Bartl, L. Jie, C.M. Monoranu, T. Arzberger, R. Ravid, W.
Roggendorf, M. Gerlach, P. Riederer, Comparison analysis of gene expression
patterns between sporadic Alzheimer's and Parkinson's disease, Journal of
Alzheimer's disease : JAD 12 (2007) 291-311.
[6] J.A. Hanson, J.W. Gillespie, A. Grover, M.A. Tangrea, R.F. Chuaqui, M.R.
Emmert-Buck, J.A. Tangrea, S.K. Libutti, W.M. Linehan, K.G. Woodson, Gene promoter
methylation in prostate tumor-associated stromal cells, Journal of the National
Cancer Institute 98 (2006) 255-261.
[7] J.C. Hanson, M.A. Tangrea, S. Kim, M.D. Armani, T.J. Pohida, R.F. Bonner, J.
Rodriguez-Canales, M.R. Emmert-Buck, Expression microdissection adapted to
commercial laser dissection instruments, Nature protocols 6 (2011) 457-467.
[8] J.R. Highley, J. Kirby, J.A. Jansweijer, P.S. Webb, C.A. Hewamadduma, P.R. Heath,
A. Higginbottom, R. Raman, L. Ferraiuolo, J. Cooper-Knock, C.J. McDermott, S.B.
Wharton, P.J. Shaw, P.G. Ince, Loss of nuclear TDP-43 in amyotrophic lateral
sclerosis (ALS) causes altered expression of splicing machinery and widespread
dysregulation of RNA splicing in motor neurones, Neuropathology and applied
neurobiology 40 (2014) 670-685.
[9] M. Jucker, The benefits and limitations of animal models for translational research in
neurodegenerative diseases, Nature medicine 16 (2010) 1210-1214.
[10] K. Kojima, C. April, C. Canasto-Chibuque, X. Chen, M. Deshmukh, A. Venkatesh,
11
archived sectioned formalin-fixed paraffin-embedded (AS-FFPE) tissue for disease
classification, PloS one 9 (2014) e86961.
[11] J.E. Simpson, P.G. Ince, T. Minett, F.E. Matthews, P.R. Heath, P.J. Shaw, E.
Goodall, C.J. Garwood, L.E. Ratcliffe, C. Brayne, M. Rattray, S.B. Wharton, M.R.C.C.
Function, G. Ageing Neuropathology Study, Neuronal DNA damage
response-associated dysregulation of signalling pathways and cholesterol metabolism at the
earliest stages of Alzheimer-type pathology, Neuropathology and applied
neurobiology (2015).
[12] M.A. Tangrea, R.F. Chuaqui, J.W. Gillespie, M. Ahram, G. Gannot, B.S. Wallis, C.J.
Best, W.M. Linehan, L.A. Liotta, T.J. Pohida, R.F. Bonner, M.R. Emmert-Buck,
Expression microdissection: operator-independent retrieval of cells for molecular
profiling, Diagnostic molecular pathology : the American journal of surgical pathology,
part B 13 (2004) 207-212.
[13] D. Trabzuni, M. Ryten, R. Walker, C. Smith, S. Imran, A. Ramasamy, M.E. Weale, J.
Hardy, Quality control parameters on a large dataset of regionally dissected human
control brains for whole genome expression studies, Journal of neurochemistry 119
(2011) 275-282.
[14] V.A. Vincent, J.J. DeVoss, H.S. Ryan, G.M. Murphy, Jr., Analysis of neuronal gene
expression with laser capture microdissection, Journal of neuroscience research 69
(2002) 578-586.
[15] R. Waller, M.N. Woodroofe, S. Francese, P.R. Heath, S.B. Wharton, P.G. Ince, B.
Sharrack, J.E. Simpson, Isolation of enriched glial populations from post-mortem
human CNS material by immuno-laser capture microdissection, Journal of
neuroscience methods 208 (2012) 108-113.
[16] X.S. Wang, Z. Simmons, W. Liu, P.J. Boyer, J.R. Connor, Differential expression of
genes in amyotrophic lateral sclerosis revealed by profiling the post mortem cortex,
Amyotrophic lateral sclerosis : official publication of the World Federation of
Figure legends:
Figure 1. Schematic representation of xMD. Immunopositive cells with the bound DAB
chromogen are covered with a clear EVA polymer. The entire tissue is then irradiated with
the IR laser of a LCM system. The EVA polymer melts at the site of the immunopositive cell
due to the increased temperature caused by the chromagen DAB. This then bonds the EVA
polymer film to the target cells.
Figure 2. Immunohistochemical identification of astrocytes and neurones. (A) Glial fibrillary
acidic protein (GFAP) was used to identify astrocytes and (B) NeuN was used to identify
neurons. Scale bar represents 50µm.
Figure 3. Expression microdissection of (A,B) NeuN+ neurones and (C,D) GFAP+ astrocytes
from FFPE post-mortem rat brain tissue. Immunopositive cells were isolated using
expression microdissection on a Veritas laser-capture microdissection system. The laser
irradiated the entire tissue, only activating the EVA polymer film on the immunopositive cells
bound the DAB chromogen, due to the transient increase in temperature. The film fused with
the underlying cells. The film was lifted off, leaving unwanted cells behind (B,D). The isolated
cells were attached to the film, to then undergo RNA extraction.
Figure 4. Representative RNA integrity number (RIN) of samples before and after xMD. (A)
Before (RIN 3.0) and (B) after (RIN 2.7) xMD isolation of NeuN
+neurones. (C) Before (RIN
2.7) and (D) after (RIN 2.4) xMD isolation of GFAP
+astrocytes.
Figure 5. RT-PCR of transcripts in cells isolated by expression microdissection. NeuN
+neurones are associated with high levels of
Tubulin 3
transcripts (77bp). GFAP
+astrocytes
are associated with high levels of
Gfap
transcripts (82bp).
CD68
(123bp),
Olig2
(136bp).
Figure
Figure
Figure
Figure
Figure
![1 [1 (4 Fluorophenyl) 2 methyl 5 phenyl 1H pyrrol 3 yl]ethanone](data:image/gif;base64,R0lGODlhAQABAIAAAP///wAAACH5BAEAAAAALAAAAAABAAEAAAICRAEAOw==)