International Journal of Innovative Technology and Exploring Engineering (IJITEE) ISSN: 2278-3075, Volume-8 Issue-7, May 2019
Abstract: Email is a standout amongst the most secure vehicle for online correspondence and exchanging information or messages through the web. A congesting increment in fame, the quantity of spontaneous information has additionally expanded quickly. To channel information, diverse methodologies exist which consequently identify and expel these indefensible messages. As spam messages are making bother everybody, Machine Learning Techniques now days used to consequently channel the spam email in an effective rate. This paper audits the execution of support vector machines, decision trees and logistic regression on Spam Email information. These three algorithms were tried on an ongoing dataset, where the dimensionality of spam messages were more than 5000 and SVM performed best when utilizing linear kernel. Logistic Regression and SVM's had worthy test execution regarding accuracy and speed. Be that as it may, SVM's had strikingly more accuracy.
Keywords: Spam Email, decision trees, logistic regression, support vector machines.
I. INTRODUCTION
As the Rapid Development in web everybody is conveying through messages. With the utilization of messages parcel of spam sends are expanding step by step. Spam Email is ending up consistently developing threat with far ramifications for each client. We characterize spam as an email message that is undesirable essentially it is the electronic form of garbage mail. One reason for the expansion of spam is that mass email is exceptionally shoddy to send and despite the fact that it is conceivable to assemble channels that dismiss email on the off chance that it is from a known spammer, it is anything but difficult to acquire elective sending addresses. Spam represents 45% of all messages sent. About 14.5 billion spam messages are sent each and every day.36% of all spam is some type of publicizing. Spam wins senders around $7,000 every day. Spam costs organizations an astounding $20.5 billion consistently. The expense of spam could develop to $257 billion every year. In excess of 4 million tons of garbage sends are delivered yearly. The best phishing tricks target Drop box accreditations. Deceitful spam additionally comes through phishing messages, which are messages camouflaged as official correspondence from banks, online
Revised Manuscript Received on May07, 2019.
S Kranthi Reddy, Assistant Professor, Department of Computer Science & Engineering, Vignan Institute of Technology and Science, Deshmukhi, Yadadri Bhuvanagiri, Telangana
P Balaji Tarun, B.Tech(CSE), Vignan Institute of Technology and Science, Deshmukhi, Yadadri Bhuvanagiri, Telangana
S.Rushika, B.Tech(CSE), Vignan Institute of Technology and Science, Deshmukhi, Yadadri Bhuvanagiri, Telangana
P. Deekshith Reddy, B.Tech(CSE), Vignan Institute of Technology and Science, Deshmukhi, Yadadri Bhuvanagiri, Telangana
E.Anjala, B.Tech(CSE), Vignan Institute of Technology and Science, Deshmukhi, Yadadri Bhuvanagiri, Telangana
installment processors or some other associations a client may trust. Phishing messages ordinarily direct beneficiaries to a phony variant of the association's site, where the client is incited to enter individual data, for example login and Visa subtleties. Spam email may likewise convey different sorts of malware through document connections or contents, or contain connections to sites facilitating malware. Botnets enables spammers to utilize direction and-control servers, or C&C servers, to both reap email addresses and circulate spam. Snowshoe spam is the procedure of utilizing a wide scope of IP locations and email delivers with nonpartisan notorieties to disperse spam widely. Technical arrangements incorporate separating dependent on sender address or header content. Spam email is undesirable mail which contains data about specific product or some other administrations given by the organizations. These are part of issues with spam messages, for example, devours assets, for example, plate space and band width, takes client data, for example, individual subtleties, qualification subtleties and so on. To recognize spam messages there are two strategies in particular, non - machine learning and machine learning techniques. In this paper we primarily center around machine learning strategies that utilize classification algorithms to characterize whether an email is spam or not.
II. RELATEDWORK
Harris Drucker, Donghui Wu, and Vladimir N. Vapnik connected SVM, Boosting , Ripper, Rocchio, and Boosting trees on header and substance of spam email information. W.A. Awad and S.M. ELseuofi investigated the absolute most prominent machine learning classification algorithms, for example, Bayesian classification, k-NN, ANNs, SVMs, Artificial insusceptible framework and Rough sets on SpamAssassin dataset. Hanif Bhuiyan, Akm Ashiquzzaman, Tamanna Islam Juthi, Suzit Biswas and Jinat Ara made a Survey of Existing E-Mail Spam Filtering Methods Considering Machine Learning Techniques. Priyanka Chhabra, Rajesh Wadhvani, Sanyam Shukla assessed the execution of Non Linear SVM based classifiers with different kernel works over Enron Dataset. Alexy Bhowmick, Shyamanta M. Hazarika audited classification algorithms on various datasets. Nurul Fitriah Rusland, Norfaradilla Wahid, Shahreen Kasim, Hanayanti Hafit estimated the execution of Naive Bayes algorithm for email spam sifting on two datasets and test its execution, i.e., Spam Data and SPAMBASE datasets. Xavier Carreras and Lluis M'arquez indicated AdaBoost algorithm with certainty rated expectations is a very appropriate algorithm for tending to the spam separating issue on
the PU1 corpus dataset.
Spam Email Classification Using Machine
Learning Algorithms
III. MACHINELEARNINGINEMAIL CLASSIFICATION
Machine learning field is a subfield from the wide area of artificial intelligence, means to make machines ready to behave like human. Learning here methods understood, watch, speak to data about some factual wonder. In unsupervised learning one attempts to reveal concealed regularities (bunches) or to distinguish inconsistencies in the information like spam messages or system interruption. In email separating task a few highlights could be the sack of words or the headline examination. In this way, the contribution to email classification errand can be seen as a two section spam information E-mail classification undertakings are frequently separated into a few sub-assignments. In the first place, Data gathering and portrayal are for the most part issue explicit, second, email highlight determination and highlight decrease endeavor to diminish the dimensionality for the rest of the means of the undertaking. At long last, the email classification period of the process finds the genuine mapping between training set and testing set. In the accompanying area we hereby audit probably the fequent prevalent machine learning strategies.
Decision Tree
[image:2.595.324.527.68.205.2]Decision tree is a sort of supervised learning algorithm for the most part utilized in classification issues. It go down the line for the pair categorical and continuous input and output factors. By this strategy, we crack the populace or test into at least dual homogeneous sets (sub-populaces) in view of most critical splitter/differentiator in info factors. How about we take a gander at the fundamental phrasing utilized with Decision trees.
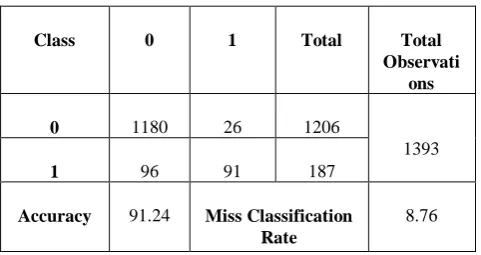
Table 1: Confusion matrix for Decision Tree on Training data
Class 0 1 Total Total
Observati ons
0 1180 26 1206
1393
1 96 91 187
Accuracy 91.24 Miss Classification Rate
8.76
[image:2.595.41.276.454.584.2]Table 2: Confusion matrix for Decision Tree on Test data.
Fig 1: Decision Trees graph on Spam Email Dataset
Logistic Regression:
Logistic Regression is used for classification problems. It predicts a binary result (0/1). We can consider logistic regression as a unique instance of linear regression model when the output is categorical , where we are utilizing log of chances as reliant variable. In basic words, it predicts the likelihood of event of an occasion by fitting information to a logit work.
The central condition of generalized linear model is: g(E(y)) = α + βx1 + γx2
To begin with logistic regression, I'll initially compose the straightforward linear regression condition with ward variable encased in a connection work:
g(y) = βo + β(Age) - (a)
p = exp(βo + β(Age)) = e^(βo + β(Age)) - (b)
To make the likelihood under 1, we should partition p by a number more prominent than p. This should basically be possible by:
p = exp(βo + β(Age))/exp(βo + β(Age)) + 1 = e^(βo + β(Age))/e^(βo + β(Age)) + 1 - (c)
Utilizing (a), (b) and (c), we can reclassify the likelihood as: p = e^y/1 + e^y - (d)
Where p is the probability of sucess. This (d) is the Logit Function On the off chance that p is the probability of sucess, 1-p will be the likelihood of disappointment which can be composed as:
q = 1 - p = 1 - (e^y/1 + e^y) - (e) Where q is the probability of failure On dividing, (d)/(e), we get,
In the wake of taking log on the two sides, we get,
Subsequent to substituting estimation of y, we'll get:
Class 0 1 Total Total
Observati ons
0 3557 62 3619
4179
1 275 285 560
Accuracy 91.94 Miss Classification Rate
[image:2.595.41.282.611.738.2]International Journal of Innovative Technology and Exploring Engineering (IJITEE) ISSN: 2278-3075, Volume-8 Issue-7, May 2019
Fig 2: Logistic Regression Curve
Class 0 1 Total Total
Observations
0 3169 0 3169
3279
1 45 515 560
Accuracy 98.92 Miss
Classification Rate
1.08
Table 3: Confusion Matrix for Logistic Regression on Training data.
Class 0 1 Total Total
Observations
0 1176 30 1206
1363
1 26 131 157
Accuracy 95.98 Miss
Classification Rate
4.02
[image:3.595.43.295.460.584.2]Table 4: Confusion Matrix for Logistic Regression on Test data
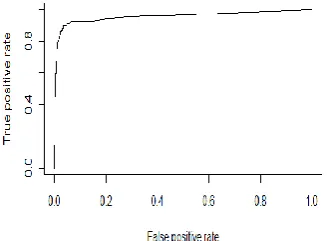
Fig 4: ROC curve for Spam email data:
Support Vector Machines:
Support Vector Machine (SVM) is a regulated machine learning calculation which can be utilized for both order and regression challenges. In any case, it is generally utilized in arrangement issues. In this calculation, we plot every datum thing as a point in n-dimensional space (where n is number of highlights you have) with the estimation of each component being the estimation of a specific arrange. At that point, we perform arrangement by finding the hyper-plane that separate the two classes great (take a gander at the beneath depiction).
Fig 5:Support Vector Machines
Support Vectors are just the co-ordinates of individual perception. Support Vector Machine is a wilderness which best isolates the two classes (hyperplane/line). In SVM, it is anything but difficult to have a direct hyper-plane between these two classes. Be that as it may, another consuming inquiry which emerges is, should we have to add this component physically to have a hyperplane. No, SVM has a method called the kernel trap. These are capacities which takes low dimensional information space and change it to a higher dimensional space for example it changes over not detachable issue to distinguishable issue, these capacities are called kernels. It is generally valuable in non-direct partition issue. Basically, it does some amazingly mind boggling information changes, at that point discover the process to separate the information dependent on the marks or outputs you've characterized.
Class 0 1 Total Total
Observations
0 3615 4 3619
4179
1 32 528 560
Accuracy 99.14 Miss
Classification Rate
0.86
[image:3.595.312.542.557.679.2] [image:3.595.82.246.635.755.2]Class 0 1 Total Total Observation
s
0 1184 22 1206
1393
1 26 161 187
Accurac y
96.5 5
Miss Classificatio
n Rate
[image:4.595.65.272.61.197.2]3.45
Table 6: Confusion Matrix for Support vector machines on Test data.
IV. MACHINELEARNINGMETHODS
PERFORMANCE
So as to test the execution of previously mentioned three techniques, a few corpora of spam and authentic messages must be aggregated; there are a few accumulations of email freely accessible to be utilized by scientists. spam.csv (https://www.kaggle.com) will be utilized in this test, which contains more than 5000 messages with the spam rate 13.40%. In this way we have partitioned the corpora into training and testing sets keeping, in each such set, similar extents of ham (real) and spam messages as in the first model set. Each training set delivered contained 75% of the first set while each test set contain 25% as Table 7.
Message collection Training Set
Testing Set
Ham Messages 3619 1206
Spam Messages 560 187
[image:4.595.312.543.241.553.2]Total Messages 4179 1393
Table 7: Corpora of Spam and Ham Messages
Stage 1: Reading the Dataset:
The dataset for email classification is gotten from kaggle.com, the data is separated at that point and spared into a comparing document. This document contains a few corpora of spam and authentic messages must be accumulated will be utilized in this test, which contains more than 5000 messages. The dataset is perused utilizing Rstudio.
Stage 2: Pre-processing the dataset
The dataset is perused and it is processed for email classification. Any invalid qualities present in the dataset are evacuated and the dataset substances are named, ham as non-spam and spam as spam. Basic Pre-processing is done, for example, making every one of the characters as lowercase, evacuating accentuation stamps and expelling void areas. The information is part into two sections in particular training and test information. Of entire, the information is part into two sections with a likelihood of 0.75 and 0.25 for training and testing the model.
Stage 3: Spam arrangement
Through the means above, we take standard classification email information and convert the information into sack of words, compute the recurrence of most utilized words. We search for the ideal classification utilizing the chose algorithm. We train the model utilizing training information and test the model utilizing test information.
Stage 4: Performance assessment:
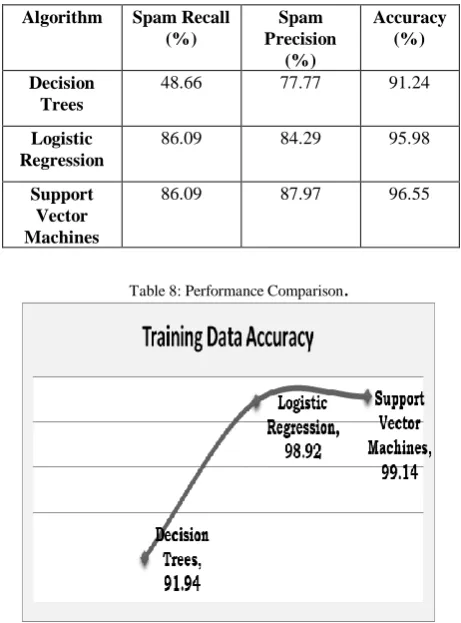
So as to test the execution of previously mentioned three strategies, we utilized the most well known assessment techniques utilized by the spam sifting scientists. Spam Precision (SP), Spam Recall (SR), Accuracy (A).
Performance Comparison
Table 8: Performance Comparison
.
Fig 9: Comparison Graphs for obtained results of Decision Tree, Logistic Regression and Support Vector Machines Algorithms on Training data and test
data.
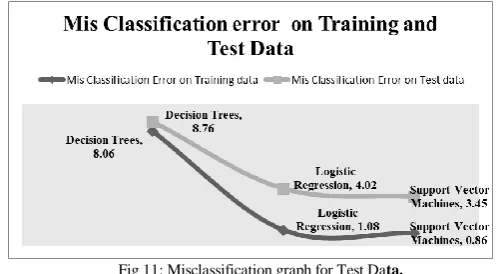
[image:4.595.311.544.586.720.2]Fig 10: Misclassification graph for both Training Data.
Algorithm Spam Recall (%)
Spam Precision
(%)
Accuracy (%)
Decision Trees
48.66 77.77 91.24
Logistic Regression
86.09 84.29 95.98
Support Vector Machines
International Journal of Innovative Technology and Exploring Engineering (IJITEE) ISSN: 2278-3075, Volume-8 Issue-7, May 2019
Fig 11: Misclassification graph for Test Data.
V. CONCLUSION
We outline the execution after effect of the three machine learning techniques in term of spam review, exactness and accuracy. Table 8: outline the aftereffects of the three classifiers. In term of accuracy we can find that The Support Vector machine strategy is the most accurate while the logistic regression and decision tree give us lower rate, while in term of spam exactness we can find that the Support Vector Machines has the most noteworthy accuracy among the three algorithms while the Decision Trees has the least exactness rate lastly we can find that the review rate among the three classifiers while the Support Vector Machines still has the most noteworthy execution when contrasted and different algorithms while the Decision Trees has the most noticeably bad execution.
REFERENCES
1. Harris Drucker, Senior Member, IEEE, Donghui Wu, Student Member, IEEE, and Vladimir N. Vapnik , “Support Vector Machines for Spam Categorization” IEEE TRANSACTIONS ON NEURAL NETWORKS, VOL. 10, NO. 5, SEPTEMBER 1999.
2. W.A. Awad1 and S.M. ELseuofi Math.&Comp.Sci.Dept., Science faculty, Port Said University Inf. System Dept.,Ras El Bar High inst, “MACHINE LEARNING METHODS FOR SPAM E-MAIL CLASSIFICATION, International Journal of Computer Science & Information Technology (IJCSIT)” , Vol 3, No 1, Feb 2011.
3. Xavier Carreras and Llu´ıs M`arquez TALP Research Center LSI Department Universitat Polit`ecnica de Catalunya (UPC), “Boosting Trees for Anti-Spam Email Filtering”.
4. Priyanka Chhabra, Rajesh Wadhvani, Sanyam Shukla, “Spam Filtering using Support Vector Machine”, Special Issue of IJCCT Vol.1 Issue 2, 3, 4; 2010 for International Conference [ACCTA-2010], 3-5 August 2010. 5. Hanif Bhuiyan, Akm Ashiquzzaman, Tamanna Islam Juthi, Suzit Biswas & Jinat Ara, “A Survey of Existing E-Mail Spam Filtering Methods Considering Machine Learning Techniques”, Global Journal of Computer Science and Technology: C Software & Data Engineering Volume 1 Issue 2 Version 1.0 Year 2018.
6. Alexy Bhowmick ,Shyamanta M. Hazarika, “Machine Learning for E-mail Spam Filtering: Review, Techniques and Trends”.
7. Nurul Fitriah Rusland, Norfaradilla Wahid, Shahreen Kasim, Hanayanti Ha_t, “Analysis of Na• _ve Bayes Algorithm for Email Spam 8. Filtering across Multiple Datasets”
9. Decision Tree Algorithm available at https://www.analyticsvidhya.com/blog/2016/04/complete-tutorial-tree-b ased-modeling-scratch-in-python/
10.Logistic Regression Algorithm available at https://www.analyticsvidhya.com/blog/2015/11/beginners-guide-on-logi stic-regression-in-r/
11.Support Vector Machines Algorithm available at https://www.analyticsvidhya.com/blog/2017/09/understaing-support-vec tor-machine-example-code/
12.Support Vector Machines Algorithm available at https://machinelearningmastery.com/support-vector-machines-for-machi ne-learning/
13.Source for dataset https://www.kaggle.com/