ESTIMATION OF LEVOFLOXACIN AND AZITHROMYCIN BY RP-HPLC IN TABLET DOSAGE FORM
A Dissertation submitted to
THE TAMIL NADU DR. M.G.R. MEDICAL UNIVERSITY, CHENNAI- 600 032.
In partial fulfilment of the award of the degree of MASTER OF PHARMACY
IN
Branch V – PHARMACEUTICAL ANALYSIS
Submitted by
Name : S. RADHAKRISHNAN Reg. No. 261630203
Under the guidance of
Dr. CAROLINE NIMILA, M.Pharm., Ph.D., Associate Professor
DEPARTMENT OF PHARMACEUTICAL ANALYSIS
J.K.K. NATTRAJA COLLEGE OF PHARMACY, KOMARAPALAYAM – 638 183.
CONTENTS
CHARPTER No.
TITLE PAGE No.
1 INTRODUCTION 1-35
2 AIM AND PLAN OF WORK 36-37
3 DRUG PROFILE 38-41
4 LITERATURE REVIEW 42-47
5 MATERIALS AND INSTRUMENTS
USED 48-90
6 RESULTS AND DISCUSSION 91-93
7 SUMMARY AND CONCLUSION 94-95
S. NO. LIST OF TABLES PAGE NO.
1 Classification of analytical method 4 2 Different types of chromatographic techniques 7 3 Physical properties of common HPLC solvents 13 4 Separation goals in HPLC method development 22 5 Sample and analyte information 23 6 System suitability parameters and Recommendation 29
7 List of Equipments 47
RSD : Relative standard deviation
HPLC : High performance liquid chromatography
ICH : International conference on harmonization of technical requirements for registration of pharmaceuticals for human use.
Q2R1 Validation of analytical procedures: Text and methodology
USP : United states pharmacopeia
IHS : In House Specification
R & D : Research and Development
N : Normality
M : Molarity
WS/RS : Working standard/Reference standard
SPL : Sample
STD : Standard
ASB : As such basis
AR : Analytical grade
STP : Standard testing procedure
Wt : Weight
nm : Nanometer Mg : Milligram cm : Centimeter
1. INTRODUCTION
1. 1 INTRODUCTION
Analytical methods development and validation play important roles in the discovery, development, and manufacture of pharmaceuticals. The current good manufacturing practice (CGMP) and Food Drug Administration (FDA) Guidelines insist for adoption of sound methods of analysis with greater sensitivity and reproducibility. Development of a method of analysis is usually based on prior art (or) existing literature, using the same (or) quite similar instrumentation .It is rare today that an HPLC-based method is developed that does not in same way relate (or) compare to existing, literature based approaches. Today HPLC (High performance liquid chromatography) is the method of choice used by the pharmaceutical industry to assay the intact drug and degradation products. The appropriate selection and chromatographic conditions ensure that the HPLC method will have the desired specificity. UV spectroscopy is also a simple analytical tool widely used for routine assay of drugs. Hence for the assay of the selected drugs HPLC and UV spectroscopy has been chosen for these proposed methods.
Pharmaceutical Analysis plays a major role today, and it can be considered as an interdisciplinary subject. Pharmaceutical analysis derives its principles from various branches like chemistry, physics. And microbiology etc. pharmaceutical Analytical techniques are applied mainly in two areas, quantitative analysis and qualitative analysis, although there are several other applications.
Drugs and pharmaceuticals are chemicals or like substances, which or of organic inorganic or other origin. Whatever may be the origin, we some property of the medicinal agent to measure them quantitatively or qualitatively.
In recent years, several analytical techniques have been evolved that combined two or more methods into one called “hyphenated” technique eg: GC/MS, LC/MS etc. The complete Analysis of a substance consists of four main steps.
The concept of analytical chemistry lies in the simple, precise and accurate measurements. These determinations require highly sophisticated instruments and methods like mass spectroscopy, gas chromatography, HPTLC, HPLC, etc. HPLC method is sensitive, accurate, precise and desirable for routine estimation of drugs in formulations.
Thereby it is advantageous than volumetric methods. Many HPLC methods has been developed and validated for the quantitative determination of various marketed drugs.
is a quantitative analytical method based on the structure and chemical properties of each active ingredient of the drug formulation.
Most of the drugs can be analyzed by HPLC method because of several advantages like rapidity, specificity, accuracy, precision, reproducibility, ease of automation and eliminates tedious extraction and isolation procedures.
On the literature survey, it was found that most of the analytical method available for the above mentioned drug is applicable for quantification in plasma samples, the most widely used method being liquid chromatography-mass chromatography. So it is felt that there is a need to develop accurate, precise analytical methods for the estimation of the drug in solid dosage formulation.
Newer analytical methods are developed for these drugs or drug combinations
of the below reasons:
• There may not be suitable method for a particular analyte in the specific matrix.
• Existing method may be too error prone or unreliable (have poor accuracy
and precision).
• Existing method may be expensive, time consuming, energy intensive and
may not be provide sensitive or analyte selectivity, and not easy for automation.
• Newer instrumentation and techniques may have evolved that provide
opportunities for improved methods.
• There may be need for an alternate method to confirm, for legal and
The newly developed analytical methods having their importance in different fields that include, research and development centre (R&D), Quality control department (QC). Approved testing laboratories, chemical Analysis laboratories etc. For analysis of these drugs different analytical methods are routinely being used.
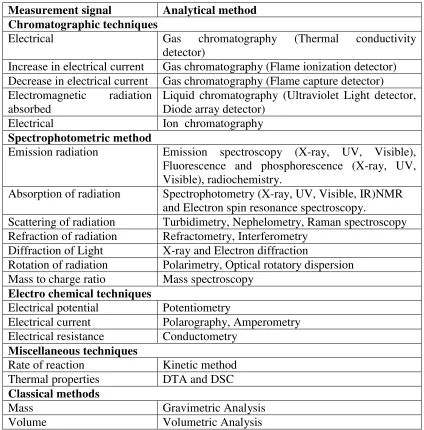
[image:8.595.100.524.306.736.2]The analytical methods are classified as classical and instrumental. These methods signal measured in those methods was mentioned in following table.
Table 1: Classification of analytical method
Measurement signal Analytical method Chromatographic techniques
Electrical Gas chromatography (Thermal conductivity detector)
Increase in electrical current Gas chromatography (Flame ionization detector) Decrease in electrical current Gas chromatography (Flame capture detector) Electromagnetic radiation
absorbed
Liquid chromatography (Ultraviolet Light detector, Diode array detector)
Electrical Ion chromatography
Spectrophotometric method
Emission radiation Emission spectroscopy (X-ray, UV, Visible), Fluorescence and phosphorescence (X-ray, UV, Visible), radiochemistry.
Absorption of radiation Spectrophotometry (X-ray, UV, Visible, IR)NMR and Electron spin resonance spectroscopy.
Scattering of radiation Turbidimetry, Nephelometry, Raman spectroscopy Refraction of radiation Refractometry, Interferometry
Diffraction of Light X-ray and Electron diffraction
Rotation of radiation Polarimetry, Optical rotatory dispersion Mass to charge ratio Mass spectroscopy
Electro chemical techniques
Electrical potential Potentiometry
Electrical current Polarography, Amperometry Electrical resistance Conductometry
Miscellaneous techniques
Rate of reaction Kinetic method Thermal properties DTA and DSC
Classical methods
1.2 CHROMATOGRAPHY
Techniques related to chromatography have been used for centuries to separate materials such as dyes extracted from plants. Russian botanist Tswett is credited with the discovery of chromatography. In 1903 he succeeded in separating leaf pigments using a solid polar stationary phase, It was not until 1930s that this technique was followed by Kuhn and Leder as well as Reichstein and van Euw for the separation of natural products. Martin and synge were awarded the Nobile prize for their work in 1941 in which they described liquid-liquid chromatography. Martin and synge applied the concept of theoretical plates as a measure of chromatographic efficiency. The term “chromatography” (Color-Writing derived from the Greek for Color-chroma and Write-Graphing).
CHROMATOGRAPHY IN THE PHARMACEUTICAL WORLD
of the prospective drug candidates, excipients, and final products. Effective and fast method development is of paramount importance throughout. This drug development life cycle. This requires a thorough understanding of HPLC principles and theory which have solid foundation for appreciating the many variables that are optimized during fast and effective HPLC method development and optimization.
1.3. HIGH PERFORMANCE LIQUID CHROMATOGRAPHY
1.3.1Brief Historical prospective of chromatography:
The historical development of liquid chromatography has been extensively reviewed and can be traced as far back as they early 1900, where the Russian botanist Zwett used a variant of liquid chromatography to separate some colored plant substances.
The focus was on modern development in HPLC, a term that was coined in late 1960s with the advent of more sophisticated instrumentation, better engineered separation columns, and reliable and highly efficient stationary phases and packaging materials.
High-pressure liquid chromatography quickly improved with the development of column packing materials. Additional convenience of on-line detectors became rapidly a powerful separation technique and is today called as High-performance liquid chromatography (HPLC)
One of the early problems with liquid state chromatography was the slow rate at which analysis took place. Early methods use gravity feed, and it was not uncommon diffusion and soon.
This problem was largely overcome by the advent High-performance liquid Chromatography (HPLC). In this system the pressure is applied to the column forcing the mobile phase through at much higher rate.
[image:11.595.117.523.510.736.2]For an analysis to take several days to complete. This led not only to great delay but also the excessive time on the column and thus inevitably led to loss of resolution by
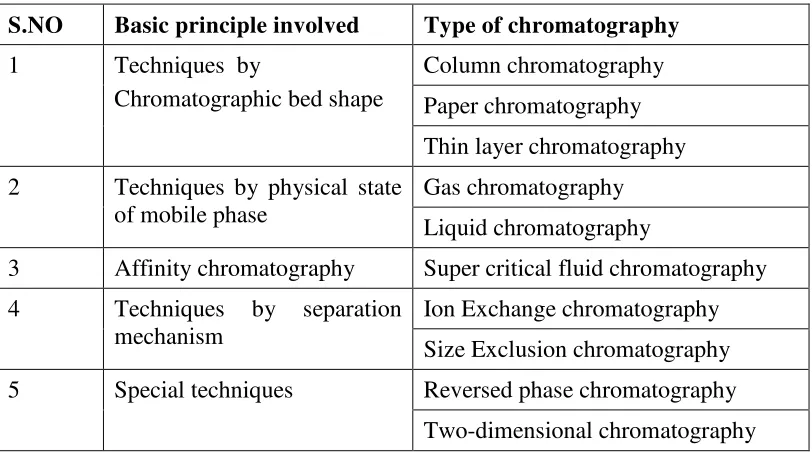
Table: 2. Different types of chromatographic techniques
S.NO Basic principle involved Type of chromatography
1 Techniques by
Chromatographic bed shape
Column chromatography Paper chromatography Thin layer chromatography 2 Techniques by physical state
of mobile phase
Gas chromatography Liquid chromatography
3 Affinity chromatography Super critical fluid chromatography 4 Techniques by separation
mechanism
Ion Exchange chromatography Size Exclusion chromatography 5 Special techniques Reversed phase chromatography
HPLC
In High-performance liquid chromatography, mobile as well as the stationary phase compete for the distribution of the sample components. In case of HPLC, separation is based on adsorption and partition. Adsorption chromatography employs high-surface area particles that adsorb the solute molecules. Usually a polar solid such as silica gel, alumina or porous glass beads and a non-polar mobile phase such as heptanes, octane or chloroform are used in adsorption chromatography.
In partition chromatography, the solid support is coated with a liquid stationary phase. The relative distribution of solutes between the two liquid phases determines the separation. The stationary phase can either polar or non-polar. If the stationary phase is non-polar, it is called normal phase partition chromatography. If the opposite case holds, it is called reversed-phase partition chromatography. In normal phase mode, the polar molecule partition preferentially in to the stationary phase and are retained longer than non-polar compounds. In reverse phase partition chromatography, the opposite behavior is observed.
1.3.2TYPES OF HPLC TECHNIQUES:
Based on modes of chromatography:
• Normal phase chromatography
• Reverse phase chromatography
Based on principle of separation:
• Adsorption chromatography
• Size exclusion chromatography
• Affinity chromatography
Based on elution technique:
• Isocratic separation
• Gradient separation
Based on the scale of operation:
• Analytical HPLC
• Preparative HPLC
Ion Exchange chromatography: Due to differences in the affinity of ions for the in exchange.
Size Exclusion chromatography: Due to differences in molecular weight and size of the molecules to be separated.
Affinity chromatography: Separation is based on a chemical interaction specific to the target species. The more popular revered phase mode uses a buffer and an added counter-ion of opposite charge to the sample with separation being influenced by pH, ionic strength, temperature, concentration of and type of organic co-solvents(s).
Chairal chromatography: Separation of the enantiomers can be achieved on chairal stationary phases by the formation of diastereomers.
1.3.3 MOST COMMONLY USED METHODS IN HPLC
Normal phase chromatography:
For a polar stationary bed like silica we need to choose a relatively non-polar Mobile phase. This mode of operation is termed as Normal phase chromatography. Here the least polar component elutes first, and increasing the mobile phase polarity leads to decrease in elution time. Non-polar solvents like pentane, Hexane, isooctane, cyclohexane, etc. are more popular. It is mainly used for separation of nonionic, non-polar to medium polar substances.
Reverse phase chromatography:
In 1960s, chromatographers started modifying the polar nature of the silanol group by chemically reacting silicon with organic silanes. The object was to make silica less polar or non-polar so that polar solvents can be used to separate water-soluble polar compounds. Since the ionic nature of the reverted, the chromatographic separation carried out with such silica is referred to as Reverse- phase chromatography. Here the most post components elutes first. Increasing mobile phase polarity leads to decrease In elution time. Common solvents used in this mode include Methanol /Acetonitrile /Isopropanol etc. Mostly used for separation of ionic and polar substances. The parameters that govern the retention in reversed phase system are the following:
a. The chemical nature of the stationary phase surface.
b. The type of solvents that compose the mobile phase.
Isocratic elution: A separation in which the mobile phase composition remains constant throughout the procedure is termed isocratic (meaning constant composition).
Gradient elution: The mobile phase composition does not have to remain constant. A separation in which the mobile phase composition is changed during the separation process is described as a gradient elution.
1.3.4 INSTRUMENTATION OF HPLC:
The mobile phase components HPLC instrument and their working functions are described below.
• Mobile phase and reservoir
• Solvent degassing system
• Pump
• Injector
• Colum
• Detector
Figure1: Schematic diagram of HPLC instrumentation
I.MOBILE PHASE AND RESERVIOR:
The most common type of solvent reservoir is a glass bottle. The mobile phase is pumped under pressure from one of several reservoirs and flows through the column at a constant rate. With micro particulate packing, there is a high-pressure drop across a chromatography column. Mobile phase used for HPLC are typically mixtures of organic solvents and water or aqueous buffers. The following points should also be considered when choosing a mobile phase:
• The essential to establish that the drug is stable in the mobile phase for at least
the duration of the analysis.
• Excessive salt concentrations should be avoided. High salt concentrations can
result in precipitation, which can damage HPLC equipment.
• The mobile phase should have a pH 2.5 and Ph 7.0 to maximize the lifetime of
the column.
• Reduce cost and toxicity of the mobile phase by using methanol instead of
acetonitrile when possible minimizes the absorbance of buffer.
• Use volatile mobile phase when possible, to facilitate collection of products and
LC-MS analysis. Volatile mobile phases include ammonium acetate, ammonium phosphate, formic acid, and trifluoroacetic acid. Some caution is needed as these buffers absorb below 220nm.
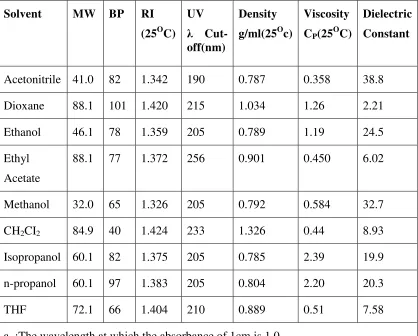
Table: 3.Physical properties of common HPLC solvents
Solvent MW BP RI (25OC)
UV
λ Cut-off(nm)
Density g/ml(25Oc)
Viscosity CP(25OC)
Dielectric Constant
Acetonitrile 41.0 82 1.342 190 0.787 0.358 38.8 Dioxane 88.1 101 1.420 215 1.034 1.26 2.21 Ethanol 46.1 78 1.359 205 0.789 1.19 24.5 Ethyl
Acetate
88.1 77 1.372 256 0.901 0.450 6.02
Methanol 32.0 65 1.326 205 0.792 0.584 32.7 CH2CI2 84.9 40 1.424 233 1.326 0.44 8.93
Isopropanol 60.1 82 1.375 205 0.785 2.39 19.9 n-propanol 60.1 97 1.383 205 0.804 2.20 20.3 THF 72.1 66 1.404 210 0.889 0.51 7.58 a :The wavelength at which the absorbance of 1cm is 1.0
II. SOLVENT DEGASSING SYSTEM:
III. PUMP:
High pressure pumps are needed to force solvents through packed stationary phase beds. Smaller bed particles require higher pressures. There are many advantages to using smaller particles, but they may not be essential for all separations.
The degree of flow of control also varies with pump expense. More expensive pumps include such state of the art technology as electronic feedback and multithreaded configurations. It is desirable to have an integrated degassing system, either helium purging, or membrane filtering.
IV. INJECTOR:
Sample introduction can be accomplished in various ways. The simplest method. Is touse an injection value in more sophisticated LC systems, automatic sampling devices are incorporated where the sample is introduced with the help of auto samplers and microprocessors in liquid chromatography, liquid samples may be injected directly and solid samples need only be dissolved in an appropriate solvent. Sample introduction techniques can be used with a syringe an injection valve.
V. COLUMN:
can also be used for reverse phase chromatography. Typical HPLC columns are 5, 10, 15, and 25cm in length and are filled with small diameter (3, 5 or 10µm) particles. The internal diameter of the columns is usually 4.6mm; this is considered the best compromise for sample capacity, mobile phase consumption, speed and resolution. However, if pure substances are to be collected (preparative scale), then larger diameter columns may be needed.
VI. DETECTOR:
The detection of UV light absorbance offers both convenience and sensitivity for molecules. When a chromophore is present, the wavelength of detection for a drug should be based on its UV spectrum in the mobile phase and not in pure solvents. The most selective wavelength for detecting a drug is frequently the longest wavelength maximum to avoid interference from solvents, Buffers and Excipient. Other method of detection can be useful are required in some instances.
1. Solute specific detectors (UV-Vis, Fluorescence, Electrochemical, Infra-red, Radio activity)
2. Bulk property detectors (Refractive index, Viscometer, conductivity)
3. Desolvation detector (Flame ionization etc)
4. LC-MS detectors
5. Reaction detectors
VII. DATA SYSTEM:
form for highly sophisticated computer analysis at a later time. The main goal in using electronic data systems is to increase analysis accuracy and precision, while reducing operator attention.
PERFORMANCE CALCULATIONS:
Calculating the following values (which can be included in a custom report) used to access overall system performance.
1. Relative retention
2. Theoretical plates
3. Capacity factor
4. Resolution
5. Peak asymmetry
6. Plates per meter
The following information furnishes the parameters used to calculate these system performance values for the separation of two chromatographic components. (Note: where the terms w and t both appear in the same equation they must be expressed the same units)
System suitability parameters:
1. Relative retention: The time elapsed between the injection of the sample
components in to the column and their detection is known as the retention time (Rt).
α = (t2-ta) / (t1-ta)
Where,
α =Relative retention
t1= Retention time of the one peak measured from point of injection.
t2 = Retention time of the second peak measured from point of injection.
ta = Retention time of an inert peak not retained by the column, measured from point
of injection.
2. Theoretical plates:
n =16 (t R / w) 2
Where,
n =Theoretical plates
tR = Retention time of the component
W = width of the base of the component peak using tangent method.
3. Capacity factor: The capacity factor describes the thermodynamic basis of the separation and its definition is the ratio of the amounts of the solute at the stationary and mobile phases within the analyte band inside the chromatographic column.
K1 = (t2/t a)-1
Where,
ta = Retention time of an inert peak not retained by the column, measured from point
of injection.
4. Resolution: the gap between two peaks
R =2 (t2- t1) / (w2-w1)
Where,
R =Resolution between a peak of interest (peak 2) and the peak preceding it (peak 1)
W2 = Width of the base of component peak 2
W1 = Width of the base of component peak 1
5. Peak asymmetry
T =W0.05/ 2f
Where,
T = Peak asymmetry, or tailing factor.
W0.05 = Distance from the leading edge to the tailing edge of the peak, measured at a
point 5 % of the peak height from the baseline.
f= Distance from the peak maximum to the leading edge of the peak.
6. PLATE PER METER:
N =n/L
Where,
N = plates per meter.
Advantages:
• HPLC separations can be accomplished in a minutes, in some cases even in
seconds.
• High resolution of complex sample mixture into individual components.
• Rapid growth of HPLC is also because of its ability to analyse substances that
are unsuitable for Gas Liquid chromatographic (GLC) analysis due to non-volatility or thermal-instability.
• Quantitative analyses are easily and accurately performed and errors of less than
1 % are common to most HPLC methods.
• Depending on sample type and detector used, it is frequently possible to measure
10-9 g or 1 ng of sample. With special detectors, analysis down to 10-12 pg has been reported.
• As HPLC is versatile, it can be applied to wide variety of samples like organic,
inorganic, high molecular weight liquids, solids and ionic-nonionic compounds.
Disadvantages:
• HPLC instrumentation is expensive and represents a major investment for many
laboratories.
• HPLC cannot handle gas samples.
• HPLC is poor identifier. It provides superior resolution but it does not provide
the information that identifies each peak.
• Only one sample can be analysed at a time.
1.4 ANALYTICAL METHOD DEVELOPMENT
Methods are developed for new products when no official methods are available. Alternate methods for existing (non-pharmacopoeial) products are developed to reduce the cost and time for better precision and ruggedness. Trail runs are conducted, method is optimized and validated.
When alternate method proposed is intended to replace the existing procedure, comparative laboratory data includes merits /demerits should be made available.The important factors, which to be taken into account to obtain reliable quantitative analysis, are
1. Careful sample and sample preparation
2. Appropriate choice of the column
3. Selection flow rate
4. Selection of detector wavelength
5. Selection of column temperature
Documentation starts at the very beginning of the development process. A system for full documentation of development studies must be established. Analyte standard characterization.
a) All known information about the analyte and its structure is collected i.e., physical and chemical properties.
b) The literature for all type of information related to the analyte is surveyed.
d) The required instrumentation is setup. Installation, operational and performance qualification of instrumentation using laboratory SOP,s are verified.
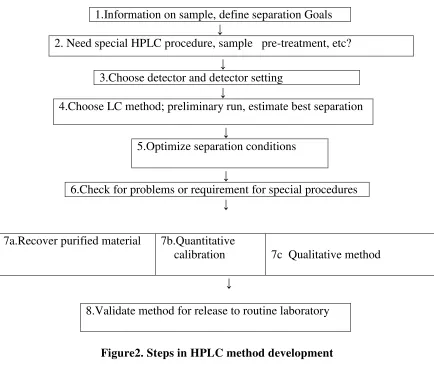
HPLC method development is based on few basic steps which include:
1.Information on sample, define separation Goals ↓
2. Need special HPLC procedure, sample pre-treatment, etc? ↓
3.Choose detector and detector setting ↓
4.Choose LC method; preliminary run, estimate best separation ↓
5.Optimize separation conditions ↓
6.Check for problems or requirement for special procedures ↓
↓
[image:25.595.95.529.173.547.2]8.Validate method for release to routine laboratory
Figure2. Steps in HPLC method development
Method goals:
Analytical method goals are often defined as method acceptance criteria for peak resolution, precision, specificity, sensitivity. For instance, pharmaceutical methods for potency assays of an API typically require the following:
• Minimal sample work-up (extra and inject if possible
• Robust method that doesn’t require extensive execution.
• Low cost per analysis.
7a.Recover purified material 7b.Quantitative
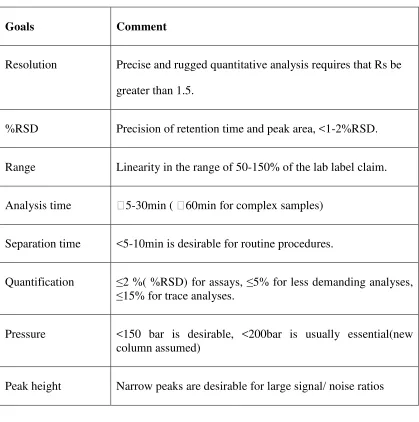
Table 4: Separation goals in HPLC method development
Goals Comment
Resolution Precise and rugged quantitative analysis requires that Rs be greater than 1.5.
%RSD Precision of retention time and peak area, <1-2%RSD.
Range Linearity in the range of 50-150% of the lab label claim.
Analysis time 5-30min ( 60min for complex samples)
Separation time <5-10min is desirable for routine procedures.
Quantification ≤2 %( %RSD) for assays, ≤5% for less demanding analyses,
≤15% for trace analyses.
Pressure <150 bar is desirable, <200bar is usually essential(new column assumed)
Peak height Narrow peaks are desirable for large signal/ noise ratios
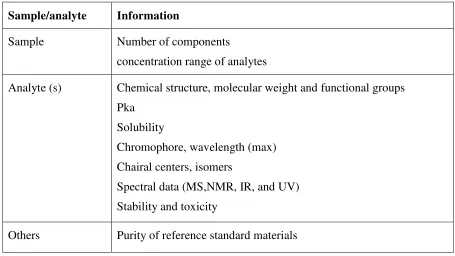
Sample analyte information:
Table 5: Sample and analyte information
Sample/analyte Information
Sample Number of components
concentration range of analytes
Analyte (s) Chemical structure, molecular weight and functional groups Pka
Solubility
Chromophore, wavelength (max) Chairal centers, isomers
Spectral data (MS,NMR, IR, and UV) Stability and toxicity
Others Purity of reference standard materials
1. Careful sampling and sample preparation:
Before beginning method development, it is need review what is known about the sample in to define the goals of separation. The sample related information that is important to summarized in
Table: The chemical composition of the sample can be providing valuable clues for the best choice of initial conditions for an HPLC separation.
Number of compounds present
Molecular weight of compounds
Pka values of compounds
UV spectra of compounds
2. Separation goals
The goals of HPLC separation need to be specified clearly, which include
• The use of HPLC to isolate purified sample components for spectral
identification Or quantitative analysis
• It may necessary to separate all degradants or impurities from a product for
reliable content assay or not
• In quantitative analysis, the required levels of accuracy and precision should be
known
• Whether a single HPLC procedure is sufficient for raw materials or one or more
different procedures are desired for formulations
• When the number of samples for analysis at one time is greater than 10, a run
time of less than 20 minutes often will be important. Knowledge on the desired HPLC equipment.
• HPLC equipment, HPLC experience and academic training do to operators have
3. Sample preparation: samples come in various forms
• Solutions ready for injection
• solutions that require dilution, buffering, addition of an internal
standard or other volumetric manipulation
• solids must be dissolved or extracted
• Samples that require pretreatment to remove interference and / or to protect the
4. Appropriate choice of the column:
The selection of the column in HPLC is somewhat similar to the selection of column in G.C, in the sense that, in the adsorption and partition modes, the separation mechanism is based on inductive forces, dipole-dipole interaction and hydrogen bond information.
Column plays the important role in achieving the chromatographic separation.
The following parameters should be considered while selecting a column:
i. length and diameter of the column
ii. packing material
iii. size and shape of the particles
iv. pore size, surface area and end capping
v. percentage of carbon loading
Columns with silica as a packing material used widely in normal phase chromatography, where the eluent (mobile phase) is non-polar consisting of various organic solvents and the stationary phase is polar. The silanol groups on the surface of the silica give it a polar character.
In reverse phase chromatography a wide variety of columns is available covering a wide range of polarity by cross linking the silanol groups with alkyl chains like C6, C8, C18 and Nitrile groups (-CN), phenyl groups (-C6H6) and amino
ORDER OF THE SILICA BASED COLUMNS
I---Non polar---Moderately polar---Polar---I
C18<C8<C6< Phenyl < Amino < Cyano <Silica
5. Selection of flow rate.
Flow rate is selected based on the follows:
• Retention time
• Column composition
• Separation impurities
• Peak symmetry
Preferably flow rate shall not be more than 2.5 ml/min. a flow rate that gives least retention times, good peak symmetries, least back pressure and better separation of impurities from API peak shell be selected.
6. Selection of detector wavelength:
Selection of detector wavelength is a critical step in finalization of the analytical method. To determine the exact wavelength standard API is injected into chromatographic system with photo Diode array detector and the wavelength, which gives higher response for the Compound
7. Selection of column temperature:
varied between 300To 800 c. if a column temperature above 800c is found necessary,
packing material which can Withstand to that temperature shall be chosen. The increase in column temperature generally will result in reduction in peak asymmetry and peak retentions.
1.5ANALYTICAL METHOD VALIDATION:
Method validation can be defined as (ICH) “Establishing documented evidence, which provides a high degree of assurance that a specific activity will consistently produce a desired result or product meeting is predetermined specifications and quality characteristics”.
Method validation study include system suitability, linearity, precision, accuracy, specificity, ruggedness, robustness, limit of detection, limit of quantification and stability of samples, reagents, instruments.
VALIDATION DEFINITION:
FDA defines validation as “Establishing documented evidence, which Provides a high degree of degree of assurance that a specific process will consistently produce a product of predetermined specifications and quality attributes.
OBJECTIVE OF METHOD VALIDATION:
TYPES OF ANALYTICAL PROCEDURES:
i. Identification tests
ii. Quantitative tests for impurities content
iii. Limit test for control of impurities
iv. Quantitative tests of the active moiety in samples of drug substances or drug product or
v. Other selected components(s) in the drug product.
vi. Dissolution testing for drug products
vii. Particle size determination for drug substances.
6. VALIDATION PARAMETERS (ICH).
Typical validation study include system suitability
I. Accuracy
II. Precision
III. Specificity
IV. Linearity
V. Detection limit
VI. Quantitation limit
VII. Range
1. System suitability
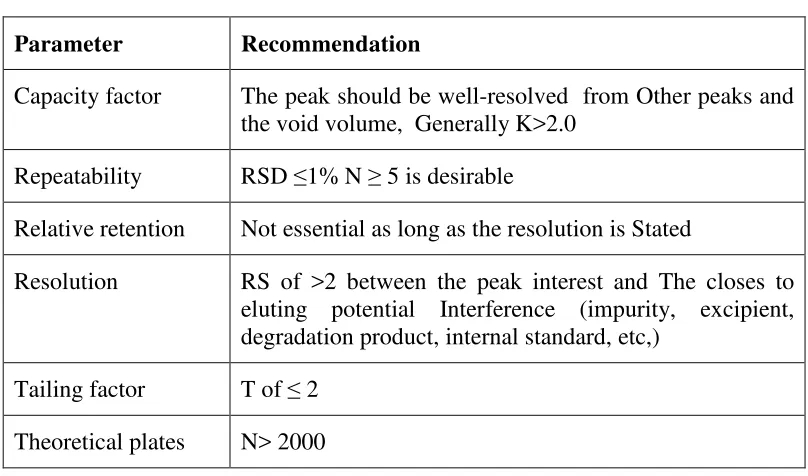
[image:33.595.119.523.314.552.2]Prior to the analysis of samples of each day, the operator that the HPLC system and procedure are capable of providing data of acceptable quality. This is accomplished with system suitability experiments, which can be defined as tests to ensure that the method can generate results of acceptable accuracy and precision. The requirements for system suitability are usually developed after method development and validation has been completed.
Table: 6. System suitability parameters and Recommendation
Parameter Recommendation
Capacity factor The peak should be well-resolved from Other peaks and the void volume, Generally K>2.0
Repeatability RSD ≤1% N ≥ 5 is desirable
Relative retention Not essential as long as the resolution is Stated
Resolution RS of >2 between the peak interest and The closes to eluting potential Interference (impurity, excipient, degradation product, internal standard, etc,)
Tailing factor T of ≤ 2 Theoretical plates N> 2000
Non-Interference of placebo:
2. Linearity
The linearity of a method is a measure of how well a calibration plot of response VS concentration approximates a straight line. Linearity can be assessed by performing Single measurement at several analyte concentrations. The data is then processed using a linear least- squares regression. The resulting plot slope, intercept and correlation coefficient provide the desired information on linearity.
3. Precision
Precision can be defined as “The degree of agreement among individual test results when the procedure is applied repeatedly to multiple samplings of a homogenous sample”. A More comprehensive definition proposed by the international conference on Harmonization (ICH) divides precision into three types.
1. Repeatability
2. Intermediate precision and
3. Reproducibility
Repeatability: is the precision of a method under the same operating conditions over a short period of time.
Intermediate precision: is the agreement of complete measurements (including standards) when the same method is applied many times within the same laboratory.
4. Accuracy:
The accuracy of a measurement is defined as the closeness of the measured value to the true value. In a method with high accuracy, a sample (whose “true value” is known) is analyzed and the measured value is identical to the true value. Typically, accuracy is represented and determined by recovery studies.
There are three ways to determine accuracy:
1. Comparison to a reference standard
2. Recovery of the analyte spiked into black matrix or
3. Standard addition of the analyte.
It should be clear how the individual or total impurities are to be determined. e.g., weight/ weight or area percent in all cases with respect to the major analyte.
5. Specificity/ selectivity
6. Ruggedness:
The ruggedness of an analytical method is the degree of reproducibility of test results Obtained by the analysis of the same samples under a variety of normal test conditions such as different laboratories, different analysts, using operational and environmental Conditions that may differ but are still within the specified parameters of the assay. The testing of the ruggedness is normally suggested when the method is to be used in more than one laboratory. Ruggedness normally expressed as the lack of the influence on the test results of operational and environmental variables of the analytical method.
For the determination or ruggedness, the degree of reproducibility of test result is determined as a function of the assay variable. This reproducibility may be compared to the precision of the assay under normal conditions to obtain a measure of the ruggedness of the analytical method.
7. Robustness:
The concept of robustness of an analytical procedure has been defined by the ICH as “a Measure of its capacity to remain unaffected by small, but deliberate variations in method Parameters”. A good practice is to vary important parameters in the method systematically and measure their effect on separation. The variable method parameters in HPLC technique may involve flow rate, column temperature, sample temperature, pH and mobile phase composition.
8. Stability:
day, One week, and one month, depending on need). Therefore, a few hours of standard and sample solution suitability can required even for short (10 min) separation. When more than one sample is analyzed (multiple lots of one sample or samples from different storage conditions from a single lot), automated, overnight runs often are performed for better lab efficiency such practices add requirements for greater solution stability.
9. Limit of Detection:
Limit of detection (LOD) is the lowest concentration of analyte in a sample that can be detected, but the necessarily quantitated, under the stated experimental conditions.
• Based on visual Evaluation
• Based on the standard Deviation of the Blank
• Based on the calibration curve
• Based on signal-to-noise: A signal-to-noise ratio of 3 or 2:1 is acceptable
LOD may be expressed as
LOD =3.3σ/s
Where, σ = the standard deviation of the response
S= the slope of the calibration curve
10. Limit of quantitation:
Limit of quantitation is the lowest concentration of analyte in a sample that can be Determined with acceptable precision and accuracy under the stated experimental conditions. Several approaches for determining the quantification limit are possible.
• Based on visual Evaluation
• Based on standard Deviation of the blink
• Based on the calibration curve
• Based on the signal-to-Noise Approach: A typical signal-to-Noise is 10:1
LOQ may be expressed as
LOQ = 10σ /s
Where, σ = standard deviation of the response
2. LITERATURE REVIEW
1. Enjem Karunaker Reddy et al.; An isocratic, reversed phase-liquid-chromatographic method was developed for the quantitative determination of Azithromycin and Levofloxacin in combined-dosage form. A Waters Symmetry Shielde Rp18, (250*4.6*5µ) column with mobilephase containing water pH 9.2 adjusted with di- Potassium hydrogen Phosphate: Methanol in the ratio of (60: 40, v/v) was used.The flow rate was 1.0 mL/min, column temperature was 30°C and effluents were monitored at 285 nm. The retention times of Azithromycin and Levofloxacin were 5.001min and 3.232min, respectively. The correlation co-efficient for Azithromycin andLevofloxacin was found to be 0.99 and 0.99, respectively. The proposed method was validated with respect to linearity, accuracy,precision, specificity, and robustness. Recovery of Azithromycin and Levofloxacin in formulations was found to be in the range of97-103% and 97-103% respectively confirms the non-interferences of the excipients in the formulation. Due to its simplicity,rapidness and high precision. The method was successfully applied to the estimation of Azithromycin and Levofloxacin in combined dosage form.
2. Yun Nairu1 et al.; A RP-HPLC method was developed for the determination of Levofloxacin and Azithromycin in CM129 medium,in order to provide an Analysis Method to Experiment which Azithromycin promote Levofloxacin to penetrate biomembrane.Method The analytical column was Waters C18.The mobile phase consisted of which methanol monopotasium phosphate buffer=29∶71(pH=2.53).The flow rate was 1.0 ml/min,and the detector was set at UV 210 nm.Results : The calibration curve was linear in the range of 10~160 µg/ml,Correlation coefficient of
was 99.83% with RSD of 1.08% and the average recovery of Azithromycin was 100.34% with RSD of 0.47%.Conclusion : This method has been applied to the determinate the concentrations of Levofloxacin and Azithromycin simultaneously.
3. M. Rachidi et al.; Azithromycin (AZT), an antibiotic belonging to the family of
macrolides, can be analyzed by a new spectrophotometric method based on the formation of an ion pair between this drug and an inorganic complex of (Mo(V)– thiocyanate) followed by its extraction with dichloroethane. This ion‐association complex shows an orange color and exhibits a maximum absorbance at 469 nm. The experimental conditions of the reaction were studied and optimized. The calibration graph was linear (r=0.9996) over the range 10−6 M–10−5 M of AZT. This simple and validated method has been successfully applied to the determination of azithromycin in pharmaceutical formulations with a mean relative standard deviation of 1.07% and mean recovery of 99.66%. The common excipients present in azithromycin formulations did not interfere in its determination. This new spectophotometric method has been applied successfully to illustrate the dissolution profiles of original tablets and generic compounds; hence, it could be employed in routine quality control of azithromycin in pharmaceutical dosage forms..
solvent evaporation method. The drug release profile was studied and it was found that the dissolution rate and the dissolution parameters of the drug from the physical mixture as well as solid dispersion were higher than those of the intact drug. FT- IR spectra revealed no chemical incompatibility between drug and urea. Drug-polymer interactions were investigated using differential scanning calorimetry (DSC) and Powder X-Ray Diffraction (PXRD).
5. Makarand Avhad et al.; An accurate, specific and precise UV spectrophotometric method was developed for the simultaneousdetermination of levofloxacin (LVF) and ambroxol (AMB) in pharmaceutical dosage forms. The method involves formation ofQ-absorbance equation at 219 (isoabsorptive point) and at 287 nm, using distilled water as a solvent. The linearity for bothlevofloxacin and ambroxol was in the range of 2-14 µg/ml and 5-35 µg/ml respectively. The % recovery was found to be 100-101% and 101-102% for levofloxacin and ambroxol respectively indicating proposed method is accurate and precise forsimultaneous estimation of levofloxacin and ambroxol in tablets.
0.2 µg/mL (moxifloxacin). The method is successfully applied to plasma drug level monitoring in a volunteer receiving single therapeutic doses of levofloxacin or moxifloxacin at two different occasions.
7. M. Senthil Raja1 et al.; A simple reverse phase liquid chromatographic method has been developed and subsequently validated for simultaneous determination of Azithromycin and Ambroxol Hydrochloride in combined dosage form. Theseparation was carried out using a mobile phase consisting of acetonitrile and mono basic potassium phosphate buffer of pH 8.5 in the ratio of 65:35 v/v. The column used was C18 phenomenex Gemini 5m, 250cm x 4.6mm id with flow rate of2ml/min using PDA detection at 220nm. The described method was linear over a concentration range of 96-145mg/mland 80-125mg/ml for the assay of Azithromycin and Ambroxol Hydrochloride respectively. The retention times of Ambroxol and Azithromycin were found to be 3.7min and 6.1min respectively. Results of analysis were validatedstatistically and by recovery studies. The limit of quantification (LOQ) for Azithromycin and Ambroxol Hydrochloridewere found to be 96.7mg/ml and 8.35mg/ml respectively. Then the limit of detection (LOD) for Azithromycin and Ambroxol Hydrochloride were found to be 31.91 mg/ml and 2.75 mg/ml respectively.
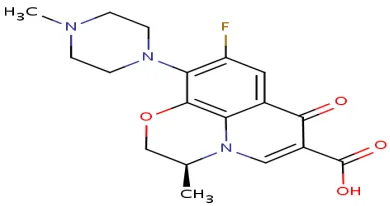
3.1 LEVOFLOXACIN
It inhibits bacterial type II topoisomerases, topoisomerase IV and DNA gyrase.
Structure: IUPAC Name Molecular formula Molecular Weight Solubility Pka
Mechanism of action:
Levofloxacin inhibits bacterial type II topoisomerases, topoisomerase IV and DNA gyrase. Levofloxacin, like other fluoroquinolones, inhibits the A subuni DNA gyrase, two subunits encoded by the gyrA gene. This results in strand breakage on a bacterial chromosome, supercoiling, and resealing; DNA replication and transcription is inhibited.
3. DRUG PROFILE
3.1 LEVOFLOXACIN
[image:44.595.212.407.223.326.2]It inhibits bacterial type II topoisomerases, topoisomerase IV and DNA gyrase.
Fig no:3 Structure of Levofloxacin
: (2S)-7-fluoro-2-methyl-6-(4-methylpiperazin
oxo-4-oxa-1-azatricyclo[7.3.1.0^{5,13}]trideca
5(13),6,8,11-tetraene-11-carboxylic acid
: C18H20FN3O4
: 361.3675 /mol
: slightly soluble in water, soluble in glacial acetic acid.
: 5.45
:
Levofloxacin inhibits bacterial type II topoisomerases, topoisomerase IV and DNA gyrase. Levofloxacin, like other fluoroquinolones, inhibits the A subuni DNA gyrase, two subunits encoded by the gyrA gene. This results in strand breakage on a bacterial chromosome, supercoiling, and resealing; DNA replication and transcription is inhibited.
It inhibits bacterial type II topoisomerases, topoisomerase IV and DNA gyrase.
methylpiperazin-1-yl)-10-
azatricyclo[7.3.1.0^{5,13}]trideca-
in water, soluble in glacial acetic acid.
Indications: For the treatment of bacterial conjunctivitis caused by susceptible strains of the following organisms: Corynebacterium species, Staphylococus
aureus, Staphylococcus epidermidis, Streptococcus pneumoniae, Streptococcus
(Groups C/F/G), Viridans group streptococci, Acinetobacter lwoffii, Haemophilus
influenzae, Serratia marcescens..
Absorption: Absorption of ofloxacin after single or multiple doses of 200 to 400 mg is predictable, and the amount of drug absorbed increases proportionately with the dose.
Protein binding: 24-38% (to plasma proteins)
Metabolism: Mainly excreted as unchanged drug (87%); undergoes limited metabolism in humans.
Pharmacodynamics: Levofloxacin, a fluoroquinolone antiinfective, is the optically active L-isomer of ofloxacin. Levofloxacin is used to treat bacterial conjunctivitis, sinusitis, chronic bronchitis, community-acquired pneumonia and pneumonia caused by penicillin-resistant strains of Streptococcus pneumoniae, skin and skin structure infections, complicated urinary tract infections and acute pyelonephritis.
Half Life: 6-8 hours
Route of elimination:
Mainly excreted as unchanged drug in the urine.
Toxicity:
3.2 AZITHROMYCIN
It binds to the 50S subunit of the 70S bacterial ribosomes, and therefore inhibits RNA-dependent protein synthesis in bacterial cells.
Structure:
IUPAC Name: (2R,3S,4R,5R,8R,10R,11R,12S,13S,14R) (dimethylamino)-3-hydroxy {[(2R,4R,5S,6S)-5-hydroxy 3,5,6,8,10,12,14-heptamethyl Molecular formula Molecular Weight Solubility Pka
Mechanism of action:
Azithromycin binds to the 50S subunit of the 70S bacterial ribosomes, and therefore inhibits RNA
Absorption:
Absorption is not affected by food. Azithromycin is ext
AZITHROMYCIN
[image:46.595.218.412.202.291.2]It binds to the 50S subunit of the 70S bacterial ribosomes, and therefore dependent protein synthesis in bacterial cells.
Fig no:4 Stuctue of Azithromycin
(2R,3S,4R,5R,8R,10R,11R,12S,13S,14R)-11-{[(2S,3R,4S,6R) hydroxy-6-methyloxan-2-yl]oxy}-2-ethyl-3,4,10
hydroxy-4-methoxy-4,6-dimethyloxan-2-yl]oxy} heptamethyl-1-oxa-6-azacyclopentadecan-15-one
: C38H72N2O12
: 748.9845 gm/mol
: Freely soluble in methanol, slightly soluble in 95%ethonol,very slightly soluble in water
: 8.74
Mechanism of action:
binds to the 50S subunit of the 70S bacterial ribosomes, and therefore inhibits RNA-dependent protein synthesis in bacterial cells..
Bioavailability is 37% following oral administration. Absorption is not affected by food. Azithromycin is extensively distributed in tissues It binds to the 50S subunit of the 70S bacterial ribosomes, and therefore
{[(2S,3R,4S,6R)-4- 3,4,10-trihydroxy-13-
yl]oxy}-Freely soluble in methanol, slightly soluble in very slightly soluble in water
binds to the 50S subunit of the 70S bacterial ribosomes, and dependent protein synthesis in bacterial cells..
with tissue concentrations reaching up to 50 times greater than plasma concentrations. Drug becomes concentrated within macrophages and polymorphonucleocytes giving it good activity against Chlamydia trachomatis.
Protein binding: Serum protein binding is variable in the concentration range approximating human exposure, decreasing from 51% at 0.02 µg/mL to 7% at 2 µg/mL.
Metabolism: Hepatic. In vitro and in vivo studies to assess the metabolism of azithromycin have not been performed.
Pharmacodynamics:
Azithromycin, a semisynthetic antibiotic belonging to the macrolide subgroup of azalides, is used to treat STDs due to chlamydia and gonorrhea, community-acquired pneumonia, pelvic inflammatory disease, pediatric otitis media and pharyngitis, and Mycobacterium avium complex (MAC) in patients with advanced HIV disease. Similar in structure to erythromycin. azithromycin reaches higher intracellular concentrations than erythromycin, increasing its efficacy and duration of action.
Route of elimination:
Biliary excretion of azithromycin, predominantly as unchanged drug, is a major route of elimination.
Half life: 68 hours
AIM AND OBJECTIVE
4. 1 AIM & OBJECTIVE
Existing literature reveals that Levofloxacin and Azithromycin can be analyzed by UV detection, HPTLC, HPLC individually and combination with other drugs in bulk material and pharmaceutical forms.
A comprehensive, validated and simple analytical simultaneous method development and validation of Levofloxacin and Azithromycin is, therefore, crucial. No economic, simple and precise HPLC method was there for simultaneous estimation of Levofloxacin and Azithromycin in bulk and pharmaceutical dosage forms. Therefore, in proposed project a successful attempt has been made to develop, simple, Accurate, and economic methods for analysis of Levofloxacin and Azithromycin tablets validated.
OBJECTIVE
PLAN OF WORK
In order to develop a simple, reliable and an accurate method development and validation of Levofloxacin and Azithromycin in pharmaceutical dosage form by Reverse phase HPLC and validate the method for its repeatability and reproducibility
Plan of the proposed work includes the following steps:
• Selection of drug and literature survey.
• Solubility studies and optimization of conditions.
• Analytical method(s) development using HPLC etc.,
• Assay of the drugs(s) in marketed formulations using the proposed method(s).
• Procurement of raw materials.
• Establishment of system suitability parameters.
• Trails for the method development of Levofloxacin and Azithromycin Setting
of the optimized method.
• Validation of the optimized method for Levofloxacin and Azithromycin
Validation parameters include
System suitability
precision
Linearity
Accuracy
Range
Ruggedness
Robustness
MATERIALS AND METHODS
6.1 INSTRUMENTS/EQUIPMENT USED
Instruments:
• WATERS HPLC, Model: Aglient 2695, Photo diode array detector (PDA), with
[image:51.595.130.524.372.582.2]an automated sample injector. The output signal was monitored and integrated using Empower 2 software.ELIPSE C8 (150mm*4.6, 5 µm, Make: Waters) column was used for separations.
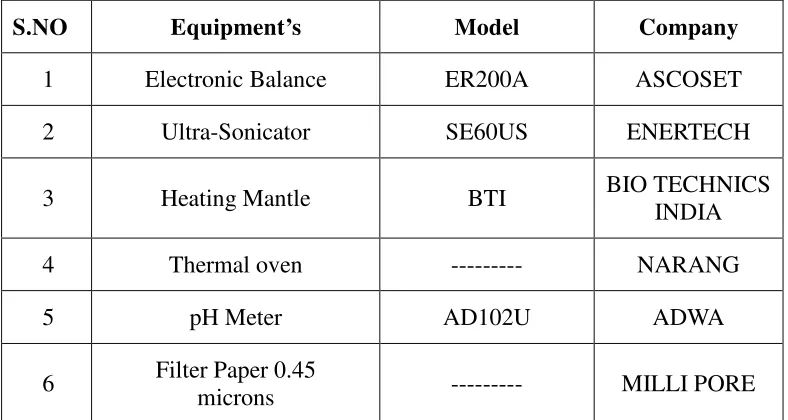
Table 7 : List of Equipments
S.NO Equipment’s Model Company
1 Electronic Balance ER200A ASCOSET 2 Ultra-Sonicator SE60US ENERTECH
3 Heating Mantle BTI BIO TECHNICS INDIA 4 Thermal oven --- NARANG 5 pH Meter AD102U ADWA
6 Filter Paper 0.45
6.2 CHEMICALS AND REAGENTS USED
Table no.8: List of chemicals and reagents used
S. No. Chemicals/standards and reagents Grade Make
1 KH2PO4 AR Finar
2 Methanol HPLC Merck
3 Water HPLC Loba Chemi
4 DiPotassium hydrogen phosphate AR Dr. Reddy’s
5 Levofloxacin NA Dr. Reddy’s
5.3 METHOD DEVELOPMENT
The UV spectrums of Levofloxacin and Azithromycin under these mobile phase conditions were shown below and from these spectrums, Lambda Max 265 nm were observed.
3.157 Peak 1
227.3
294.9
A
U
0.00 0.50
3.438 Peak 2
247.4
379.5
A
U
0.00 0.20 0.40
nm
METHOD DEVELOPMENT TRAILS:
Trial-1
Mobile Phase : 0.1%OPA: Methanol (600:400)
Column : Agilent ZorbaxC18, 250x4.6, 5µ
Flow Rate : 1.0ml/min
Injection Volume : 10 µl
Column Temperature : 30˚C
[image:54.595.102.459.123.524.2]Detector : 265nm
Fig. no.8: Typical chromatogram of trail 1
Observation: There is no second peak
Reason: May low Concentration
May be insoluble of Drug
3
.1
5
6
A
U
0.00 0.20 0.40
Minutes
0.00 1.00 2.00 3.00 4.00 5.00 6.00
Trial-2
Mobile Phase : 0.1%OPA: Methanol (600:400)
Column : Agilent ZorbaxC18, 250x4.6, 5µ
Flow Rate : 1.0ml/min
Injection Volume : 10 µl
Column Temperature : 30˚C
[image:55.595.108.509.86.488.2]Detector : 265nm
Fig. no. 9: Typical chromatogram of trail 2
Observation: Even there is no second peak
Reason: May be Mobile Phase Ph problem
2
.2
6
6
A
U
0.00 0.50 1.00 1.50 2.00 2.50 3.00
Minutes
0.00 0.20 0.40 0.60 0.80 1.00 1.20 1.40 1.60 1.80 2.00 2.20 2.40 2.60 2.80 3.00 3.20 3.40 3.60 3.80
Name Retention Time
Area USP Tailing USP Plate Count
1 Levofloxac in
Trial-3
Mobile Phase : KH2PO4: Methanol (800:200)
Column : Agilent ZorbaxC18, 250x4.6, 5µ
Flow Rate : 1.0ml/min
Injection Volume : 10 µl
Column Temperature : 30˚C
[image:56.595.111.500.79.606.2]Detector : 265nm
Fig. no.10: Typical chromatogram of trail 3
Name Retention Time
Area USP Resolution
USP Tailing
USP Plate Count 1 Levofloxac
in
3.456 1655193 0.72 8570
2 Azithromy cin
8.558 182768 20.25 1.07 10061
Observation: Yes we got two peaks with good resolution but second peak response is very poor.
3 .4 5 6 8 .5 5 8 A U 0.00 0.05 0.10 0.15 0.20 0.25 Minutes
Trial-4
Mobile Phase : KH2PO4: Methanol (600:400)
Column : Agilent ZorbaxC18, 250x4.6, 5µ
Flow Rate : 1.0ml/min
Injection Volume : 10 µl
Column Temperature : 30˚C
[image:57.595.105.523.104.564.2]Detector : 265nm
Fig. no.11: Typical chromatogram of trail 4
Observation: Yes we got two peaks but low resolution
Reason: May be buffer volume low in Mobile Phase
3
.9
3
6 5.0
0 6 A U 0.00 0.02 0.04 0.06 Minutes
0.00 0.50 1.00 1.50 2.00 2.50 3.00 3.50 4.00 4.50 5.00 5.50 6.00 6.50 7.00 7.50 8.00 8.50 9.00 9.50 10.00
Name Retention Time
Area USP Resolution
USP Tailing USP Plate Count 1 Levofloxaci
n
3.936 520470 1.21 5853
2 Azithromyc in
Trial-5
Mobile Phase : K2HPO4: Methanol (400:600)
Column : Agilent ZorbaxC18, 250x4.6, 5µ
Flow Rate : 1.0ml/min
Injection Volume : 10 µl
Column Temperature : 30˚C
[image:58.595.110.474.81.550.2]Detector : 265nm
Fig. no. 12: Typical chromatogram of trail 5
Observation: Yes we got two peaks but low resolution
Reason: May be buffer volume low in Mobile Phase
2 .6 2 0 2 .9 3 0 0.00 0.10 0.20 0.30 0.40 0.50 0.60 0.70 0.80 Minutes
0.00 1.00 2.00 3.00 4.00 5.00 6.00 7.00 8.00 9.00 10.00 11.00 12.00 13.00 14.00 15.00 16.00 17.00 18.00
Name Retention Time
Area USP Resolution
Trial-6
Mobile Phase : K2HPO4: Methanol (400:600)
Column : Agilent ZorbaxC18, 250x4.6, 5µ
Flow Rate : 1.0ml/min
Injection Volume : 10 µl
Column Temperature : 30˚C
[image:59.595.110.458.105.478.2]Detector : 265nm
Fig. no. 13: Typical chromatogram of trail 6
Name Retenti on Time
Area USP Resoluti on USP Tailing USP Plate Count
1 Levofloxacin 3.154 1058576 2.33 1.35 14206 2 Azithromycin 3.436 1022805 1.55 11075
Observation:
RT was found to be good and the peak symmetry of both drugs were good. And the resolution theoretical plate count and tailing were within the limits and it is used for validation of the method.
3
.1
5
4 3.4
3 6 A U 0.00 0.05 0.10 0.15 0.20 0.25 Minutes
OPTIMIZED METHOD
Chomatographic parameters:
Mobile Phase : K2HPO4: Methanol (400:600)
Column : Agilent ZorbaxC18, 250x4.6, 5µ
Flow Rate : 1.0ml/min
Injection Volume : 10 µl
Column Temperature : 30˚C
Detector : 265nm
Procedure:
[image:60.595.127.510.482.604.2]Inject 10µL of standard, sample into chromatographic system and measure the areas for the Levofloxacin and Azithromycin peaks and calculate the % assay by using the formula
Fig. no.14: Chromatogram for optimized method
Name Retenti on Time
Area USP Resoluti on USP Tailing USP Plate Count
1 Levofloxacin 3.154 1058576 2.33 1.35 14206 2 Azithromycin 3.436 1022805 1.55 11075
3
.1
5
4 3.4
3 6 A U 0.00 0.05 0.10 0.15 0.20 0.25 Minutes
Observation:
Peeks are well separated all the parameters are within the limits. For quantitative analytical purpose wavelength was set at 265 nm, which provided better reproducibility.
PREPARATION OF MOBILE PHASE:
Transfer 500ml of HPLC water into 500ml of beaker and DiPotassium hydrogen phosphate adjust pH 3.5 using O-phosphoric acid. Transfer the above solution 400mlof K2HPO4, 600ml of Methanol is used as mobile phase. They are mixed and sonicated for 20min.
PREPARATION OF THE LEVOFLOXACIN AND AZITHROMYCIN STANDARD AND SAMPLE SOLUTION:
PREPARATION OF STANDARD SOLUTION:
Accurately weigh and transfer 100mg of Levofloxacin and Azithromycin into 100ml of volumetric flask and add 10ml of Methanol and sonicate 10min (or) shake 5min and make with water. Transfers the above solution into 5ml into 50ml volumetric flask dilute to volume with water.
PREPARATION OF SAMPLE STOCK SOLUTION:
6.4 ASSAY RESULT FOR FORMULATION
Label contains: Each film coated tablet contains
Levofloxacin - 500mg.
Azithromycin -500 mg.
Average weight of each tablet is 1383.0mg
Purity of working standards:
1. Levofloxacin: %purity-99.1%
2. Azithromycin: % purity –99.7%
Sample preparation:
10 tablets were weighed and crushed, from the powdered tablets, weighed accurately about 500mg(500mg Levofloxacin and 500mg Azithromycin) into a 100 ml volumetric flask and 50 ml of mobile phase was added. The mixture was subjected to sonication for 20 min with intermediate shaking for complete extraction of drugs. Filtered and cooled to room temperature and solution was made up to mark with mobile phase. From the above solution 5 mL is taken and further diluted in 25 ml volumetric flasks with mobile phase. To acquire a concentration of 500mg Levofloxacin and 500mg Azithromycin.
Standard preparation:
was added. The mixture was subjected to sonication for 20 min with intermediate shaking for complete extraction of drugs. Filtered and cooled to room temperature and solution was made up to mark with mobile phase. From the above solution 5 ml is taken and further diluted in 25 mL volumetric flasks with mobile phase.To acquire a concentration of 500mg Levofloxacin and 500mg Azithromycin.
Procedure:
Separately injected both the standard (2 injections) and sample preparations (2 injections) into the chromatographic system and recorded the peak area responses.
% percentage content =
Sample area×Sample dilution ×Avg weight×standard weight ×purity of working standard ×100
6.5 METHOD VALIDATION
1. SYSTEM SUITABILITY:
Tailing factor for the peaks due to Levofloxacin and Azithromycin in standard solution should not be more than 2.0.Theoretical plates for the Levofloxacin and
Azithromycin peaks in standard solution should not be less than 2000.
2. SPECIFICITY:
Solution of standard, sample, blank and placebo were prepared as per test procedure and injected into the HPLC system.
Acceptance criteria:
Chromatogram of standard and sample should be identical with near Retention time.
Blank interference:
A study to establish the interference of blank was conducted. Diluent was injected into HPLC system as per the test procedure.
Acceptance criteria:
3. LINEARITY
Prepare a series of standard solutions and inject into HPLC system. Plot the graph of standard versus the actual concentration in µg/ml and determine the coefficient of correlation and basis for 100% response.
Acceptance criteria:
Linearity regression coefficient of average peak area response of replicate injections plotted against respective concentration should not be less than 0.999. The % y-intercept as obtained from the linearity data (without extrapolation through origin 0, 0) should be within ±2.0.
Statistical Evaluation:
A graph between the concentration and the average area was plotted. Points for linearity were observed. Using the method of least squares, a line of best fit was taken and the correlation Coefficient, slope and, y-intercept were calculated.
4. PRECISION:
Preparation of sample:
The method precision parameters were evaluated from sample chromatograms obtained, by calculating the % RSD of peek areas from 6 replicate injection.
Acceptance criteria: The injection reproducibility requirements are met if the %RSD for peak areas is not more than 2.0 and for retention times is not more than 2.0.
5. RECOVERY/ACCURACY
Recovery study can be performed in the concentration range of 80% to 120% of the target concentration of the test. Minimum 3 concentrations are recommended.
Acceptance criteria:
The average percentage recovery was between 98-102% and Relative standard deviation of these recovery concentrations was less than 2%.
6. LIMIT OF DETECTION
The sensitivity of measurement of Levofloxacin and Azithromycin by use of proposed method was estimated in terms of the limit of detection (LOD). The LOD was calculated by the use of signal to noise ratio. In order to estimate the LOD value, the blank sample was injected six times and peak area of this blank was calculated as noice level. The LOD was calculated as three times the noise level.