n
eurostat
Theme 2
Economy and finance
Series Β
Short-term trends
ISSN 1011-0844
CU-EMS INFORMATION
5 D 1988
Monthly
E X C H A N G E RATES: upward movement of sterling.
The strong upward movement of sterling during the recent months continued also in April. During the last two
months (March - April) the pound appreciated by 4.5% vis-à -vis the ECU, by 5.1% against the DM, by 6.3%
against the dollar, and by 3.2% against the yen. Analogous was its appreciation against the other Community
currencies.
A number of factors seem to have contributed to this sterling's strength: positive interest differentials in favour
of the pound, good macroeconomic developments, prospects for higher oil prices and, finally, high rates of the
domestic credit expansion which make difficult a further cut of the interest rates. Future developments in the
current account of the balance of payments are expected to determine, to a large degree, whether the present
pound's exchange rates are sustainable.
The persistent US trade deficit ($13.8bn in February up from $12.8bn in January) provoked short-term capital
movements away from dollar assets and led to a net retreat of the dollar. This falling movement was halted by
the co-ordinated intervention of the central banks of the currencies on demand, particularly of the Bank of Japan.
In late April and early May, the dollar regained some ground vis-à-vis the ECU and the other main currencies.
The low saving-to-income ratio of the US economy seems to be at the origin of the said persistence of the deficit
and the dollar weakness.
The short-term capital movements associated with the said pound appreciation and dollar weakness, provoked
certain tensions inside the EMS which were absorbed rather easily. These events, as well as the experience of the
stock market crash of last October, showed that the EMS resists rather well to the externally originating
financial shocks. Concerning the behaviour of the individual EMS currencies, noteworthy were the performance
of the Dutch guilder, which occupies the upper end of the currencies grid, as well as a certain weakness of the
Italian lira.
Contents
I.
A graph of the bilateral fluctuations of the EMS currencies.
II.
Yearly and monthly issues of ECU-bonds.
III.
Interest rates on ECU deposits and yields on ECU bonds.
IV.
Latest month's ECU bond issues.
V.
Consumer price indices in national currencies.
VI.
Consumer price indices in ECU.
eurostat
OFICINA ESTADÍSTICA DE LAS COMUNIDADES EUROPEAS DE EUROPÆISKE FÆLLESSKABERS STATISTISKE KONTOR STATISTISCHESAMT DER EUROPÄISCHEN GEMEINSCHAFTEN ΣΤΑΤΙΣΤΙΚΗ ΥΠΗΡΕΣΙΑ ΤΩΝ ΕΥΡΩΠΑΪΚΩΝ ΚΟΙΝΟΤΗΤΩΝ STATISTICAL OFFICE OF THE EUROPEAN COMMUNITIES OFFICE STATISTIQUE DES COMMUNAUTÉS EUROPÉENNES ISTITUTO STATISTICO DELLE COMUNITÀ EUROPEE
BUREAU VOOR DE STATISTIEK DER EUROPESE GEMEENSCHAPPEN SERVIÇO DE ESTATÍSTICA DAS COMUNIDADES EUROPEIAS
L-2920 Luxembourg - Tél. 43011 - Télex : Comeur Lu 3423
B-1049 Bruxelles, bâtiment Berlaymont, rue de la Loi 200 (bureau de liaison) — Tél. 2351111
Note
For any information on the statistics in this bulletin contact Luxembourg:
tel.: 4301-2022 D. Glatzel 4301-3519 T. Papaspyrou 4301-3288 G. Thouvenin 4301-3417 S. Ansion
© ECSC-EEC-EAEC, Brussels - Luxembourg, 1988
Reproduction is authorized, except for commercial purposes, provided the source is acknowledged.
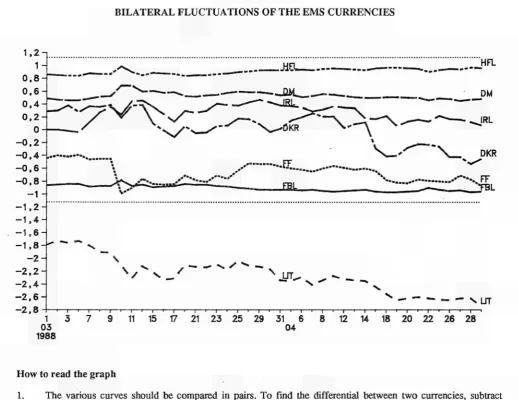
TABLE I
BILATERAL FLUCTUATIONS OF THE EMS CURRENCIES
HFL
τ—■—r
20 22
-ι—ι—ι—■
26 28
How to read the graph
1.
The various curves should be compared in pairs. To find the differential between two currencies, subtract
the (positive or negative) values along the y-axis corresponding to each currency.
2.
The graph is drawn with the curve of the strongest currency above that of the weakest It shows
therefore the relative position of each currency vis-à-vis the other currencies.
3.
When two curves intersect or merge over a period of time there is no differential between the two
currencies and their market exchange rate equals their bilateral central rate.
Construction of the graph
1.
The graph is drawn within a horizontal band corresponding to the maximum 2,25% margin of
fluctuation applying at any given moment to market exchange rates and the bilateral central rates of the
EMS currencies, with the exception of the LIT, which has a maximum authorized fluctuation of 6%.
This band is divided symmetrically by a horizontal axis along which the points would be plotted if all
currencies were at their bilateral central rate and there were therefore no fluctuations.
2.
The daily market exchange rates of all currencies are compared with the relevant bilateral central rates
and the differentials between the two calculated.
3.
The maximum fluctuation between two currencies (with the exception of the LIT) is shown within the
band, symmetrical with the horizontal axis. The fluctuations of the other currencies in relation to either
of the two currencies in question are shown within the maximum permissible fluctuation.
TABLE II
ECU BOND ISSUES (Mio ECU)
TOTAL European Community Non-European Community
Total Business Govern- Insti-sector ments tutions
Total Business Govern- Organi-sector ments zations
1982 1983 1984 1985 1986 1987 1987 April May June July August September October November December 1988 January February March April 1892 2515 4997 12295 8543 8186 1495 385 690 565 153 435 295 175 51Ü 350 325 425 650 1772 1980 3798 8134 5830 5453 1420 345 450 200 100 150 75 175 250 350 200 250 450 340 740 1223 3454 2362 2103 225 345 200 50 0 0 0 0 250 200 150 250 300 1230 690 1625 3540 2158 2000 1000 0 200 0 100 100 0 0 0 0 0 0 0 202 550 950 1140 1310 1345 195 0 50 150 0 50 75 175 0 150 50 0 150 120 535 1199 4161 2714 2733 125 40 240 365 53 285 220 0 260 0 125 175 200 65 300 784 3401 2304 1930 125 40 190 265 0 285 120 0 260 0 0 50 200 0 50 140 200 350 453 0 0 50 0 53 0 0 0 0 0 125 125 0 55 185 275 560 60 350 0 0 0 100 0 0 100 0 0 0 0 0 0 TABLEΙΠ
INTEREST RATES AND YIELDS OF ECU INVESTMENTS (%)
1983 1984 1985 1986 1987 1987 April May June July August September October November December 1988 January February March April month 9.14 9.25 9.13 8.04 7.00 6.86 6.63 6.58 6.53 6.86 7.08 6.85 7.06 6.95 6.05 6.03 6.20 6.08 Deposits 3 months 9.56 9.47 9.23 7.95 7.10 6.89 6.74 6.70 6.71 7.09 7.17 7.51 7.14 6.98 6.33 6.20 6.33 6.31
6 months
[image:4.595.97.500.106.782.2]T A B L E IV
L A S T M O N T H E C U B O N D S ISSUES
Issue Borrower Issued Issue Coupon Term Maturity Yields Lead Listing Notice Payment (country) (Mio ECU) Price (years) % Manager
Date
07/04/88 Credit Suisse 100 17/05/88 Finance
(SWITZERLAND)
100.500 71/4 5 08/07/93 6.89 Credit Suisse
LX
12/04/88 16/05/88
BEI 75 101.500 7 3/8 7 16/05/95 7.10
13/04/88 DANEMARK 100 25/05/88
100.375 7 1/4 5 25/05/95 6.82 Crédit Agricole
Crédit Lyonnais
LX PA
LX
18/04/88 ELFAquitaine 50 26/05/88 (FRANCE)
101.625 7 3/8 5 26/05/93 6.98 DeuscheBank LX
19/04/88 Compagnie du 330 13/05/88 Midi
(FRANCE)
108.000 21/2 10 13/05/98 1.67 Swiss Bank Corporation
LX Convertible
19/04/88 Banco di Roma 100 06/06/88 London
(ITALIA)
101.375 7 1/2 5 07/06/93 7.16 C.CF. LX
20/04/88 EUROFIMA 87.9 14/06/88
101.250 7 1/8 4 15/06/92 6.76 Paribas LX
[image:5.595.43.561.147.790.2]TABLE V
CONSUMER PRICE INDICES IN NATIONAL CURRENCY
1980=100 B DK D ELL E F IRL I L NL Ρ UK
EUR 12 EMS 1960 36.5 22.0 46.7 21.4 13.4 26.6 17.5 18.4 40.8 32.3 11.7 18.6 27.0 32.4 1970 49.1 39.2 61.0 26.3 24.1 39.9 27.8 27.1 52.6 48.9 18.2 27.7 39.0 44.7 1982 117.0 123.0 111.9 150.6 131.1 126.6 141.1 137.2 118.2 112.8 147.3 121.5 124.2 123.0 1983 126.0 131.5 115.6 181.1 147.0 138.6 155.8 157.3 128.4 115.9 184.3 127.1 134.8 133.3 1984 134.0 139.8 118.4 214.5 163.5 149.2 169.2 174.3 136.7 119.6 237.5 133.4 144.8 142.2 1985 140.5 146.4 121.0 255.9 178.0 157.9 178.4 190.3 142.3 122.3 284.1 141.5 153.7 149.9 1986 142.3 151.7 120.7 314.8 193.6 161.9 185.2 201.4 142.7 122.7 317.6 146.4 159.2 153.9 1987 144.5 157.8 121.0 366.3 203.8 167.2 191.0 211.0 142.6 122.5 347.2 152.4 164.3 158.0 09 145.3 159.3 120.9 371.9 206.1 168.1 191.8 212.9 142.6 123.0 350.2 153.2 165.1 158.8 10 145.1 160.0 121.1 383.5 207.3 168.5 191.8 214.7 142.6 123.6 354.3 153.9 165.8 159.5 1987 11 144.7 160.5 121.1 386.1 206.8 168.7 192.0 215.4 142.9 123.5 355.6 154.7 166.2 159.7 12 144.7 160.6 121.3 390.9 207.6 168.8 191.9 215.8 143.3 123.2 360.7 154.5 166.4 159.8 01 144.6 161.3 121.5 390.3 208.9 169.1 193.2 216.9 143.5 122.1 363.6 154.5 166.7 160.1 1988 02 145.0 162.6 121.8 388.5 209.5 169.4 193.2 217.5 143.6 122.3 368.7 155.1 167.2 160.5 03 145.1 163.2 121.9 400.3 211.0 169.9 193.3 218.4 143.9 122.7 371.2 155.7 166.7 161.0
Annual rate of increase (%)
Β DK D ELL E F IRL I L NL Ρ UK
EUR 12 EMS 61-70 3.0 6.0 2.7 2.1 6.1 4.1 4.8 4.0 2.6 4.2 4.5 4.1 3.7 3.3 71-80 7.4 9.8 5.1 14.5 15.4 9.7 13.7 14.1 6.7 7.4 18.7 13.8 9.9 8.4 1982 8.7 10.1 5.3 20.9 14.4 11.8 17.2 16.5 9.3 5.7 22.7 8.6 10.8 10.4 1983 7.7 6.9 3.3 20.5 12.1 9.6 10.4 14.7 8.6 2.7 25.1 4.6 8.5 8.4 1984 6.3 6.3 2.4 18.3 11.2 7.3 8.6 10.8 6.5 3.2 28.9 5.0 7.4 6.7 1985 4.9 4.7 2.2 19.4 8.9 5.9 5.4 9.2 4.1 2.3 19.6 6.1 6.1 5.4 1986 1.3 3.6 -0.2 23.1 8.8 2.7 3.8 5.8 0.3 0.3 11.8 3.4 3.6 2.7 1987 1.6 4.0 0.3 16.1 5.3 3.0 3.1 4.8 -0.1 -0.2 9.4 4.2 3.2 2.7 09 1.7 3.6 0.4 14.7 4.4 3.2 3.2 5.1 0.2 0.6 9.3 4.2 3.2 2.9 10 1.7 3.9 0.9 15.3 4.6 3.2 3.0 5.6 0.1 0.3 9.8 4.5 3.4 3.2 1987 11 1.5 4.0 1.0 15.3 4.7 3.2 3.1 5.5 0.3 0.2 9.3 4.1 3.4 3.1 12 1.4 4.1 1.0 15.7 4.6 3.1 3.1 5.2 0.7 0.2 8.9 3.7 3.3 3.0 01 0.9 4.3 0.7 14.3 4.5 2.4 1.9 5.1 0.6 0.7 8.5 3.3 3.0 2.7 1988 02 1.0 5.2 0.9 13.4 4.4 2.4 1.9 4.9 0.6 0.6 8.9 3.3 3.0 2.7 03 1.0 4.7 1.0 13.2 4.5 2.5 1.9 5.0 0.8 0.7 8.2 3.5 2.4 2.8
Average deviation around the mean
EUR 12 EMS 0.8 1.0 3.5 4.0 3.9 4.0 4.2 3.9 3.3 2.8 2.4 2.3 2.7 2.0 1.9 1.7 1.8 1.7 1.8 1.6 1.8 1.7 1.6 1.5 1.7 1.6 1.6 1.5 1.6 1.5
Average deviation vis-à-vis the minimum
TABLE VI
CONSUMER PRICE INDICES IN ECU
1980=100 Β DK D ELL E F IRL I L NL Ρ UK EUR 12 EMS ECU 1960 26.9 23.6 26.5 44.6 23.5 29.9 17.4 33.2 31.4 22.2 29.9 29.5 28.9 28.4 29.1 1970 39.2 40.0 41.1 50.9 33.7 41.0 27.5 50.4 41.8 36.5 43.0 38.9 41.5 42.5 42.1 1982 106.4 118.1 118.9 136.5 121.6 115.7 137.0 123.2 107.4 119.1 131.9 129.7 120.5 118.3 119.6 1983 112.6 126.7 128.5 137.4 115.0 120.2 146.2 138.6 114.8 126.1 130.2 129.7 126.8 127.1 126.9 1984 119.7 134.4 133.5 143.7 128.9 127.5 156.8 150.1 122.2 130.8 142.6 135.1 134.2 134.2 133.2 1985 127.0 142.9 137.2 144.6 137.5 136.4 168.0 156.4 128.6 134.5 151.8 143.9 141.0 140.4 139.4 1986 131.9 149.7 143.1 135.7 140.4 139.8 170.5 163.9 132.3 141.1 150.2 130.8 142.8 145.9 142.2 1987 136.4 156.8 147.5 138.9 142.9 141.7 166.1 167.9 134.5 144.8 148.5 129.5 145.4 149.4 145.2 09 136.9 156.0 147.1 139.0 147.9 142.4 167.1 168.8 134.5 145.4 148.9 131.7 146.4 149.8 145.8 10 136.4 157.1 147.3 142.2 151.2 142.6 167.4 170.2 134.2 146.1 149.8 132.8 147.2 150.2 146.2 1987 11 136.1 157.9 148.2 140.9 148.5 141.3 167.2 168.5 134.6 146.9 148.1 133.9 147.0 149.9 146.4 12 136.1 158.0 148.4 141.6 148.0 141.6 167.1 168.8 134.8 146.5 148.8 133.8 147.1 150.1 146.5 01 136.0 159.2 148.5 140.5 148.5 142.4 167.3 169.8 134.9 145.2 149.7 133.3 147.3 150.5 146.5 1988 02 136.3 161.2 148.8 139.5 149.9 142.5 168.0 170.3 135.0 145.6 151.8 134.0 147.8 150.8 146.9 03 136.0 161.1 148.6 143.0 151.5 141.9 168.3 169.8 134.9 145.8 152.2 138.2 148.5 150.5 147.3
Annual rate of increase(%)
TABLE VD
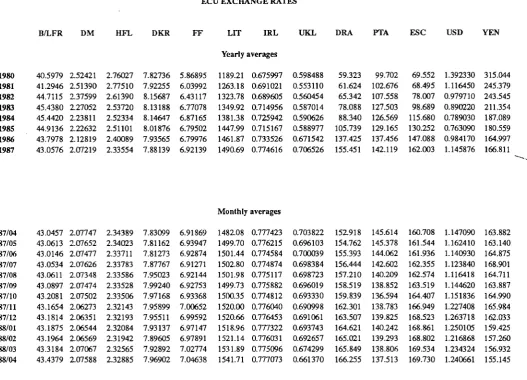
ECU EXCHANGE RATES
B/LFR DM HFL DKR FF
Lrr
IRL UKL DRA PTA ESC USD YEN1980 1981 1982 1983 1984 1985 1986 1987 40.5979 41.2946 44.7115 45.4380 45.4420 44.9136 43.7978 43.0576 2.52421 2.51390 2.37599 2.27052 2.23811 2.22632 2.12819 2.07219
2.76027 7.82736 5.86895 2.77510 7.92255 6.03992 2.61390 8.15687 6.43117 2.53720 8.13188 6.77078 2.52334 8.14647 6.87165 2.51101 8.01876 6.79502 2.40089 7.93565 6.79976 2.33554 7.88139 6.92139
Yearly : 1189.21 1263.18 1323.78 1349.92 1381.38 1447.99 1461.87 1490.69 averages 0.675997 0.691021 0.689605 0.714956 0.725942 0.715167 0.733526 0.774616 0.598488 0.553110 0.560454 0.587014 0.590626 0.588977 0.671542 0.706526 59.323 61.624 65.342 78.088 88.340 105.739 137.425 155.451 99.702 102.676 107.558 127.503 126.569 129.165 137.456 142.119 69.552 68.495 78.007 98.689 115.680 130.252 147.088 162.003 1.392330 1.116450 0.979710 0.890220 0.789030 0.763090 0.984170 1.145876 315.044 245.379 243.545 211.354 187.089 180.559 164.997 166.811 Monthly averages 87/04 87/05 87/06 87/07 87/08 87/09 87/10 87/11 87/12 88/01 88/02 88/03 88/04 43.0457 43.0613 43.0146 43.0534 43.0611 43.0897 43.2081 43.1654 43.1814 43.1875 43.1964 43.3184 43.4379 2.07747 2.07652 2.07477 2.07626 2.07348 2.07474 2.07502 2.06273 2.06351 2.06544 2.06569 2.07067 2.07588 2.34389 2.34023 2.33711 2.33783 2.33586 2.33528 2.33506 2.32143 2.32193 2.32084 2.31942 2.32565 2.32885 7.83099 7.81162 7.81273 7.87767 7.95023 7.99240 7.97168 7.95899 7.95511 7.93137 7.89605 7.92892 7.96902 6.91869 6.93947 6.92874 6.91271 6.92144 6.92753 6.93368 7.00652 6.99592 6.97147 6.97891 7.02774 7.04638 1482.08 1499.70 1501.44 1502.80 1501.98 1499.73 1500.35 1520.00 1520.66 1518.96 1521.14 1531.89 1541.71 0.777423 0.776215 0.774584 0.774874 0.775117 0.775882 0.774812 0.776040 0.776453 0.777322 0.776031 0.775096 0.777073 0.703822 0.696103 0.700039 0.698384 0.698723 0.696019 0.693330 0.690998 0.691061 0.693743 0.692657 0.674299 0.661370 152.918 154.762 155.393 156.444 157.210 158.519 159.839 162.301 163.507 164.621 165.021 165.849 166.255 145.614 145.378 144.062 142.602 140.209 138.852 136.594 138.783 139.825 140.242 139.293 138.806 137.513 160.708 161.544 161.936 162.355 162.574 163.519 164.407 166.949 168.523 168.861 168.802 169.534 169.730 1.147090 1.162410 1.140930 1.123840 1.116418 1.144620 1.151836 1.227408 1.263718 1.250105 1.216868 1.234324 1.240661 163.882 163.140 164.875 168.901 164.711 163.887 164.990 165.984 162.033 159.425 157.260 156.932 155.145 04/05 04/06 04/07 04/08 04/11 04/12 04/13 04/14 04/15 04/18 04/19 04/20 04/21 04/22 04/25 04/26 04/27 04/28 04/29 43.4542 43.4553 43.4447 43.4607 43.4542 43.4340 43.4221 43.4074 43.4412 43.4543 43.4422 43.4425 43.4630 43.4309 43.4320 43.4223 43.4170 43.4197 43.4218 2.07590 2.07676 2.07603 2.07587 2.07551 2.07510 2.07501 2.07492 2.07584 2.07610 2.07559 2.07604 2.07707 2.07725 2.07620 2.07565 2.07620 2.07530 2.07545 2.33028 2.33017 2.33002 2.32989 2.32926 2.32859 2.32811 2.32790 2.32836 2.32861 2.32823 2.32864 2.32995 2.33040 2.32919 2.32798 2.32818 2.32689 2.32751 7.95038 7.94598 7.94030 7.94522 7.94353 7.95516 7.94829 7.94412 7.98015 7.99174 7.98879 7.97983 7.97933 7.97781 7.97891 7.98843 7.98853 7.99474 7.99018 7.04212 7.04369 7.04466 7.04210 7.03800 7.03751 7.03795 7.03500 7.04102 7.05249 7.05385 7.05492 7.05470 7.05445 7.05317 7.05088 7.04390 7.04662 7.05425
Daily rates: April
EXPLANATORY NOTES
ECU exchange rates.
The exchange rates for the ECU against the national currencies of the Member States of the Community, the
United States (USD) and Japan (YEN) are shown as monthly averages and daily rates for the latest available
month.
The ECU basket, dating from 17 September 1984, is currently made up as follows:
DM FF HFL BFR LFR LIT DKR TRL UKL* DRA* 1ECU= 0,719+ 1,31+ 0,256+ 3,71+ 0,14+ 140+ 0,219+ 0,00871+ 0,0878+ 1,15
ECU central rates since 12 January 1987
DM FF HFL B/LFR LIT DKR IRL UKL* DRA* 2,05853 6,90403 2,31943 42,4582 1483,58 7,85212 0,768411 0,739615 150,792
Weights of currencies in the ECU basket (based on new central rates from 12 January 1987), in %.
DM FF HFL B/LFR LIT DKR IRL UKL* DRA* 100= 34,93 18,97 11,04 9,07 9,44 2,79 1,13 11,87 0,76 * = Does not participate in the exchange rate mechanism
Consumer price indices in national currency
The consumer price indices in the national currency of each country measure changes in the purchasing power of
one unit of national currency spent in the country concerned.
Two composite indices are calculated, covering all the Member States of the Community (EUR 12) and the
eight Member States with currencies participating in the European Monetary System exchange rate mechanism
(EMS).
These indices are calculated as weighted arithmetic means (chain indices) of the national indices, the weighting
for each Member State being its relative share in the final consumption of households of the group of
countries in question (EUR 12, EMS), expressed in purchasing power standards, at current prices and
purchasing power parities.
At the foot of the table, the average weighted fluctuations around the mean and the minimum are given for
the same groups of countries, with the same weightings. (These are calculated as weighted averages of the
absolute fluctuations in relation to the mean and the minimum respectively). They show the degree to which
price movements in the Member States in the Community converge.
Consumer price indices in ECU
For each country the index of consumer prices in ECU is calculated by dividing the national consumer price
index by the average movement of the national currency in relation to the ECU during the month. It measures
the change in the purchasing power of one ECU in the country concerned.
Three composite indices are calculated, covering all the Member States of the Community (EUR 12), the eight
Member States participating in the European Monetary System exchange rate mechanism (EMS) and the ten
Member States whose currencies go to make up the ECU (ECU). These indices are calculated as weighted
arithmetic means (chain indices) of the consumer price indices expressed in ECU as mentioned above.
The weightings are defined as follows:
- for the EUR 12 and EMS indices, the relative share of each Member State in the final consumption of
households for the group of countries in question (EUR 12 or EMS), expressed in ECU at current prices
and exchange rates (annual weighting).
ECU
bond
issues
All ECU-denominated bond issues, both national and international, are covered, together with ECU issues
offering the option of conversion into other currencies. Main source: International Financing Review
Table Π shows, under the headings:
- Business sector and Governments: national issuers, both private and public.
- Institutions: the European Investment Bank and the Commission of the European Communities (EEC,
ECSC, Euratom).
- Organizations: the speciahst institutions of the United Nations, the World Bank, the Council of
Europe, etc..
The issues are recorded as at the payment date.
Interest rates and yields on ECU investments
The interest rates for 1, 3 and 6 month and 1 year deposits are calculated on the basis of the Friday London
market rates (source: Financial Times).
The bonds are classified according to three types of terms: under 5 years, from 5 to 7 years and more than
7 years. The redemption yields of ECU bonds are calculated each Wednesday from a sample of fixed interest
bonds, denominated in ECU and listed on the Luxemburg Stock Exchange. These yields are weighted by
amounts in circulation, (source: Luxemburg Stock Exchange).
The monthly and yearly averages are the arithmetic means of these weekly interest rates and bond yields.
Venta y suscripciones · Salg og abonnement · Verkauf und Abonnement · Πωλήσεις και συνδρομές
Saies and subscriptions · Vente et abonnements · Vendita e abbonamenti
Verkoop en abonnementen · Venda e assinaturas
BELGIQUE / BELGIË IRELAND PORTUGAL
M o n i t e u r belge / Belgisch Staatsblad
Rue de Louván 4 0 4 2 / Leuvensestraat 4 0 4 2 1 0 0 0 Bruxelles / 1000 Brussel
Tel 5 1 2 0 0 2 6
CCP / Postrekening 0 0 0 - 2 0 0 5 5 0 2 - 2 7 Sous-dépôts / Agentschappen:
Librairie e u r o p é e n n e / Europese Boekhandel
Rue de la Loi 2 4 4 / Wetstraat 244 1 0 4 0 Bruxelles / 1040 Brussel
C R E D O C
Rue de la M o n t a g n e 34 / Bergstraat 34 Bte 11 / Bus 11
1 0 0 0 Bruxelles / 1000 Brussel D A N M A R K
Schultz EF-publikationer
M o n t e r g a d e 19 1116 Kobenhavn K Tlf: (01) 14 11 95 Telecopier: (01) 32 75 11 BR DEUTSCHLAND
Bundesanzeiger Verlag
Breite Straße Postfach 10 8 0 0 6 5 0 0 0 Köln 1 Tel (02 21) 2 0 29-0
Fernschreiber: ANZEIGER BONN 8 882 595 Télécopierez 2 0 2 9 2 7 8
GREECE
G.C. Eleftheroudakis SA
International Bookstore 4 Nikis Street
105 6 3 Athens Tel 3 2 2 22 55 Telex 2 1 9 4 1 0 ELEF
Sub-agent for Northern Greece:
M o l h o ' s Bookstore
The Business Bookshop 10 Tsimiski Street Thessaloniki Tel. 2 7 5 271 Telex 4 1 2 8 8 5 LIMO ESPAÑA
Boletín Oficial del Estado
Trafalgar 27 2 8 0 1 0 M a d r i d Tel. (91) 4 4 6 6 0 0 0
M u n d i - P r e n s a Libros, S.A.
Castello 37 2 8 0 0 1 M a d r i d
Tel. (91) 4 3 1 33 99 (Libros) 4 3 1 32 22 (Suscripciones) 435 36 37 (Dirección) Télex 49370-MPLI-E
FRANCE
J o u r n a l officiel
S e r v i c e des publications d e s C o m m u n a u t é s européennes
2 6 . rue Desaix 7 5 7 2 7 Paris Cedex 15
Tél. (1) 4 5 78 6 1 39
Government Publications Sales Office
Sun Alliance House M o l e s w o r t h Street Dublin 2
Tel. 71 0 3 0 9 or by post
Government Stationery Office EEC Section
6th floor Bishop Street Dublin 8 Tel. 78 16 66
ITALIA
Licosa Spa Via Lamarmora, 45 Casella postale 552 50 121 Firenze Tel. 57 97 51
Telex 5 7 0 4 6 6 LICOSA I CCP 343 509
Subagenti:
Libreria scientifica Lucio de Biasio -AJEIOU
Via Meravigli. 16 20 123 Milano Tel. 8 0 76 79
Herder Editrice e Libreria
Piazza Montecitorio. 117-120 0 0 186 Roma
Tel. 67 94 628/67 95 304
L i b r e r i a g i u r i d i c a Via 12 Ottobre. 172/R
16 121 Genova Tel 59 56 93
GRAND-DUCHE DE LUXEMBOURG et autres pays / and other countries
Office des publications officielles des C o m m u n a u t é s européennes
2, rue Mercier L-2985 Luxembourg Tel 49 92 81
Télex PUBOF LU 1324 b CCP 19190-81
CC bancaire BIL 8 - 1 0 9 / 6 0 0 3 / 2 0 0 Sogenal 61-490226-96-26 Abonnements / Subscriptions
Messageries Paul Kraus
11. rue Christophe Plantin L-2339 Luxembourg Tél. 49 98 881 Télex 2515 CCP 49242-63
NEDERLAND
Staatsdrukkerij- en uitgeversbedrijf
Christoffel Plantijnstraat Postbus 2 0 0 1 4 2 5 0 0 EA 's-Gravenhage
Tel. (070) 78 98 8 0 (bestellingen)
Imprensa Nacional Casa da M o e d a , E. P.
Rua D Francisco Manuel de M e l o , 5 1092 Lisboa Codex
Tel. 69 34 '14 Telex 15328 INCM
Distribuidora Livros Bertrand Lda. Grupo Bertrand, SARL
Rua das Terras dos Vales, 4-A Apart. 37
2 7 0 0 Amadora CODEX Tel 4 9 3 90 50 - 4 9 4 87 88 Telex 15798 BERDIS
UNITED KINGDOM
H M S O Books (PC 16)
HMSO Publications Centre 51'Nine Elms Lane London S W 8 5DR Tel. (01) 211 77 02 Sub-agent:
Alan A r m s t r o n g & Associates Ltd
A r k w n g h t Road
Reading. Berks RG2 OSO Tel. (0734) 75 17 69 Telex 849937 AAALTD G
TURKIYE
Dünya super veb ofset A.C. Narlibahçe Sokak No. 15 Cagaloglu
Istanbul Tel: 512 0 1 90 Telex 23822 dsvo-tr.
UNITED STATES OF AMERICA
European Community Information Service
2 1 0 0 M Street. N W Suite 707
Washington. DC 20037 Tel (202) 862 9 5 0 0
CANADA
Renouf Publishing Co., Ltd
61 Sparks Street Ottawa
Ontario K IP 5R 1
Tel. Toll Free 1 (800) 267 4 1 6 4 Ottawa Region (613) 238 8985-6 Telex 0 5 3 - 4 9 3 6
J A P A N
Kinokuniya C o m p a n y Ltd
17-7 Shinjuku 3-Chome Shiniuku-ku
Tokyo 160-91 Tel (03) 354 0 1 3 1
Journal D e p a r t m e n t
PO Box 55 Chitóse Tokyo 156 Tel. ( 0 3 ) 4 3 9 0 1 2 4
Price (excluding VAT) in Luxembourg
ECU BFR IRL UKL USD
Single copy
Subscription
4
35
175
1
500
3,10
27
2.80
24.70
4.80
41.50
Of)
OFICINA DE PUBLICACIONES OFICIALES DE LAS COMUNIDADES EUROPEAS KONTORET FOR DE EUROPÆISKE FÆLLESSKABERS OFFICIELLE PUBLIKATIONER AMT FÜR AMTLICHE VERÖFFENTLICHUNGEN DER EUROPÄISCHEN GEMEINSCHAFTEN ΥΠΗΡΕΣΙΑ ΕΠΙΣΗΜΩΝ ΕΚΔΟΣΕΩΝ ΤΩΝ ΕΥΡΩΠΑΪΚΩΝ ΚΟΙΝΟΤΗΤΩΝ
OFFICE FOR OFFICIAL PUBLICATIONS OF THE EUROPEAN COMMUNITIES OFFICE DES PUBLICATIONS OFFICIELLES DES COMMUNAUTÉS EUROPÉENNES UFFICIO DELLE PUBBLICAZIONI UFFICIALI DELLE COMUNITÀ EUROPEE BUREAU VOOR OFFICIËLE PUBLIKATIES DER EUROPESE GEMEENSCHAPPEN SERVIÇO DAS PUBLICAÇÕES OFICIAIS DAS COMUNIDADES EUROPEIAS
ISSN 1011-0844