Nucleotide Polymorphisms Identified in Clinical Samples Can Affect
MicroRNA Processing, Level of Expression, and Silencing Activity
Soo-Jin Han,aVickie Marshall,bEugene Barsov,bOctavio Quiñones,cAlex Ray,bNazzarena Labo,bMatthew Trivett,bDavid Ott,b Rolf Renne,aDenise Whitbyb
Department of Molecular Genetics and Microbiology, University of Florida, Gainesville, Florida, USAa; AIDS and Cancer Virus Program, SAIC—Frederick, Frederick National
Laboratory for Cancer Research, Frederick, Maryland, USAb; Computer and Statistical Services, Frederick National Laboratory for Cancer Research, Frederick, Maryland,
USAc
Kaposi’s sarcoma-associated herpesvirus (KSHV) encodes 12 pre-microRNAs that can produce 25 KSHV mature microRNAs. We previously reported single-nucleotide polymorphisms (SNPs) in KSHV-encoded pre-microRNA and mature microRNA se-quences from clinical samples (V. Marshall et al., J. Infect. Dis., 195:645– 659, 2007). To determine whether microRNA SNPs af-fect pre-microRNA processing and, ultimately, mature microRNA expression levels, we performed a detailed comparative
analy-sis of (i) mature microRNA expression levels, (ii)in vitroDrosha/Dicer processing, and (iii) RNA-induced silencing
complex-dependent targeting of wild-type (wt) and variant microRNA genes. Expression of pairs of wt and variant pre-microRNAs from retroviral vectors and measurement of KSHV mature microRNA expression by real-time reverse transcription-PCR (RT-PCR) revealed differential expression levels that correlated with the presence of specific sequence polymorphisms. Measurement of KSHV mature microRNA expression in a panel of primary effusion lymphoma cell lines by real-time RT-PCR recapitulated some observed expression differences but suggested a more complex relationship between sequence differences and expression of
ma-ture microRNA. Furthermore,in vitromaturation assays demonstrated significant SNP-associated changes in Drosha/DGCR8
and/or Dicer processing. These data demonstrate that SNPs within KSHV-encoded pre-microRNAs are associated with differen-tial microRNA expression levels. Given the multiple reports on the involvement of microRNAs in cancer, the biological signifi-cance of these phenotypic and genotypic variants merits further studies in patients with KSHV-associated malignancies.
K
aposi’s sarcoma (KS)-associated herpesvirus (KSHV)causes KS (1) and primary effusion lymphoma (PEL) (2) and is associated with a subset of multicentric Castleman’s dis-ease (MCD) (3).
MicroRNAs are small single-stranded RNAs averaging 22 nucleotides (nt) in length which posttranscriptionally regulate gene expression primarily by targeting 3=untranslated regions of mRNAs. MicroRNA targeting of mRNAs inhibits translation, subsequently leading to mRNA decay. MicroRNAs are processed from precursor polymerase II (Pol II) transcripts by two types of RNA III endonucleases. In the nucleus, precursors of mature mi-croRNAs before Drosha cleavage (pri-mimi-croRNAs) form a hair-pin, which is cleaved at the base by Drosha/DGCR8. The resulting pre-microRNA (after Drosha cleavage) is efficiently exported into the cytoplasm, where it is recognized by Dicer, which cleaves the hairpin bulge to generate a double-stranded RNA molecule. Usu-ally, one strand, the mature microRNA, is then incorporated into the RNA-induced silencing complex (RISC). For some human and many viral microRNAs, both strands can be incorporated into RISC with various efficiencies (for a review, see references4and
5).
Virally encoded microRNAs were first discovered in Epstein-Barr virus (EBV)-infected Burkitt’s lymphoma cells (6) and have subse-quently been identified in many alpha-, beta-, and gammaherpesvi-ruses (reviewed in reference7). KSHV encodes 12 pre-microRNAs that give rise to 25 mature microRNAs (6,8–12). KSHV-encoded microRNAs are located within the latency-associated region and are expressed at different levels in all KSHV-associated malignan-cies (13,14). Ten microRNAs are expressed as a cluster and
lo-cated between the viral FLIP and kaposin genes, while the remain-ing two are embedded within the K12 open readremain-ing frame.
We recently investigated the sequence conservation of the KSHV-encoded microRNA region in KSHV-infected PEL cell lines and clinical samples from patients with KS and MCD. We observed that while the region was generally highly conserved, a distinct cluster of sequences showed substantial divergence (15). We also observed single-nucleotide polymorphisms (SNPs) or multiple-nucleotide polymorphisms in pre-microRNA sequences of K12-2, -4, -5, -6, -7, -9, and -10. In subsequent studies, detailed analysis of SNPs in the KSHV microRNA-coding region suggested an association with a risk of AIDS-associated KS (16), MCD, and KSHV-associated inflammatory cytokine syndrome (KICS) (17), a more recently described condition associated with an extremely high viral load (18). An earlier study, usingin vitromaturation assays, reported that an SNP observed in the precursor stem-loop of K12 microRNA 5 (miR-K12-5) affects Drosha processing and subsequent mature microRNA expression in PEL cell lines (19).
In the current study, we systematically analyzed the effect of SNPs in multiple KSHV pre-microRNAs on microRNA
process-Received2 May 2013Accepted29 August 2013
Published ahead of print4 September 2013
Address correspondence to Denise Whitby, [email protected]. S.-J.H. and V.M. contributed equally to this article.
Copyright © 2013, American Society for Microbiology. All Rights Reserved.
doi:10.1128/JVI.01202-13
on November 7, 2019 by guest
http://jvi.asm.org/
ing, expression, and targeting using complementary molecular approaches. First, HEK293T cells were transduced with retroviral vectors expressing either KSHV wild type (wt) or variant (v) pre-microRNAs derived from sequences observed in clinical sam-ples and mature microRNA expression was determined using re-verse transcription (RT)-quantitative PCR (qPCR) with an ABI system. Second, we characterized the expression of variant mi-croRNAs present in PEL cell lines using RT-qPCR with an ABI system. Third,in vitromaturation assays were performed to assess SNP-dependent differences in Drosha/DGCR8 and Dicer pro-cessing. Lastly, we performed reporter assays using microRNA sensor vectors, which demonstrated that SNP-dependent expres-sion/maturation differences indeed translate into variable silenc-ing efficiency. Together, these data indicate that the KSHV-en-coded SNPs observed in pre-microRNAs may have phenotypic consequences for viral biology and pathogenesis.
MATERIALS AND METHODS
Cell lines.HEK293T human embryonic kidney cells were obtained from the American Type Culture Collection and maintained in Dulbecco’s modified Eagle’s medium (DMEM; Mediatech) supplemented with 10% fetal bovine serum (FBS; Mediatech), 2 mML-glutamine, and
penicillin-streptomycin (5 U/ml and 5g/ml, respectively; Mediatech). Cells of a panel of KSHV-positive primary effusion lymphoma cell lines (BCBL-1, JSC-1, BCP-1, VG-1, BC-1, BC-2, BC-3) were grown in RPMI 1640 (Life Technologies) containing 10% FBS (Atlantic Biologicals) and 1% penicil-lin-streptomycin-glutamine (Life Technologies).
KSHV copy number quantification by real-time PCR.KSHV copy numbers in PEL cell lines were determined using approximately 250 ng total DNA per reaction mixture in triplicate, as previously reported (20). Cell quantification was determined using a quantitative real-time PCR assay for human endogenous retrovirus 3 (ERV-3) (21) to allow the num-ber of KSHV copies per cell to be calculated.
PEL cell line sequencing and analysis.The sequence of the KSHV-encoding microRNA region as well as a fragment of K12 containing the sequences for miR-K12-10 and -12 were previously reported for the PEL cell lines BC-1, BC-2, BCBL-1, BCP-1, and JSC-1 (15). The same regions were amplified and sequenced from two additional cell lines, BC-3 and VG-1, as previously described (15).
Retroviral vectors expressing KSHV wt and variant microRNAs.
BCBL-1 was designated the wild type because it is commonly used as a model for KSHV research and it has a KSHV microRNA sequence that was found to cluster in the conserved arm of the phylogenetic tree in our previous study (15). KSHV wt and variant pre-microRNA sequences were amplified from previously characterized clinical samples usingPfuDNA polymerase (Stratagene), with the exception of wt pre-microRNA K12-6, which was synthesized (Operon) (16). The pre-microRNAs included in this study are listed inTable 1. The pre-microRNA sequences were am-plified using primers with adapters that introduced 5=BamHI and 3= EcoRI restriction sites for directional cloning into the RNA interference-ready pSIREN-retroQ-DsRed-Express vector (Clontech). All constructs were verified by sequencing. The primers used for amplification of pre-microRNA sequences are listed inTable 2, and the forward primer se-quences used for custom small RNA real-time PCR assays are given in Table 3. The vector construct, including the amplified and cloned wt and V pre-microRNA sequences, is shown inFig. 1.
The retroviral vector stocks were made using GP2-293 packaging cells (Clontech) cotransfected with the pSIREN-KSHV plasmid DNA and a vesicular stomatitis virus envelope G glycoprotein (VSV-G)-expressing construct plasmid using the Transit-293 transfection reagent, as recom-mended by the manufacturer (Mirus Bio). Supernatants were harvested at 48 h posttransfection, and retroviral particles were concentrated by cen-trifugation, as previously described (22). Transduced HEK293T cells were
expanded for 2 weeks in selection medium, after which the cells were sorted for DsRed expression.
To measure the transduction efficiency in HEK293T cells, quanti-tative RT-PCR for the DsRed gene was performed. Primers and probes were designed using Primer Express (version 3.0) software (Applied Biosystems) according to recommended guidelines and are as follows: primer DsRedqPCR-F, 5=-GCAGGACGGCTCCTTCATC-3=; primer DsRedqPCR-R, 5=-CAGCCCATAGTCTTCTTCTGCAT-3=; and DsRedqPCR-probe, 5=-FAM-AGGTGAAGTTCATCGGC-TAMRA-3=, where FAM is 6-carboyfluorescein and TAMRA is 6-carboxytetramethylrhodamine.
For quantification, a standard curve was generated using serially di-luted circularized pSIREN vector DNA. All assays were performed using an ABI Prism 7900HT sequence detection system. RNA from transduced 293T cells was reverse transcribed to cDNA using a high-capacity cDNA reverse transcription kit (Applied Biosystems) and a DsRed-specific RT primer, DsRedCP-R (5=-TTCAGCTTCAGGGCCTTGTG-3=). The re-sulting cDNA was then screened using the aforementioned DsRed qPCR assay. Replicates of each HEK293T-KSHV microRNA transduction were tested in triplicate, and the threshold cycle (CT) values of the independent replicates were averaged.
RNA extraction from cell lines latently infected with KSHV and HEK293T transductions.The isolation of RNA from HEK293T trans-ductions and PEL cells was performed using the TRIzol reagent (Invitro-gen) per the manufacturer’s instructions, and the RNA was quantified using a Nanodrop 1000 spectrophotometer (Thermo Scientific).
Analysis of KSHV microRNA expression in PEL and retrovirus-transduced HEK293T cells.Mature KSHV microRNA expression was determined using TaqMan small RNA assays (Applied Biosystems). The sequence of the mature microRNA was used to design each custom assay, which included a specific stem-looped RT primer, and TaqMan qPCR assay. A total of 21 custom assays were designed on the basis of the wt and variant microRNA sequences (Table 2). Human small nuclear RNAs RNU6B and RNU48 were used as endogenous controls to normalize for RNA input. All samples were tested multiple times in triplicate reactions, and theCTvalues of the replicates were averaged. For experiments with HEK293T cells, untransduced HEK293T cells were used as a negative control in quantitative RT-PCR assays and consistently gaveCTvalues of 40. All qPCRs were performed using an ABI Prism 7900HT sequence detector system.
Statistical analyses.Statistical analyses for the gene expression data obtained from real-time qPCR analysis were performed using Spotfire S⫹, version 8.0, software (TIBCO Spotfire, Somerville, MA). The target genes (microRNAs) were first normalized to the host microRNA, RNU6B, and then the fold changes were computed via the 2⫺⌬⌬CTmethod (23). For PEL cell lines BCP-1, VG-1, JSC-1, BC-1, BC-2, and BC-3, changes relative to the value for the wild-type BCBL-1 cell line were computed. Box-and-whisker plots depict raw CT gene expression values for HEK293T cells for each microRNA variant and the wt and indicate evi-dence of either differences between the microRNA variants and the wt or a lack thereof. Nonparametric/distribution-free Wilcoxon rank-sum tests were performed to confirm possible differences between SNP and wt microRNAs, as observed inFig. 1.Pvalues of less than 0.01 were consid-ered significant (Fig. 1).
In vitromicroRNA maturation assay.MicroRNAin vitromaturation assays were performed as described by Lee and Kim (24). All wt and variant pre-microRNAs tested were transcribed from T7 promoter-con-taining pcDNA3.1/V5/HisA vectors, as previously described (25). For microRNA maturation assays, plasmids were linearized prior toin vitro
transcription using T7 polymerase in the presence of [␣-32P]UTP.
Radio-labeled transcripts were separated on a 6% urea-polyacrylamide gel and extracted from the gel in elution buffer (0.3 M sodium acetate [pH 5.5], 2% SDS) at 42°C overnight. Recovered size-selected RNA was precipitated and resuspended in RNase-free TE (Tris-EDTA) buffer. Recombinant plasmids expressing pCK-Drosha (Flag) and pCK-DGCR8 (Flag) were kind gifts from Narry Kim, Seoul National University, Seoul, Republic of
on November 7, 2019 by guest
http://jvi.asm.org/
TABLE 1wt and variant microRNAs previously observed in clinical samples from patients with KSHV-associated cancers and present in PEL cell lines included in this study
KSHV miRNA Location of SNP Pre-microRNA M-fold diagrama KSHV cell line(s) latently infected with microRNA
miR-K12-5vb Pre-microRNA BC-1, VG-1
miR-K12-5wt BCBL-1, BC-2, BC-3, BCP-1, JSC-1
miR-K12-9svc Pre-microRNA VG-1
miR-K12-4vc Terminal loop VG-1
miR-K12-4wt BCBL-1, BC-1, BC-2, BC-3, BCP-1, JSC-1
miR-K12-7vc Terminal loop VG-1
miR-K12-7wt BCBL-1, BC-1, BC-2, BC-3, BCP-1, JSC-1
miR-K12-10vc Terminal loop BC-1
miR-K12-10wt BCBL-1, BC-2, BC-3, BCP-1, JSC-1, VG-1
miR-K12-2vd Mature microRNA
miR-K12-2wt BCBL-1, BC-1, BC-2, BC-3, BCP-1, JSC-1
miR-K12-6vc Mature microRNA
(Continued on following page)
on November 7, 2019 by guest
http://jvi.asm.org/
Korea. Plasmids encoding the Drosha/DGCR8 expression plasmids were cotransfected into HEK293T cells at a ratio of 9:1. Cells were harvested at 48 h posttransfection and lysed in lysis buffer (20 mM Tris-HCl [pH 7.4], 150 mM NaCl, 1 mM EDTA, 0.4% NP-40, proteinase inhibitor cocktail [Sigma]). The Drosha-DGCR8 complex, which is called the microproces-sor, was enriched using M2 Flag-tagged agarose beads (Sigma). Radiola-beled wt (BCBL-1) and variant pri-microRNAs were incubated with freshly prepared microprocessor at 37°C for 2 h in reaction buffer (20 mM HEPES [pH 7.6], 10 mM KCl, 0.2 mM EDTA, 5% glycerol). RNA was extracted via phenol-chloroform and ethanol precipitation. After resus-pension in RNase-free TE buffer, 50% of the microprocessor-processed RNA was incubated with 1 unit of recombinant turbo Dicer (Genlantis) at 37°C for 2 h.
Products from each step were separated on 10 or 15% urea-polyacryl-amide gels and quantified by imaging. Maturation efficiency was deter-mined as a percentage of that for the wild type⫾standard deviation from three independent experiments.
Luciferase microRNA reporter assays in HEK293T cells.Luciferase activity was quantified using a dual-luciferase assay system (Promega) according to the manufacturer’s protocol. For plasmids expressing indi-vidual pri-microRNAs (wt or variants), a region of approximately 200 nt surrounding each pre-microRNA hairpin was amplified from the cluster-containing plasmid and inserted into pcDNA3.1/V5/HisA. Efficient wt microRNA expression from these constructs has previously been demon-strated (25). Individual KSHV microRNA sensor vectors containing two sites with 100% complementary binding to the wt microRNAs
down-TABLE 1(Continued)
KSHV miRNA Location of SNP Pre-microRNA M-fold diagrama KSHV cell line(s) latently infected with microRNA
miR-K12-6wt BCBL-1, BC-1, BC-2, BC-3, BCP-1, JSC-1, VG-1
miR-K12-9mvc Mature microRNA BCP-1, BC-3
miR-K12-9wt BCBL-1, BC-1, JSC-1
aM-Fold diagrams show predominantly expressed microRNAs.
b
The sequence was first reported by Gottwein et al. (19). cThe sequence was first reported by Marshall et al. (15).
d
[image:4.585.39.547.77.242.2]The sequence was first reported by Marshall et al. (16).
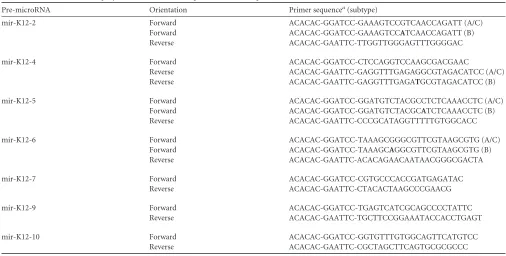
TABLE 2Primers used to amplify KSHV wt and variant pre-microRNA sequences
Pre-microRNA Orientation Primer sequencea(subtype)
mir-K12-2 Forward ACACAC-GGATCC-GAAAGTCCGTCAACCAGATT (A/C)
Forward ACACAC-GGATCC-GAAAGTCCATCAACCAGATT (B)
Reverse ACACAC-GAATTC-TTGGTTGGGAGTTTGGGGAC
mir-K12-4 Forward ACACAC-GGATCC-CTCCAGGTCCAAGCGACGAAC
Reverse ACACAC-GAATTC-GAGGTTTGAGAGGCGTAGACATCC (A/C)
Reverse ACACAC-GAATTC-GAGGTTTGAGATGCGTAGACATCC (B)
mir-K12-5 Forward ACACAC-GGATCC-GGATGTCTACGCCTCTCAAACCTC (A/C)
Forward ACACAC-GGATCC-GGATGTCTACGCATCTCAAACCTC (B)
Reverse ACACAC-GAATTC-CCCGCATAGGTTTTTGTGGCACC
mir-K12-6 Forward ACACAC-GGATCC-TAAAGCGGGCGTTCGTAAGCGTG (A/C)
Forward ACACAC-GGATCC-TAAAGCAGGCGTTCGTAAGCGTG (B)
Reverse ACACAC-GAATTC-ACACAGAACAATAACGGGCGACTA
mir-K12-7 Forward ACACAC-GGATCC-CGTGCCCACCGATGAGATAC
Reverse ACACAC-GAATTC-CTACACTAAGCCCGAACG
mir-K12-9 Forward ACACAC-GGATCC-TGAGTCATCGCAGCCCCTATTC
Reverse ACACAC-GAATTC-TGCTTCCGGAAATACCACCTGAGT
mir-K12-10 Forward ACACAC-GGATCC-GGTGTTTGTGGCAGTTCATGTCC
Reverse ACACAC-GAATTC-CGCTAGCTTCAGTGCGCGCCC
aBoldface nucleotides indicate SNPs.
on November 7, 2019 by guest
http://jvi.asm.org/
[image:4.585.39.545.461.717.2]stream of the luciferase reporter were previously described (11). Expres-sion and sensor vectors were cotransfected with aRenillaluciferase vector for normalization. Luciferase activity was analyzed at 72 h posttransfec-tion using a BMG Fluostar luminometer. Each variant microRNA was analyzed using BCBL-1 microRNA as the wt and empty vector as a nega-tive control. Reporter gene activity values represent the means of several independent transfections performed in triplicate, and error bars show the standard deviations from the means.
RESULTS
Comparative expression analysis of HEK 293 cells transduced
with retroviral vectors encoding wt or variant microRNAs.
Pre-viously, we observed single-nucleotide polymorphisms (SNPs) in pre-microRNA sequences of miR-K12-2, -4, -5, -6, -7, -9, and -10 in clinical samples and PEL cell lines (15,16). The SNPs evaluated here are summarized inTable 1, which also indicates which SNPs were observed in clinical samples and which were also present in sequences from PEL cell lines. SNPs were observed in various positions within the pre-microRNAs and can be divided into three classes. SNPs in miR-K12-5 and -9sv (where sv represents single variant) were located within the pre-microRNA stem adjacent to the putative Drosha processing site. In miR-K12-4, -7, and -10, SNPs were located within the bulge of the pre-microRNA, which is closer to the Dicer processing site. In miR-K12-2 and -6, the SNPs were located within the mature microRNA, as were some of the multiple SNPs in the highly variant miR-K12-9mv (where mv represents multiple variant), in which multiple SNPs were located throughout the pre-microRNA.
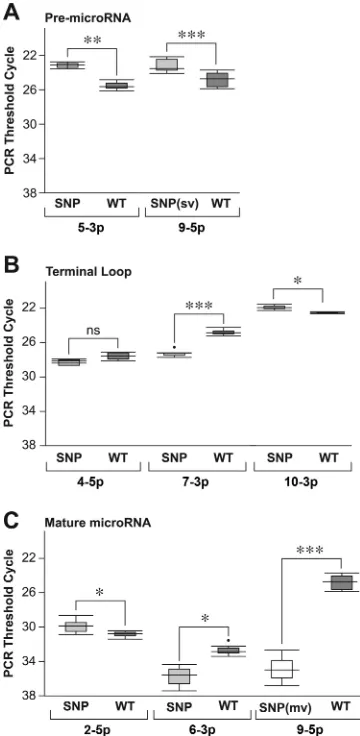
To evaluate the potential impact of these SNPs on processing and expression in a controlled cellular system, we transduced HEK293T cells with retroviral expression vectors encoding either wild-type or variant pre-microRNAs. Cell lines stably expressing these constructs were selected on the basis of DsRed expression. Mature microRNA expression levels were then determined using custom-designed ABI stem-loop real-time PCR assays (Fig. 2).
We showed that SNPs in the pre-microRNA region of miR-K12-5 and -9sv correlate with increased mature microRNA ex-pression (Fig. 2A). In our previous studies of KSHV microRNA-encoded sequences in clinical samples, most subjects were observed to have the miR-K12-5 SNP (15,16). In contrast, SNPs within the terminal loop region of miR-K12-4 and -7 showed reduced expression. However, not all SNPs in this region resulted in reduced expression, as miR-K12-10 levels were modestly in-creased (Fig. 2B). MiR-K12-2 had a single SNP in the mature
microRNA, and this correlated with increased expression (Fig. 2C). The SNP in miR-K12-6, however, resulted in reduced mature microRNA expression. The multiple SNPs in miR-K12-9mv, which spanned both arms and the mature microRNA region, re-sulted in the lowest level of expression of any of the constructs studied (Fig. 2C). Hence, these data demonstrate that SNPs ob-served within KSHV pre-microRNA genes can affect mature microRNA expression either positively or negatively. The magni-tude of these effects varied from very minor to highly significant.
MicroRNA expression analysis in cell lines latently infected
with KSHV. In addition to evaluating the effects of SNPs in
HEK293T cell lines transduced with individual pre-microRNAs, we also evaluated microRNA expression levels in PEL cells using custom-designed ABI stem-loop real-time PCR assays. In this case, the microRNAs were expressed in the context of the entire pri-microRNA cluster in KSHV-infected cells with all the addi-tional viral genes and viral host cell interaction mechanisms in-tact. The cell lines tested and the SNPs present are summarized in
Table 1.
The levels of expression of seven microRNAs in the different PEL cell lines compared to that in BCBL-1 cells analyzed by the 2⫺⌬⌬CTmethod (23) are shown inFig. 3. These results show that expression of mature miR-K12-5 is increased in BC-1 cells, as previously reported (19). In addition, increased expression of ma-ture miR-K12-5 was also seen in VG-1 cells, which have the same SNP as that observed in BC-1 cells. However, the increased expres-sion observed in BC-1 cells compared to that observed in BCBL-1 cells was rather modest, and all of the other cell lines, which lacked this SNP, also had increased expression. Similarly, the remaining KSHV pre-microRNAs containing single SNPs (miR-K12-2, -4, -6, -7, and -10) showed varied mature microRNA expression lev-els between the cell lines in a manner that could not be explained by the presence or absence of the pre-microRNA SNP alone.
In contrast, the multiple SNPs in miR-K12-9 in BC-2, BCP-1, and BC-3 cells spanning both arms of the pre-microRNA corre-lated with a drastic reduction in mature microRNA expression, which in BCP-1 and BC-3 cells was below the detection level of the assay. The lack of miR-K12-9 expression in BC-3 cells has also been observed by deep sequencing (26). BC-1 and JSC-1 cells both have the wild-type sequence for miR-K12-9. Expression of mature miR-K12-9 was reduced in BC-1 cells but increased in JSC-1 cells compared to the level of expression in BCBL-1 cells. The single SNP in premiR-K12-9-5p (where 5p is the 5=arm) encoded by VG-1 cells and observed in sequences from many clinical samples (15,16) also correlates with increased microRNA expression.
These data suggest that the levels of mature microRNA in PEL cells is determined by many factors, in addition to the SNP in the pre-microRNA. This may include differential transcriptional activity between different PEL cells as well as the position of pre-microRNAs within the cluster. Differences in the microRNA processing ma-chinery between HEK293T cells and PEL cells as well as differences between PEL cell lines may also affect processing of viral microR-NAs. Sequence analyses of the microRNA-encoding regions from PEL cell lines show many additional SNPs in the pri-microRNA sequence outside the pre-microRNAs, which likely also affect mi-croRNA processing and expression (16,17).
[image:5.585.41.286.86.204.2]We observed no correlation between microRNA expression levels and KSHV load. The highest microRNA expression levels were detected in BC-3 cells, which also had the highest viral copy number per cell. However, VG-1 cells also had high microRNA
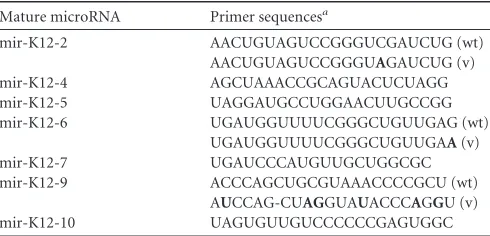
TABLE 3Forward primer sequences used for custom small RNA real-time PCR assays
Mature microRNA Primer sequencesa
mir-K12-2 AACUGUAGUCCGGGUCGAUCUG (wt)
AACUGUAGUCCGGGUAGAUCUG (v)
mir-K12-4 AGCUAAACCGCAGUACUCUAGG
mir-K12-5 UAGGAUGCCUGGAACUUGCCGG
mir-K12-6 UGAUGGUUUUCGGGCUGUUGAG (wt)
UGAUGGUUUUCGGGCUGUUGAA(v)
mir-K12-7 UGAUCCCAUGUUGCUGGCGC
mir-K12-9 ACCCAGCUGCGUAAACCCCGCU (wt)
AUCCAG-CUAGGUAUACCCAGGU (v)
mir-K12-10 UAGUGUUGUCCCCCCGAGUGGC
a
Boldface nucleotides indicate SNPs. Hyphen in sequence for mir-K12-9 represents a deletion.
on November 7, 2019 by guest
http://jvi.asm.org/
expression, despite having the lowest viral copy number per cell (Fig. 3;Table 4). SNPs in mir-K12-2 and -6, identified in viral sequences from clinical samples (15–17), were not encoded by any of the cell lines tested.
Analysis of Drosha and Dicer processing efficiency of
wild-type and variant microRNAs using stepwisein vitromaturation
assays.The retroviral expression results presented above suggest
that the location of an SNP in the pre-microRNA might alter
processing. To determine how SNPs affect microRNA processing, we performed stepwisein vitromaturation assays and compared the processing efficiency of wild-type and variant microRNAs by incubating wt and variant precursors with the immune-purified Drosha/DGCR8 microprocessor alone or in combination with re-combinant Dicer.
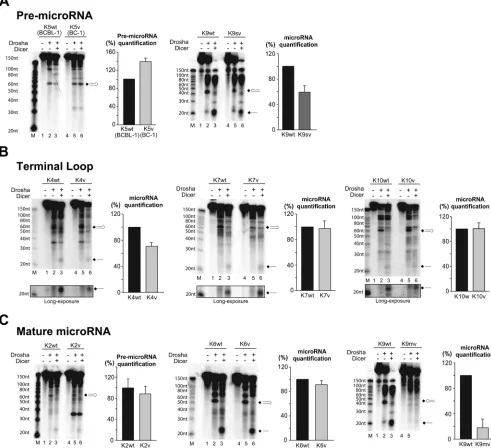
We first examined SNPs in the pre-microRNA region in miR-K12-5 and -9sv. It was previously reported that miR-miR-K12-5
FIG 1(Top) Diagram of SIREN-RetroQ-DsRed-Express retroviral vector. Large gray arrow, the U6 RNA polymerase III promoter immediately upstream of the cloned pre-microRNA; black arrow, CMV RNA polymerase II promoter expressing DsRed; LTRx, self-inactivating long terminal repeats. (Bottom) Cloned
sequences of each microRNA (MiRNA), with the mature microRNA being underlined and in bold.
on November 7, 2019 by guest
http://jvi.asm.org/
[image:6.585.103.484.80.576.2]showed an increased microRNA maturation efficiency in BC-1 cells than in BCBL-1 cells (19), consistent with the data presented above. The mature miR-K12-5 sequence observed in BCBL-1 cells creates a bulge in the pre-microRNA stem-loop which inhibits Drosha processing (19). We tested miR-K12-5wt (BCBL-1 cells) and miR-K12-5v (BC-1 cells) (Fig. 4A, left) and confirmed that Drosha processed them with different efficiencies. We could not detect either miR-K12-5wt or miR-K12-5v in mature miR-K12-5. However, we detected Drosha processing of miR-K12-5wt at low levels (Fig. 4A); miR-K12-5wt could not be detected in a previous study (19). mir-K12-9sv contains an A-to-C change 2 nt upstream of the putative Drosha cleavage site in the 5=arm of the pre-mi-croRNA precursor, which should not alter folding, as predicted by M-fold software. Drosha processing and microRNA maturation were reduced by 40% in K12-9sv compared to those in miR-K12-9wt (Fig. 4A). This is in contrast to the finding for HEK293T cells transduced with pre-microRNA mir-K12-9sv, in which
ex-pression of mature microRNA was increased compared to that in the wild type (Fig. 2A). The only PEL cell line that had the miR-K12-9sv sequence was VG-1, which showed a 14-fold increase in mature microRNA expression compared to that for BCBL-1 cells. Second, we examined SNPs in miRs-K12-4, -7, and -10 that were located in the terminal loop of the pre-microRNA. The ter-minal loop of pre-microRNA is a critical structural feature for microprocessor/Dicer processing (27–29). In addition, the termi-nal loop has been shown to function as a binding site for cellular proteins, such as KSRP and hnRNP A1, which in the case of the miRNA lin-28 control microprocessor/Dicer processing in the nucleus and cytoplasm (28, 30, 31). miR-K12-4v, which has a C-to-U substitution in the terminal loop, did not have Drosha processing significantly different from that of the wt, but Dicer processing and mature microRNA yield were reduced by about 30% compared to those for the wt (Fig. 4B, left). This is consistent with the data obtained from transduced HEK293T cells. miR-K12-7v has a C-to-A SNP that disrupts a potential C-G base pair-ing and may result in a terminal loop more flexible than that of miR-K12-7wt (Fig. 4B, fourth panel). Several studies suggested that larger, more flexible terminal loops can affect the efficiency of both Drosha and Dicer processing (28, 29, 32). miR-K12-7v showed a slight decrease in Drosha processing (Fig. 4B) but an increase in Dicer processing compared to those for miR-K12-7wt (Fig. 4B). However, quantitative analysis of three consecutive as-says could not detect a statistically significant difference in matu-ration between miR-K12-7v and miR-K12-7wt (Fig. 4B).
miR-K12-10v has a C-to-G SNP within the terminal loop of miR-K12-10, which was not predicted to significantly change the terminal loop structure. miR-K12-10v SNP did not differ in either microprocessor or Dicer processing compared to that for miR-K12-10wt (Fig. 4B, fifth panel).
The analysis of three SNPs within the microRNA terminal loop indicated that processing efficiency for clinically observed variant microRNA alleles cannot simply be predicted. For miR-K12-4, an SNP in the terminal loop reduced Dicer processing by 30% but had no effect on Drosha cleavage, a result consistent with results presented in a previous report demonstrating that the terminal loop is not critical for Drosha processing (27); however, similar SNPs within miR-K12-7 and -10 did not affect processing.
Third, we examined SNPs within the mature microRNA se-quences. In miR-K12-2, a C-to-A SNP in miR-K12-2v created an additional A·U pair within the stem adjacent to the terminal loop (Fig. 4C, left). The efficiency of Drosha cleavage of miR-K12-2v was moderately decreased compared to that of miR-K12-2wt, and mature microRNAs were not detected for either miR-K12-2wt or miR-K12-2v (Fig. 4C, left). Interestingly, for miR-K12-2v, we de-tected a new RNA product of 35 nt in both the Drosha-only and Drosha/Dicer lanes (Fig. 4C, left). This product likely results from Drosha recognizing a novel cleavage site. Large terminal loops adjacent to long stems can be recognized by Drosha/DGCR8 as unstructured single-stranded (ssRNA) segments and as a result can be bound in an opposite orientation. Such alternative site usage yields small RNA products that do not give rise to mature microRNAs (24). Our data suggest that stabilization of the stem in miR-K12-2v may create an alternative Drosha processing site which would result in the 35-nt product.
The SNP in miR-K12-6 is at the 3=end of the miR-K12-6 ma-ture microRNA sequence. We showed very little difference in Drosha/Dicer processing efficiency between wild-type and variant
FIG 2Box-and-whisker plots representing the CT values of transduced
HEK293T cells stably expressing wild-type and variant microRNA sequences. The middle 50% of theCTvalues, known as the interquartile range, is inside the
box. The horizontal line inside the box represents the medianCTvalue, and the
whiskers represent 1.5 times the interquartile range on each side of the box. Any points outside the whiskers are depicted with a dot. Depiction of levels of significance are as follow: not significant (ns),Pⱖ0.01; *,P⬍0.01; **,P⬍
0.001; ***,P⬍0.0001.
on November 7, 2019 by guest
http://jvi.asm.org/
[image:7.585.72.252.67.435.2]miR-K12-6 (Fig. 4C, thrid panel), and quantification of mature microRNA showed less than a 10% decrease of mature miR-K12-6v compared to that for miR-K12-6wt (Fig. 4A). For miR-K12-9, we tested a highly variant allele, miR-K12-9mv, containing 10 SNPs located throughout the pre-microRNA, including the mature microRNA, which also severely affected folding, as pre-dicted by M-fold. The multiple SNPs in miR-K12-9mv completely abrogated Drosha/Dicer processing, and the quantification of ma-ture microRNA detected background levels (Fig. 4C, fifth panel). These data demonstrate not only that the multiple SNPs in the pre-microRNA precursor of 9mv prevent miR-K12-9mv processing, consistent with the results of RT-PCR assays with both HEK293T and PEL cells, but also that the altered RNA secondary structure is not an alternative substrate for Drosha/Dicer processing.
In summary, analysis of clinically observed microRNA SNPs by performingin vitromaturation assays demonstrated that SNPs occurring throughout pre-microRNAs can have profound effects
on microRNA maturation efficiency, ranging from the moderate decrease seen for K12-6 to the total abrogation seen for miR-K12-9mv.
Analysis of luciferase microRNA reporter assays for
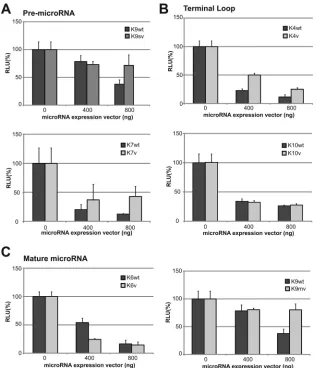
KSHV-encoded microRNAs.We next asked whether the observed SNPs
also affect microRNA silencing efficiency. To this end, we per-formed previously established luciferase microRNA sensor assays with recombinant expression plasmids of miR-K12-4, -6, -7, -9, and -10 under the control of the cytomegalovirus (CMV) pro-moter (33). To test each microRNA allele, we used microRNA sensor plasmids containing two binding sites for each wt KSHV microRNA within the 3=untranslated region of a luciferase re-porter. We excluded miR-K12-2 and -5 from this analysis because we could not detect any mature microRNAs when performingin
vitromaturation assays (Fig. 4).
For miR-K12-4v and -9sv, reduced repression activity was ob-served compared to that for wt, but miRs-K12-6, -7, and -10 showed no differences. miR-K12-9mv, which was demonstrated to abrogate expression, had no silencing activity (Fig. 5). These data confirmed that altered premicroRNA sequences correspond-ingly affect both microRNA maturation and silencing.
DISCUSSION
Our previous sampling of KSHV microRNA sequence heteroge-neity revealed that some viral microRNAs were highly conserved, while others displayed distinct sequence variability among sam-ples from KSHV-infected patients and from a number of PEL cell lines (15). Here we functionally analyzed single- or multiple-nu-cleotide polymorphisms of seven KSHV microRNA genes (Table 1), some of which were predicted to have a variant secondary
FIG 3Applied Biosystems custom small RNA RT-PCR analysis of KSHV latently infected PEL cell lines. Mature microRNA expression levels are shown as the fold change in expression of the target genes (microRNAs) normalized to the level of expression of the internal control gene (RNU6B) and relative to the level of expression by the wild-type BCBL-1 cell line using the 2-⌬⌬CTmethod (23). A positive fold change represents an upregulated PEL cell line, whereas a negative fold
change represents a downregulated PEL cell line. The negative fold changes presented here were obtained by taking the negative inverse (i.e.,⫺1/fold change of the result from the 2⫺⌬⌬CTmethod). Standard errors were computed in the R package plotrix. These values were then used to compute interval limits (95%) on
the basis of 4 degrees of freedom (3 treated sample replicates⫹3 control sample replicates⫺2). Values were then transformed from log2to fold change scale by
exponentiation, 2x, wherexdenotes the lower limit and upper limit of the standard error values for each PEL cell line of interest compared, and appropriate
[image:8.585.102.485.68.294.2]standard error bars are added. The standard error bars are asymmetrical due to exponentiation.
TABLE 4KSHV copy numbers in PEL lines determined by quantitative real-time PCR
PEL cell line KSHV copy no./reaction No. of KSHV copies/cell
BCBL-1 8,700,000 158
BCP-1 7,800,000 164
VG-1 660,000 19
JSC-1 2,100,000 74
BC-1 4,600,000 84
BC-2 1,100,000 344
BC-3 9,000,000 486
on November 7, 2019 by guest
http://jvi.asm.org/
[image:8.585.41.287.634.723.2]structure of pre-microRNAs, and evaluated the genes for their expression, maturation, and targeting efficiencies. We hypothe-sized that clinically observed polymorphisms translate into mi-croRNA expression differences that are associated with clinical phenotypes in KSHV-infected patients.
We generated retroviral vectors expressing either wt or variant microRNA alleles for seven microRNAs and transduced
HEK293T cells. We observed both increased and decreased ex-pression of mature viral microRNA in association with SNPs, and the magnitude of the expression difference varied in significance. The fact that all microRNAs were expressed from an identical CMV promoter within the integrated vector strongly suggested that differences in microRNA expression in this system must be due to pri- and pre-microRNA processing.
FIG 4A.In vitromaturation assay for miR-K12-5 and -9. These microRNA variants have SNPs in pre-microRNA. (First and third panels) Products on urea-polyacrylamide gel. Black arrows, pre-microRNA and microRNA produced from each processing; lanes M, molecular size markers. (Second and fourth panels) Graphs of pre-microRNA quantification normalized by the levels for the wt. Results are shown as percentages⫾standard deviations from three independent experiments. (B)In vitromaturation assay for miR-K12-4, miR-K12-7, and miR-K12-10. The variants of these microRNAs have SNPs in different positions in the terminal loop of pre-microRNA. (First, third, and fifth panels) Products on urea-polyacrylamide gels. Black arrows, pre-microRNA and microRNA produced from each processing; lanes M, molecular size markers. (Second, fourth, and sixth panels) Graphs of pre-microRNA quantification normalized by the levels for the wt. Results are shown as percentages⫾standard deviations from three independent experiments. (C)In vitromaturation assay for miR-K12-2, miR-K12-6, and miR-K12-9mv. The variants of these microRNAs have an SNP or SNPs within mature microRNA sequences. (First, third, and fifth panels) Products on urea-polyacrylamide gels. Black arrows, pre-microRNA produced; lanes M, molecular size markers. (Second, fourth, and sixth panels) Graphs of pre-microRNA quantification normalized by the levels for the wt. Results are shown as percentages⫾standard deviations from three independent experiments.
on November 7, 2019 by guest
http://jvi.asm.org/
[image:9.585.45.536.73.521.2]We also measured microRNA expression levels for the same microRNAs in seven PEL cell lines and found highly divergent expression levels. Data from these experiments suggest that in PEL cells mechanisms determining the level of expression of mature viral microRNAs are complex, and while SNPs in the pre-mi-croRNA play a role, other factors are also important. These may include the position of the pre-microRNA within the pri-mi-croRNA cluster, namely, SNPs outside the pre-mipri-mi-croRNA se-quence; competing effects of host or other viral microRNAs; and differential transcriptional activity between different PEL cells. In-terestingly, viral copy number did not predict the microRNA ex-pression level; for example, VG-1 cells contained the lowest num-ber of viral copies of all PEL lines tested but expressed high viral microRNA levels.
To directly test the effect of SNPs on microRNA processing, we performed stepwisein vitromaturation assays and compared the processing efficiency of variant and wt microRNA alleles located at different regions of the pre-microRNAs (ssRNA-double-stranded [dsRNA] stem junction, terminal loop, and mature microRNA). Two different models for the recognition of Drosha
cleavage sites have been proposed, and both suggest that Drosha determines its cleavage site by probing RNA structural features within the pre-microRNA. In one model, Drosha detects the ssRNA-dsRNA junction and cleaves at a site⬃11 nt away (27); the alter-native model proposes that Drosha measures and cleaves in refer-ence to the terminal loop (34). Both models suggest that Drosha determines its cleavage site by probing RNA structural features within the pri-microRNA. Our observation that miR-K12-9sv, which contains the SNP in the 5=arm, shows a significant reduc-tion in Drosha processing is consistent with sequential processing of the 5=and 3=cleavage sites. Thus, our data support the former junction model. Recently, Warf et al. reported that Drosha first recognizes and processes a site on the 5=arm of the pri-microRNA and subsequently determines the cleavage site on the 3=arm by measuring 2 nt from the cleavage site on the 5=arm (35). Poly-morphisms within the loop of miR-K12-4 reduced processing, while SNPs in miR-K12-7 and -10 had very small effects, demon-strating that the effect of sequence variations on loop processing cannot simply be predicted. This was equally true for miR-K12-5, for which a polymorphism led to more efficient processing, and
FIG 5Luciferase-based microRNA repressor assay. The microRNA sensor vector and increasing amounts (0, 400, and 800 ng) of the microRNA expression vector were cotransfected with 10 ng ofRenillaluciferase vector for normalization into HEK293T cells. Ratios on thexaxes indicate the amount of microRNA expression vector, and the relative light unit (RLU) values are normalized to the value forRenillaluciferase and are shown as a percentage compare to the value for the wt. Empty vector was used as a negative control. Results are shown as means⫾standard deviations from three independent experiments.
on November 7, 2019 by guest
http://jvi.asm.org/
[image:10.585.135.451.65.433.2]for miR-K12-2, where a polymorphism may create an alternate Drosha cleavage site, thereby preventing the formation of the ma-ture microRNA. The latter was also the case for miR-K12-9mv, where multiple SNPs completely abrogated processing (Fig. 4).
The phenotypic consequences of these observed microRNA maturation differences can fall into three major conceptual classes. First, as observed for miR-K12-9mv, complete abrogation of expression could lead to target genes that are targeted in wt infected cells not being downregulated. Second, the effect of de-creased processing is less clear since it depends on whether the particular microRNA is expressed at high or low levels. For exam-ple, miR-K12-5, which is expressed at very low levels in BCBL-1, may regulate more genes in BC-1 cells, where it is robustly ex-pressed, or may silence target genes more efficiently. In clinical samples, the majority of sequences encode the miR-K12-5v SNP, resulting in poor expression, perhaps suggesting evolutionary se-lection. A third aspect concerns SNPs that affect the functional domain or seed sequence (nt 2 to 8) of the mature microRNA, since such SNPs may or may not affect maturation but may po-tentially change the targeting specificity.
An important question is whether the observed KSHV microRNA SNPs and their associated expression differences have phenotypic consequences with respect to disease type, onset, and/or progression in KSHV-infected subjects. To address this question, it is important to understand (i) which microRNA-tar-geted genes are important for pathogenesis and (ii) which SNP-driven expression differences affect these targets. With respect to targeting, a number of reports have identified and confirmed spe-cific cellular and viral genes targeted by KSHV microRNAs, in-cluding those under study here (for a review, see the work of Haecker et al. [26]). More recently, KSHV microRNA targetomes have been analyzed in several PEL cell lines using high-throughput sequencing of RNA–UV cross-linking and immunoprecipitation and photoactivatable-ribonucleoside-enhanced UV cross-linking and immunoprecipitation methods (26,36). In BCBL-1 and BC-3 cells, 1,170 and 950 genes, respectively, have been identified as putative targets (26). Collectively, these studies have pointed to key regulatory pathways, such as inhibition of apoptosis, cell cycle control, immune evasion, and cytokine signaling, all central to KSHV biology and pathogenesis. For example, IRAK-1 has been identified as a target of miR-K12-9. The complete loss of this mi-croRNA in BC-3 cells or in infected subjects due to multiple SNPs may affect the Toll-like receptor/IL1R. Similarly, miR-K4 has been shown to downregulate caspase 3, making cells less resistant to apoptotic stimuli (37). Polymorphisms in miR-K12-5, which strongly affected processing, could affect MYD88, IL2RB, and CDK16 signaling.
Reports of three studies using different experimental systems indicated that miR-K12-9 can reduce the expression of the repli-cation-transcription activator (RTA) of KSHV by direct targeting (38–40). Moreover, miR-K12-5 has also been implicated in regu-lating RTA. It is interesting to note that BCBL-1, which expresses very low to undetectable levels of miR-K12-5, has a high sponta-neous KSHV reactivation rate. Thus, differential microRNA mat-uration of miR-K12-9 and miR-K12-5 may contribute to latency control. Interestingly, two KSHV-associated diseases, MCD and the recently identified KICS, are characterized by lytic replication rather than the tight latency observed in KS and PEL (18). We recently reported that SNPs within miR-K12-4, -5, -6, and -7 are statistically significantly associated with MCD/KICS risk. Of note,
while the reported overall frequency of SNPs within human mi-croRNA is low (41), several reports have identified specific microRNA SNPs in colorectal cancer that have been evaluated as potential biomarkers (42). Although human microRNA SNPs were not the focus of this study, it is worth investigating any com-pounding effects of potential human microRNA SNPs in the con-text of KSHV infection.
In summary, we have demonstrated that a number of SNPs within all three KSHV pre-microRNA domains observed in clin-ical subjects can have profound but not always predictable effects on microRNA maturation. These observations are of interest for cancer biology beyond KS, since many human tumors display altered microRNA expression profiles (for a review, see reference
43). To date, relatively little is known about the frequencies of polymorphisms in human microRNAs in cancer, and it is impor-tant to note that some microRNAs classified as deregulated may contain SNPs, thereby escaping detection through the most com-monly used TaqMan PCR arrays. Moreover, deep sequencing of small RNA libraries has identified many offset 5= processing events, which further expand targeting specificity.
ACKNOWLEDGMENTS
This project has been funded in whole or in part with federal funds from the National Cancer Institute, National Institutes of Health, under con-tract no. HHSN261200800001E and by RO1 119917-6 to R.R.
We acknowledge help with figures from Tammy Schroyer and techni-cal assistance from Marshall Thompson.
We disclose that we have no potential conflicts of interest.
REFERENCES
1.Chang Y, Cesarman E, Pessin MS, Lee F, Culpepper J, Knowles DM, Moore PS. 1994. Identification of herpesvirus-like DNA sequences in AIDS-associated Kaposi’s sarcoma. Science266:1865–1869.
2.Cesarman E, Chang Y, Moore PS, Said JW, Knowles DM.1995. Kaposi’s sarcoma-associated herpesvirus-like DNA sequences in AIDS-related body-cavity-based lymphomas. N. Engl. J. Med.332:1186 –1191. 3.Soulier J, Grollet L, Oksenhendler E, Cacoub P, Cazals-Hatem D,
Babinet P, d’Agay MF, Clauvel JP, Raphael M, Degos L, Sigaux F.1995. Kaposi’s sarcoma-associated herpesvirus-like DNA sequences in multi-centric Castleman’s disease. Blood86:1276 –1280.
4.Ambros V.2004. The functions of animal microRNAs. Nature431:350 – 355.
5.Bartel DP. 2004. MicroRNAs: genomics, biogenesis, mechanism, and function. Cell116:281–297.
6.Pfeffer S, Sewer A, Lagos-Quintana M, Sheridan R, Sander C, Grasser FA, van Dyk LF, Ho CK, Shuman S, Chien M, Russo JJ, Ju J, Randall G, Lindenbach BD, Rice CM, Simon V, Ho DD, Zavolan M, Tuschl T.
2005. Identification of microRNAs of the herpesvirus family. Nat. Meth-ods2:269 –276.
7.Boss IW, Plaisance KB, Renne R.2009. Role of virus-encoded microR-NAs in herpesvirus biology. Trends Microbiol.17:544 –553.
8.Cai X, Lu S, Zhang Z, Gonzalez CM, Damania B, Cullen BR.2005. Kaposi’s sarcoma-associated herpesvirus expresses an array of viral mi-croRNAs in latently infected cells. Proc. Natl. Acad. Sci. U. S. A.102:5570 – 5575.
9.Grundhoff A, Sullivan CS, Ganem D.2006. A combined computational and microarray-based approach identifies novel microRNAs encoded by human gamma-herpesviruses. RNA12:733–750.
10. Lin YT, Kincaid RP, Arasappan D, Dowd SE, Hunicke-Smith SP, Sullivan CS.2010. Small RNA profiling reveals antisense transcription throughout the KSHV genome and novel small RNAs. RNA16:1540 – 1558.
11. Samols MA, Hu J, Skalsky RL, Renne R.2005. Cloning and identification of a microRNA cluster within the latency-associated region of Kaposi’s sarcoma-associated herpesvirus. J. Virol.79:9301–9305.
12. Umbach JL, Cullen BR.2010. In-depth analysis of Kaposi’s
on November 7, 2019 by guest
http://jvi.asm.org/
associated herpesvirus microRNA expression provides insights into the mammalian microRNA-processing machinery. J. Virol.84:695–703. 13. O’Hara AJ, Chugh P, Wang L, Netto EM, Luz E, Harrington WJ,
Dezube BJ, Damania B, Dittmer DP.2009. Pre-micro RNA signatures delineate stages of endothelial cell transformation in Kaposi sarcoma. PLoS Pathog.5:e1000389. doi:10.1371/journal.ppat.1000389.
14. O’Hara AJ, Vahrson W, Dittmer DP.2008. Gene alteration and precur-sor and mature microRNA transcription changes contribute to the miRNA signature of primary effusion lymphoma. Blood111:2347–2353. 15. Marshall V, Parks T, Bagni R, Wang CD, Samols MA, Hu J, Wyvil KM, Aleman K, Little RF, Yarchoan R, Renne R, Whitby D.2007. Conser-vation of virally encoded microRNAs in Kaposi sarcoma-associated her-pesvirus in primary effusion lymphoma cell lines and in patients with Kaposi sarcoma or multicentric Castleman disease. J. Infect. Dis.195:645– 659.
16. Marshall V, Martro E, Labo N, Ray A, Wang D, Mbisa G, Bagni RK, Volfovsky N, Casabona J, Whitby D. 2010. Kaposi sarcoma (KS)-associated herpesvirus microRNA sequence analysis and KS risk in a Eu-ropean AIDS-KS case control study. J. Infect. Dis.202:1126 –1135. 17. Ray A, Marshall V, Uldrick T, Leighty R, Labo N, Wyvill K, Aleman K,
Polizzotto MN, Little RF, Yarchoan R, Whitby D. 2012. Sequence analysis of Kaposi sarcoma-associated herpesvirus (KSHV) microRNAs in patients with multicentric Castleman disease and KSHV-associated in-flammatory cytokine syndrome. J. Infect. Dis.205:1665–1676.
18. Uldrick TS, Wang V, O’Mahony D, Aleman K, Wyvill KM, Marshall V, Steinberg SM, Pittaluga S, Maric I, Whitby D, Tosato G, Little RF, Yarchoan R.2010. An interleukin-6-related systemic inflammatory syn-drome in patients co-infected with Kaposi sarcoma-associated herpesvi-rus and HIV but without multicentric Castleman disease. Clin. Infect. Dis.
51:350 –358.
19. Gottwein E, Cai X, Cullen BR.2006. A novel assay for viral microRNA function identifies a single nucleotide polymorphism that affects Drosha processing. J. Virol.80:5321–5326.
20. de Sanjose S, Marshall V, Sola J, Palacio V, Almirall R, Goedert JJ, Bosch FX, Whitby D.2002. Prevalence of Kaposi’s sarcoma-associated herpesvirus infection in sex workers and women from the general popu-lation in Spain. Int. J. Cancer98:155–158.
21. Yuan CC, Miley W, Waters D.2001. A quantification of human cells using an ERV-3 real time PCR assay. J. Virol. Methods91:109 –117. 22. Kutner RH, Zhang XY, Reiser J.2009. Production, concentration and
titration of pseudotyped HIV-1-based lentiviral vectors. Nat. Protoc.
4:495–505.
23. Livak KJ, Schmittgen TD.2001. Analysis of relative gene expression data using real-time quantitative PCR and the 2(⫺delta delta C(T)) method. Methods25:402– 408.
24. Lee Y, Kim VN.2007. In vitro and in vivo assays for the activity of Drosha complex. Methods Enzymol.427:89 –106.
25. Samols MA, Skalsky RL, Maldonado AM, Riva A, Lopez MC, Baker HV, Renne R.2007. Identification of cellular genes targeted by KSHV-encoded microRNAs. PLoS Pathog.3:e65. doi:10.1371/journal.ppat.0030065. 26. Haecker I, Gay LA, Yang Y, Hu J, Morse AM, McIntyre LM, Renne R.
2012. Ago HITS-CLIP expands understanding of Kaposi’s sarcoma-associated herpesvirus miRNA function in primary effusion lymphomas. PLoS Pathog.8:e1002884. doi:10.1371/journal.ppat.1002884.
27. Han J, Lee Y, Yeom KH, Nam JW, Heo I, Rhee JK, Sohn SY, Cho Y,
Zhang BT, Kim VN.2006. Molecular basis for the recognition of primary microRNAs by the Drosha-DGCR8 complex. Cell125:887–901. 28. Michlewski G, Guil S, Semple CA, Caceres JF.2008. Posttranscriptional
regulation of miRNAs harboring conserved terminal loops. Mol. Cell32:
383–393.
29. Zhang X, Zeng Y.2010. The terminal loop region controls microRNA processing by Drosha and Dicer. Nucleic Acids Res.38:7689 –7697. 30. Michlewski G, Caceres JF.2010. Antagonistic role of hnRNP A1 and
KSRP in the regulation of let-7a biogenesis. Nat. Struct. Mol. Biol.17:
1011–1018.
31. Trabucchi M, Briata P, Garcia-Mayoral M, Haase AD, Filipowicz W, Ramos A, Gherzi R, Rosenfeld MG.2009. The RNA-binding protein KSRP promotes the biogenesis of a subset of microRNAs. Nature459:
1010 –1014.
32. Zeng Y, Cullen BR.2005. Efficient processing of primary microRNA hairpins by Drosha requires flanking nonstructured RNA sequences. J. Biol. Chem.280:27595–27603.
33. Skalsky RL, Samols MA, Plaisance KB, Boss IW, Riva A, Lopez MC, Baker HV, Renne R.2007. Kaposi’s sarcoma-associated herpesvirus en-codes an ortholog of miR-155. J. Virol.81:12836 –12845.
34. Zeng Y, Yi R, Cullen BR.2005. Recognition and cleavage of primary microRNA precursors by the nuclear processing enzyme Drosha. EMBO J.
24:138 –148.
35. Warf MB, Johnson WE, Bass BL.2011. Improved annotation of C. elegans microRNAs by deep sequencing reveals structures associated with processing by Drosha and Dicer. RNA17:563–577.
36. Gottwein E, Corcoran DL, Mukherjee N, Skalsky RL, Hafner M, Nus-baum JD, Shamulailatpam P, Love CL, Dave SS, Tuschl T, Ohler U, Cullen BR.2011. Viral microRNA targetome of KSHV-infected primary effusion lymphoma cell lines. Cell Host Microbe10:515–526.
37. Suffert G, Malterer G, Hausser J, Viiliainen J, Fender A, Contrant M, Ivacevic T, Benes V, Gros F, Voinnet O, Zavolan M, Ojala PM, Haas JG, Pfeffer S.2011. Kaposi’s sarcoma herpesvirus microRNAs target caspase 3 and regulate apoptosis. PLoS Pathog.7:e1002405. doi:10.1371/journal .ppat.1002405.
38. Bellare P, Ganem D. 2009. Regulation of KSHV lytic switch protein expression by a virus-encoded microRNA: an evolutionary adaptation that fine-tunes lytic reactivation. Cell Host Microbe6:570 –575. 39. Lin X, Liang D, He Z, Deng Q, Robertson ES, Lan K.2011.
miR-K12-7-5p encoded by Kaposi’s sarcoma-associated herpesvirus stabilizes the latent state by targeting viral ORF50/RTA. PLoS One6:e16224. doi:10 .1371/journal.pone.0016224.
40. Ziegelbauer J, Grundhoff A, Ganem D.2006. Exploring the DNA bind-ing interactions of the Kaposi’s sarcoma-associated herpesvirus lytic switch protein by selective amplification of bound sequences in vitro. J. Virol.80:2958 –2967.
41. Saunders MA, Liang H, Li WH. 2007. Human polymorphism at microRNAs and microRNA target sites. Proc. Natl. Acad. Sci. U. S. A.
104:3300 –3305.
42. Zarate R, Boni V, Bandres E, Garcia-Foncillas J. 2012. MiRNAs and LincRNAs: could they be considered as biomarkers in colorectal cancer? Int. J. Mol. Sci.13:840 – 865.
43. Calin GA, Croce CM.2006. MicroRNA signatures in human cancers. Nat. Rev. Cancer6:857– 866.