White Rose Research Online URL for this paper: http://eprints.whiterose.ac.uk/87385/
Version: Accepted Version
Article:
El-Asrag, ME, Sergouniotis, PI, McKibbin, M et al. (16 more authors) (2015) Biallelic Mutations in the Autophagy Regulator DRAM2 Cause Retinal Dystrophy with Early Macular Involvement. American Journal of Human Genetics, 96 (6). 948 - 954. ISSN 0002-9297
https://doi.org/10.1016/j.ajhg.2015.04.006
[email protected] https://eprints.whiterose.ac.uk/ Reuse
Unless indicated otherwise, fulltext items are protected by copyright with all rights reserved. The copyright exception in section 29 of the Copyright, Designs and Patents Act 1988 allows the making of a single copy solely for the purpose of non-commercial research or private study within the limits of fair dealing. The publisher or other rights-holder may allow further reproduction and re-use of this version - refer to the White Rose Research Online record for this item. Where records identify the publisher as the copyright holder, users can verify any specific terms of use on the publisher’s website.
Takedown
If you consider content in White Rose Research Online to be in breach of UK law, please notify us by
Biallelic mutations in the autophagy regulator DRAM2 cause retinal
dystrophy with early macular involvement
Mohammed E. El-Asrag1,2,13, Panagiotis I. Sergouniotis3,4,13, Martin McKibbin5,
Vincent Plagnol6, Eamonn Sheridan7, Naushin Waseem3, Zakia Abdelhamed1,
Declan McKeefry8, Kristof Van Schil9, James A. Poulter1, UK Inherited Retinal
Disease Consortium, Colin A. Johnson1, Ian M. Carr1, Bart P. Leroy9,10,11, Elfride De
Baere9, Chris F. Inglehearn1, Andrew R. Webster3,12, Carmel Toomes1**, Manir Ali1*
1
Section of Ophthalmology and Neuroscience, Leeds Institute of Biomedical and
Clinical Sciences, University of Leeds, Leeds LS9 7TF, UK. 2
Department of Zoology, Faculty of Science, Benha University, 13511 Benha, Egypt. 3
UCL Institute of Ophthalmology, University College London, London EC1V 9EL,
UK. 4
Institute of Human Development, Faculty of Medical and Human Sciences,
University of Manchester, Manchester M13 9WL, UK. 5
Department of Ophthalmology, St. James’s University Hospital, Leeds LS9 7TF,
UK. 6
UCL Genetics Institute, University College London, London WC1E 6BT, UK. 7
Yorkshire Regional Genetics Service, St. James’s University Hospital, Leeds LS9
7TF, UK. 8
Bradford School of Optometry and Visual Science, University of Bradford, Bradford
BD7 1DP, UK. 9
Center for Medical Genetics, Ghent University Hospital, 9000 Ghent, Belgium. 10
Department of Ophthalmology, Ghent University Hospital, 9000 Ghent, Belgium. 11
Division of Ophthalmology, The Children’s Hospital of Philadelphia, Philadelphia
19104, USA. 12
Moorfields Eye Hospital, London EC1V 2PD, UK.
13
These authors contributed equally to this work.
Correspondence:
Abstract
Retinal dystrophies are an overlapping group of genetically heterogeneous
conditions resulting from mutations in over 250 genes. Here we describe five families
affected by an adult-onset retinal dystrophy with early macular involvement and
associated central visual loss in the third/fourth decade of life. Affected individuals
were found to harbor disease causing variants in DRAM2 (DNA-damage regulated
autophagy modulator protein 2). Homozygosity mapping and exome sequencing in a
large, consanguineous British family of Pakistani origin revealed a homozygous
frameshift variant (c.140delG, p.Gly47Valfs*3) in nine affected family members.
Sanger sequencing of DRAM2 in 322 unrelated probands with retinal dystrophy
revealed one European subject with compound heterozygous DRAM2 changes
(c.494G>A, p.Trp165* and c.131G>A, p.Ser44Asn). Inspection of previously
generated exome sequencing data in unsolved retinal dystrophy cases identified a
homozygous variant in an individual of Indian origin (c.64_66del, p.Ala22del).
Independently, a gene-based case-control association study was conducted using
an exome sequencing dataset of 18 phenotypically similar cases and 1,917 controls.
Using a recessive model and a binomial test for rare, presumed biallelic, variants,
DRAM2 was found to be the most statistically-enriched gene; one subject was a
homozygote (c.362A>T, p.His121Leu) and another a compound heterozygote
(c.79T>C, p.Tyr27His and c.217_225del, p.Val73_Tyr75del). DRAM2 encodes a
transmembrane lysosomal protein thought to play a role in the initiation of
autophagy. Immunohistochemical analysis showed DRAM2 localization to
photoreceptor inner segments and to the apical surface of retinal pigment epithelial
cells where it may be involved in the process of photoreceptor renewal and recycling
Retinal dystrophies are a clinically and genetically heterogeneous group of disorders
characterized by progressive photoreceptor degeneration.1 The pattern of visual loss
and retinal appearance varies and is related to the degree to which cone and rod
photoreceptors are affected. In subjects with retinitis pigmentosa (RP), for example,
the rods are affected more severely and earlier than the cones, and the presenting
symptoms are typically night blindness and/or visual field loss. Disorders in which the
cones are more severely affected than the rods include macular dystrophies (MD;
localized loss of central/macular cones as a primary or secondary event) and
cone-rod dystrophies (CRD; central and peripheral cone involvement). MD and CRD show
clinical overlap and loss of central vision is often the common presenting symptom.
Frequently, subjects with CRD also report light sensitivity, a symptom which can
suggest generalized cone system dysfunction. Assigning a disease category can
sometimes be challenging with confounding factors being inter- and intra-familial
phenotypic variability and the presence of age-dependent phenotypic transitions. RP,
MD and CRD can be transmitted in a dominant, recessive or X-linked manner and, to
date, variants in 70, 14 and 30 genes respectively have been shown to give rise to
these conditions (RetNet, accessed February 2015).
The initial aim of this study was to identify the genetic basis of an adult-onset retinal
dystrophy with early macular involvement (Figure 1) in a consanguineous Pakistani
family with multiple affected members living in the UK (family ES1; Figure 2).
Affected individuals became symptomatic early in the third decade, describing
increasing difficulty with close visual tasks. Neither light sensitivity nor night
blindness were significant early symptoms. There was progressive loss of visual
acuity in all symptomatic individuals; light sensitivity and difficulty seeing in dim
illumination were inconsistent features of advanced disease. Fundus examination
revealed maculopathy in all symptomatic individuals tested, with peripheral retinal
degeneration being a frequent finding in older subjects. Notably, optical coherence
tomography (OCT) imaging in the pre-symptomatic second decade (subject IV.9,
family ES1; Figure 2) suggested early central photoreceptor cell loss.
This study was approved by the Leeds East (Project number 03/362), Moorfields Eye
Hospital and Ghent University Hospital (PA2015/012) Research Ethics Committees
the study following their informed consent. Peripheral blood was collected from
affected individuals, parents and unaffected relatives where these were available.
Genomic DNA was extracted from blood leukocytes according to standard
procedures.
Homozygosity mapping was performed using Affymetrix 250K single nucleotide
polymorphism (SNP) arrays on genomic DNA from seven affected individuals from
family ES1. Data were analysed with the AgileMultiIdeogram software. Two
homozygous regions were shared among all seven affected individuals: a 10.1Mb
interval on chromosome 1 (between rs6677953 and rs814987; containing 160
genes) and a 2.9Mb region on chromosome 7 (between rs17140297 and
rs12706292; containing 5 genes) (Figure S1). Given the absence of genes
previously reported to be associated with retinal dystrophy within these intervals, a
whole exome sequencing (WES) strategy was utilized to identify the molecular
pathology in the family. DNA from one affected family member (subject IV.6, family
ES1; Figure 2) was analysed using a HiSeq2000 system (Illumina). After aligning the
sequencing data output against the reference genome (hg19/GRCh37) as well as
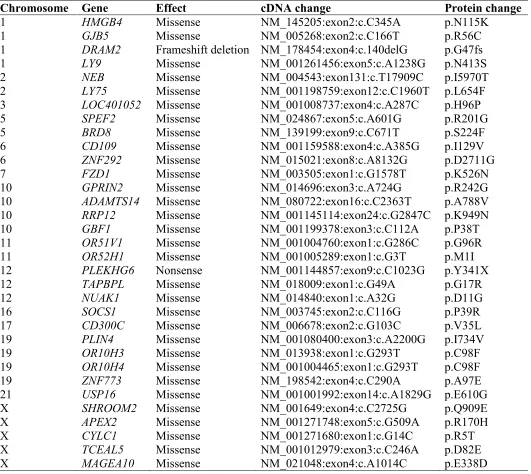
variant calling and filtration steps, a list of 33 homozygous variants was generated
(Table S1). Only one of these sequence alterations mapped within the shared
regions of homozygosity identified in family ES1. This was a homozygous
single-base deletion in DRAM2 (DNA-damage regulated autophagy modulator protein 2
[MIM 613360], NM_178454.4), that creates a frameshift and is predicted to lead to
premature truncation of the protein (c.140delG, p.Gly47Valfs*3). Segregation of this
variant with the disease in the family (Figure 2) was confirmed by Sanger
sequencing of DRAM2 exon 4 (Figure 3A; primer pairs are shown in Table S2). This
change was excluded from 159 ethnically matched control individuals and was not
present in the dbSNP and EVS databases. It was found once in heterozygous state
in WES data from 61,486 unrelated individuals sequenced as part of various
disease-specific and population genetic studies (accessed via. the Exome
Aggregation Consortium [ExAC] browser, version 0.2). Notably, no homozygous
presumed loss-of-function variant in DRAM2 was present in the ExAC dataset. A
maximum two point LOD score of 2.4 was obtained between c.140delG and the
disease in nine genotyped family members using Superlink.2 For this analysis the
disease was assumed to segregate in the family in a recessive fashion with full
penetrance.
In an attempt to identify further families with DRAM2-associated retinopathy, the
seven coding DRAM2 exons and flanking splice sites, were PCR amplified and
Sanger sequenced in 74 individuals diagnosed with RP, 154 with CRD or MD and 94
with infantile-onset retinal dystrophy (Leber Congenital Amaurosis) (primer pairs are
shown in Table S2). This screen identified an isolated female case (subject 1325) of
European ancestry in the CRD/MD panel that was compound heterozygous for a
nonsense variant in exon 6 (c.494G>A, p.Trp165*) and a missense change in exon 3
(c.131G>A, p.Ser44Asn). The latter affects a serine residue that is conserved from
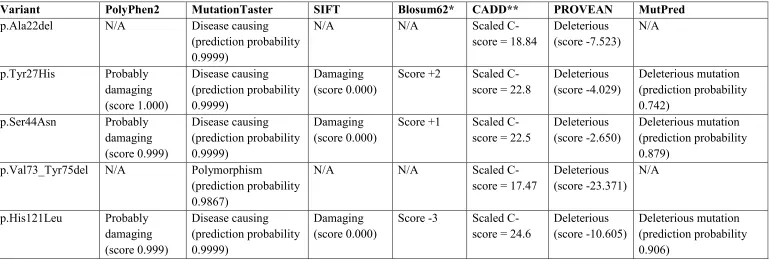
human to nematodes (Figures 3 and S2). This missense change was predicted to be
pathogenic by a number of bioinformatics prediction tools (Table S3) and was not
present in dbSNP, EVS or ExAC databases. The c.494G>A change is an annotated
variant in dbSNP (rs201422368) with a MAF of 0.008% (1/13,003) in EVS and
0.003% (3/118,572) in ExAC; it is only reported in heterozygous state in these
databases. Subject 1325 experienced blurred vision at age 29 and was soon after
found to have maculopathy on fundus examination. At age 35, she also complained
of night vision problems and sensitivity to light; fundus examination revealed mild
peripheral retinal degeneration in addition to the maculopathy. At the age of 47, she
had acuity of 1.0 logMAR in each eye and electrophysiology revealed severely
attenuated or absent full-field electroretinograms (ERGs) and pattern ERGs (Figure
S3).
Meanwhile, interrogation of previously generated WES data from unsolved cases
with retinal dystrophy lead to the identification of a homozygous variant in exon 3 of
DRAM2 (c.64_66del, p.Ala22del) in a subject of Indian origin. This change, which
removes an alanine residue from the first transmembrane domain of the molecule,
was predicted to be pathogenic using bioinformatics prediction tools (Table S3) and
was absent in dbSNP, EVS and ExAC databases. The variant was confirmed by
Sanger sequencing (Figure 3) and segregated in family BL1 with the disease as
expected in a recessive manner (Figure 2). The affected subject, a lady in her early
forties, has maculopathy with a normal full-field ERG indicating absence of a
anaemia, which may have been brought on by a vegetarian diet or may be the result
of a genetic factor due to parental consanguinity.
Independently, in a study designed to identify novel genes associated with retinal
disease, 28 families from the inherited retinal disease clinics at Moorfields Eye
Hospital, London were ascertained. Details on this cohort have been previously
reported.3 The main inclusion criteria included a CRD or MD phenotype and an
absence of retinal imaging findings suggestive of ABCA4-retinopathy. Genomic DNA
from the probands was analyzed by WES and variant filtering was performed as
previously described.3 The molecular diagnosis was identified in 10 of 28 families.3
On the 18 unsolved cases, a gene based case-control association analysis was
performed utilising WES data generated by a consortium of UK based researchers
(“UCL-exomes”, Table S4). Aiming to minimize bias,4 UCL-exomes controls were
initially split into two sets. The first set of 500 randomly selected samples was used
in conjunction with EVS to determine variant frequency for inclusion in case control
tests. In that context, “rare” variants are variants with MAF<0.5% in EVS and no
more than 2 occurrences in this first set of 500 UCL-exomes control samples. The
second set of 1,917 unrelated UCL-exomes controls was used to directly compute
gene based association p-values, using a recessive disease mode, i.e. samples
were labeled as potential carriers only if they carried at least two rare (using the
definition stated above) and potentially functional (presumed loss-of-function,
non-synonymous or splice site altering) variants. A binomial test was used for excess of
such potential biallelic variants in the 18 cases compared to the 1,917 controls
(Table S4).
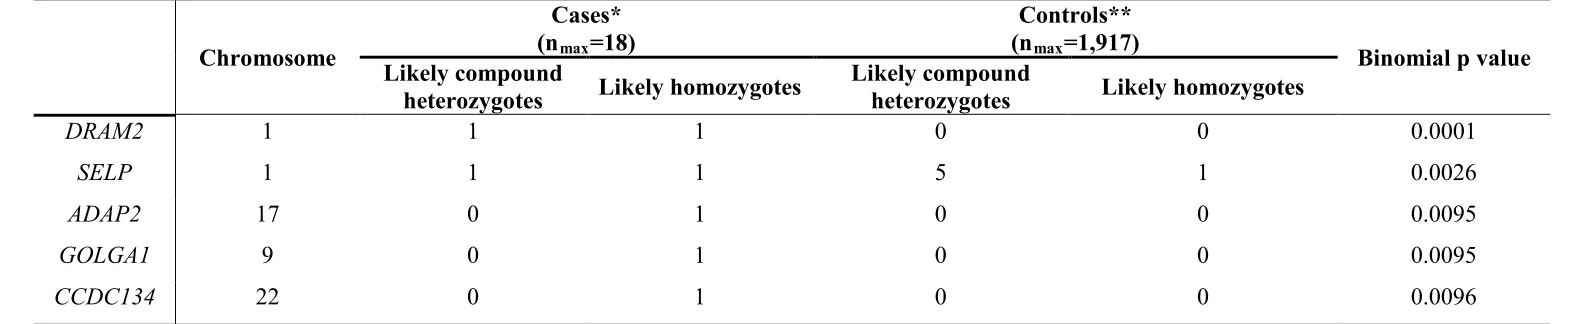
The most significant gene-based p-value was obtained for DRAM2 (Table S4). Two
of the 18 cases were found to harbor likely disease-associated variants in this gene.
A 37-year-old female proband (family gc17004, Figure 2) of European ancestry was
a compound heterozygote for a missense variant (c.79T>C, p.Tyr27His) and an
in-frame deletion (c.217_225del, p.Val73_Tyr75del). Furthermore, a 47-year-old male
proband of South Asian origin (family gc4728, Figure 2; parents not knowingly
related) was homozygous for a missense change (c.362A>T, p.His121Leu). None of
these three changes which are reported to be pathogenic by a number of prediction
and p.His121Leu, affect a tyrosine and histidine residue respectively that are
evolutionarily conserved from human to nematodes (Figure S2).. All changes were
confirmed by Sanger sequencing (Figure 3) and segregated with the disease
phenotype in the family as expected for a recessive condition (Figure 2).
Both probands presented with central visual loss (at age 29 for the proband of family
gc17004 and at age 37 for the proband of family gc4728). At presentation, fundus
examination and retinal imaging revealed macular photoreceptor loss with an
apparently normal peripheral retina. These observations were consistent with
electrophysiological findings. Notably, 8 years after presentation, the central areas of
atrophy have expanded and peripheral changes were observed. Electrodiagnostic
testing was repeated and revealed more widespread retinal dysfunction in both
cases. The phenotype was notably similar to the affected members of families ES1,
BL1 and subject 1325 described above.
Given that affected members of family ES1 are homozygous for a DRAM2 variant
that is likely to lead to either nonsense mediated decay of the encoded mRNA, or to
a truncated protein of only 47 amino acids, the molecular pathology of the disease is
likely to be loss of DRAM2 function. This speculation is further supported by the
biallelic state and predicted severity of the additional six likely disease-causing
variants identified as well as by the similar phenotype in all five families.
DRAM2, also known as TMEM77 (transmembrane protein 77), encodes a 266 amino
acid protein containing six putative transmembrane domains (Figure 3B). Previous
overexpression studies in HEK293 cells localised it to lysosomal membranes5,6
where it initiates the conversion of endogenous LC3-I (microtubule-associated
protein light chain 3) to the general autophagosome marker protein, LC3-II
(LC3-1/phosphatidylethanolamine conjugate). This suggests that DRAM2 induces the
autophagy process.5 Autophagy is a natural cell survival mechanism triggered in
response to stress stimuli such as nutrient starvation or the accumulation of
damaged organelles. It is responsible for degrading and recycling cytoplasmic
proteins and lipids as well as organelles within the cell.7 This usually begins with
isolation of the macromolecules and organelles within the cytoplasm into single
autophagosomes subsequently fuse with lysosomes containing acid hydrolases and
form a double-membrane autolysosome.8,9 Although the aim of autophagy is to
relieve cellular stress, its excessive induction can in some cases lead to apoptosis
rather than protection from cell death.10
There is also some evidence to suggest that DRAM2 may have tumour suppressor
capability. DRAM2 transcript and protein expression are reduced in ovarian tumours
compared to normal matched tissues.5 Also, siRNA knockdown of endogenous
DRAM2 results in reduced conversion to LC3-II in cells subject to starvation-induced
autophagy11 and increased survival in deoxyrubicin treated cells that would normally
undergo p53-mediated apoptosis.5 We note that examination of medical histories in
the reported subjects with DRAM2-associated retinal dystrophy provided no
evidence of increased susceptibility to cancer.
Although DRAM2 is transcribed ubiquitously (Figure S4),6 in light of the finding that
human DRAM2 variants cause retinal dystrophy, we investigated the precise
distribution of the normal protein in the mouse retina. Serial sections were taken from
mouse eyes at postnatal day 30 and were stained with a goat polyclonal antiserum
against DRAM2 (Figure 4). Confocal immunofluorescence microscopy showed that
DRAM2 localized to the inner segment of the photoreceptor layer and the apical
surface of the retinal pigment epithelium (RPE), which are located at the basal and
distal ends of the outer segment respectively. This coincides with the primary
pathology observed on pre-symptomatic OCT analysis in which the photoreceptor
layer appeared specifically affected.
This localization is consistent with a role for DRAM2 in photoreceptor autophagy.
Photoreceptor outer segments are in a constant state of renewal by ciliogenesis in
response to light-induced damage. Recent studies have suggested that there is
interplay between ciliogenesis and autophagy. In one study it was shown that
disruption of ciliogenesis partially inhibited autophagy, while blocking autophagy
enhanced primary cilia growth and cilia-associated signaling during normal nutritional
conditions. The authors therefore proposed that basal autophagy regulated ciliary
growth through the degradation of proteins required for intraflagellar transport.12 In
at centriolar satellites located close to the base of the cilium, was rapidly degraded
by serum starvation-induced autophagy. This led to ciliary growth, suggesting that
OFD1 normally inhibited ciliogenesis.13
A high level of autophagy is also expected to take place in the RPE. These cells
have a key role in processing shed photoreceptor outer segment discs and
consequently, in removing toxic metabolites and recycling phototransduction
components. This process which involves RPE phagocytosis causes up to 10%
photoreceptor volume loss each day and is entrained to the circadian rhythm.14,15
Indeed there is increasing interest in the role of autophagy in preserving
photoreceptor function in connection with the circadian cycle,16 the aging process17
and retinal disease pathology.18 It is therefore likely that the absence of DRAM2 in
the retina reduces the efficiency of autophagy in recycling cell components, which in
turn reduces photoreceptor renewal, leading to the thin photoreceptor layer observed
on OCT which is the first presenting feature in pre-symptomatic patients.
To summarize, we have shown that biallelic missense, nonsense and frameshift
variants in DRAM2 cause retinal dystrophy with early macular cone photoreceptor
involvement. The clinical features and course of retinal degeneration were highly
similar among affected individuals from the five reported families. Our findings
suggest that DRAM2 is essential for photoreceptor survival and further studies are
expected to provide important insights into its precise role in the retina.
Acknowledgements
We would like to thank the patients and their families who participated in this study.
We thank our colleagues at University College London, UK for kindly contributing to
the UCL-exomes control panel. Additional members of the UK Inherited Retinal
Disease Consortium include Graeme Black, Georgina Hall, Stuart Ingram, Rachel
Gillespie, Simon Ramsden, Forbes Manson (Manchester Academic Health Science
Centre, University of Manchester), Alison Hardcastle, Michel Michaelides, Michael
Cheetham, Gavin Arno, Niclas Thomas, Shomi Bhattacharya, Tony Moore (UCL
Institute of Ophthalmology and Moorfields Eye Hospital), Andrea Nemeth, Susan
Downes, Stefano Lise (Division of Clinical Neurology, University of Oxford) and
work was supported by grants from NERC (Yorkshire branch), Macular Society UK
(www.maculardisease.org), the UK National Institute for Health Research
(Biomedical Research Centre, Moorfields Eye Hospital and Institute of
Ophthalmology), RP Fighting Blindness and Fight For Sight (RP Genome Project
GR586), the Belspo IAP project P7/43, the Belgium Medical Genomics Initiative
(BeMGI), the Ghent University Special Research Fund (BOF15/GOA/011) and the
Funds for Research in Ophthalmology (FRO). CAJ and CFI were supported by a
grant from the Jules Thorn Charitable Trust. MEE is funded by an Egyptian
Government Scholarship and KVS is a doctoral fellow from the Institute for
Innovation by Science and Technology (IWT). EDB and BPL are senior clinical
Web Resources
The URLs for data presented herein are as follows:
AgileMultiIdeogram, http://dna.leeds.ac.uk/agile/AgileMultiIdeogram/
ANNOVAR, http://www.openbioinformatics.org/annovar/
CADD, http://cadd.gs.washington.edu/
ClustalW, http://www.ebi.ac.uk/clustalw2/
dbSNP, http://www.ncbi.nlm.nih.gov/SNP/
ExAC browser, http://exac.broadinstitute.org/
Galaxy, https://usegalaxy.org
GATK, http://www.broadinstitute.org/gsa/wiki/index.php/The_Genome_Analysis_Tool
kit
IGV (Interactive Genomics Viewer), http://www.broadinstitute.org/software/igv/
Mutation Taster, http://www.mutationtaster.org/
MutPred, http://mutpred.mutdb.org/
NHLBI Exome Sequencing Project Exome Variant Server (EVS),
http://evs.gs.washington.edu/
Online Mendelian Inheritance in Man (OMIM), http://www.omim.org/
Picard, http://picard.sourceforge.net/
PolyPhen2, http://genetics.bwh.harvard.edu/pph2/
Primer3, http://frodo.wi.mit.edu/cgi-bin/primer3/
PROVEAN, http://provean.jcvi.org/
RetNet, https://sph.uth.edu/retnet/home.htm
SIFT, http://sift.jcvi.org/
References
1. Wright, A.F., Chakarova, C.F., Abd El-Aziz, M.M., Bhattacharya, S.S. (2010). Photoreceptor degeneration: genetic and mechanistic dissection of a complex trait. Nat. Rev. Genet. 11, 273–284.
2. Silberstein, M., Tzemach, A., Dovgolevsky, N., Fishelson, M., Schuster, A., Geiger, D. (2006). Online system for faster multipoint linkage analysis via parallel execution on thousands of personal computers. Am. J. Hum. Genet. 78, 922-935.
3. Sergouniotis, P.I., Chakarova, C., Murphy C., Becker M., Lenassi E., Arno G., Lek M., MacArthur D.G., UCL-Exomes Consortium, Bhattacharya S.S., et al. (2014). Biallelic variants in TTLL5, encoding a tubulin glutamylase, cause retinal dystrophy. Am. J. Hum. Genet. 94, 5, 760-769.
4. Pearson, R.D. (2011). Bias due to selection of rare variants using frequency in controls. Nat. Genet. 43, 392–393, author reply 394–395.
5. Park, S.M., Kim, K., Lee, E.J., Kim, B.K., Lee, T.J. Seo, T., Jang, I.S., Lee, S.H., Kim, S., Lee, J.H., et al. (2009). Reduced expression of DRAM2/TMEM77 in tumor cells interferes with cell death. Biochem. Biophys. Res. Commun. 4, 1340-1344.
6. O’Prey, J., Skommer, J., Wilkinson, S., Ryan, K.M. (2009). Analysis of DRAM-related proteins reveals evolutionarily conserved and divergent roles in the control of autophagy. Cell Cycle 8, 2260– 2265.
7. Levine, B., Klionsky, D.J. (2004). Development by self-digestion: molecular mechanisms and biological functions of autophagy. Dev. Cell 6, 463-477.
8. Yoshimori, T. (2004). Autophagy: a regulated bulk degradation process inside cells. Biochem. Biophys. Res. Commun. 313, 453-458.
9. Kroemer, G., Jäättelä, M. (2005). Lysosomes and autophagy in cell death control. Nat. Rev. Cancer 5, 886-897.
10. Yuan, J., Lipinski, M., Degterev, A. (2003). Diversity in the mechanisms of neuronal cell death. Neuron 40, 401-413.
11. Yoon, J.H., Her, S., Kim, M., Jang, I.S., Park, J. (2012). The expression of damage-regulated autophagy modulator 2 (DRAM2) contributes to autophagy induction. Mol. Biol. Rep. 39, 1087-1093.
13. Tang, Z., Lin, M.G., Stowe, T.R., Chen, S., Zhu, M., Stearns, T., Franco, B., Zhong, Q. (2013) Autophagy promotes primary ciliogenesis by removing OFD1 from centriolar satellites. Nature 502, 254-257.
14. Young, R.W., Bok, D. (1969). Participation of the retinal pigment epithelium in the rod outer segment renewal process. J. Cell Biol. 42, 392–403.
15. Nguyen-Legros, J., Hicks D. (2000) Renewal of photoreceptor outer segments and their phagocytosis by the retinal pigment epithelium. Int. Rev. Cytol. 196, 245-313.
16. Yao, J., Jia, L., Shelby, S.J., Ganios, A.M., Feathers, K., Thompson, D.A., Zacks, D.N. (2014). Circadian and noncircadian modulation of autophagy in photoreceptors and retinal pigment epithelium. Invest. Ophthalmol. Vis. Sci. 55, 3237-3246.
17. Rodríguez-Muela, N., Koga, H., García-Ledo, L., de la Villa, P., de la Rosa, E.J., Cuervo, A.M., Boya, P. (2013). Balance between autophagic pathways preserves retinal homeostasis. Aging Cell 12, 478-488.
Figure 1. Clinical features of individuals from family ES1 with retinal dystrophy
and early maculopathy caused by recessive DRAM2 mutations.
Colour fundus photograph (A), fundus autofluorescence (C), infra-red reflectance (E)
and OCT (F) images from the right eye of case IV.9 at 25 years. Corresponding
images from an unaffected individual are provided for comparison (B, D, G and H).
Macular atrophy with white dots at its temporal edge are observed on fundus
photography. On autofluorescence imaging, there is a central area of reduced
autofluorescence surrounded by a hyperautofluorescent ring. On OCT imaging, there
is significant thinning in the foveal region consistent with photoreceptor loss. A
composite colour photograph from the left eye of case III.1, at the age of 48, is also
shown (I). This reveals macular atrophy, mid-peripheral bone-spicule pigmentation
and attenuated retinal vessels. On the infra-red reflectance images, the horizontal
green lines indicate the position and direction of the corresponding OCT scan. The
scale bars represent 200µm.
Figure 2. Pedigrees of families/cases reported in this study and DRAM2
mutation segregation data.
Affected individuals are shaded black. The maternal grandmother of individual
gc17004 has age-related macular degeneration in her 90s (shaded grey). The
genotypes for all tested family members are shown below each individual, with M
representing the mutant allele and + representing the wild-type allele.
Figure 3. Variants in DRAM2 cause retinal dystrophy.
(A) Schematic representation of the DRAM2 genomic structure and major transcript
(NM_178454.4) showing the location and sequence traces of the seven
disease-causing variants identified in this study. (B) Schematic diagram of the DRAM2
protein showing the location of the affected amino-acids within the protein domains.
Figure 4. Localization of DRAM2 to the photoreceptor inner segments and
retina pigment epithelium.
Radial 6µm cryosections of mature mouse retina (P30) were labeled with
anti-DRAM2 (M-12, Santa Cruz Biotechnology) and anti-Rhodopsin (Sigma-Aldrich)
followed by the secondary antibody Alexa Fluor 568-conjugated donkey anti-goat
488-conjugated chicken anti-rabbit immunoglobulin (green) (Molecular Probes
Incorporation) respectively, and the nuclei counterstained with DAPI (Vector
Laboratories). An independent section stained with both secondary antibodies only
and another with peptide (Santa Cruz Biotechnology, sc-241077-P)-competition
against the DRAM2 primary antibody served as negative controls in the experiment.
Immunofluorescence was analyzed with an Eclipse TE2000-E inverted confocal
microscope (Nikon Instruments) and shows localisation of DRAM2 to the inner
segment of the photoreceptor layer (PIS) and the retinal pigment epithelium (RPE).
Rhodopsin localises to the outer segment of the photoreceptor layer (POS). The
other layers are the outer nuclear layer (ONL), outer plexiform layer (OPL), inner
nuclear layer (INL), inner plexiform layer (IPL) and the ganglion cell layer (GCL).
D
C
I
F
G
H
Case 1325
M1= c.131G>A (p.Ser44Asn) M2 = c.494G>A (p.Trp165*)
M1/M2 II I II I IV III M/M M/+ Family gc4728 c.362A>T (p.His121Leu) M/+ Family gc17004
M1 = c.79T>C (p.Tyr27His)
M2 = c.217_225del (p.Val73_Tyr75del)
II I IV III M1/M2 M2/+ M1/+ M2/+ M1/+ M/M M/M M/+ II I IV III
M/M M/M M/M
2 4
3
protein: 266 aa genomic: 22.885 kb
(minus strand) 111.140.216 111.117.332 5 4 3 2
1 6 7 8 9
transcript: 1886 nt
Wild-type Mutant A c.79T>C p.Tyr27His Family GC17004 c.131G>A p.Ser44Asn Case 1325 c.140delG p.Gly47Valfs*3 Family ES1 c.217_225delGTTCGTTAT p.Val73_Tyr75del Family GC17004
A
AT C CT C T C TAT TCAGG AG G GAC CTGT C GTA CATT T TGATGTCCGTGTTc.362A>T p.His121Leu Family GC4728 c.494G>A p.Trp165* Case 1325 G C C C
G TG A G A GTTATCTGG G GG
B
T
T T A A AT A
T T
A TTTCA AT CAT AC
T TA A
A C G A
AT A G
T T G TA GT
A A A
G
A
GAC CA TGGTACAGT
A A AA A
T CATT TATGTTCGT A
T T
T A T
G
C C C
G TG A ATGTAA T
T T A A G G G A C
GTT T T GTGT A
Internal External
1
2
3
4
5
6
N C p.Val73_ Tyr75del p.Gly47Valfs*3 p.Ser44Asn p.Tyr27His p.Trp165* p.His121Leu p.Ala22del c.64_66delGCT p.Ala22del Family BL1 T T
A CT CTTTCATA
T T
A TTTCA AT CAT AC
G T
CT
GCL
IPL
INL
OPL
ONL
PIS
POS
RPE
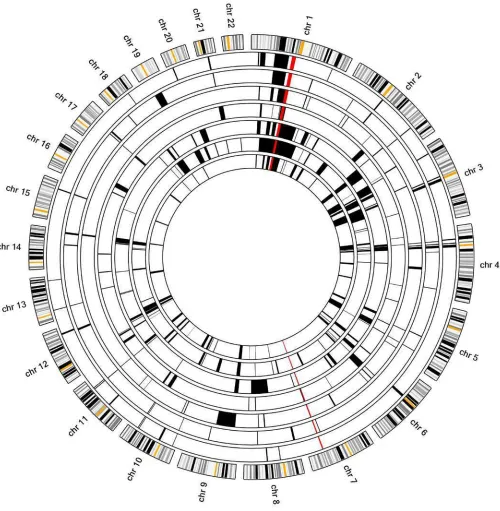
Figure S1. Autozygosity mapping in family ES1.The schematic results generated by AgileMultiIdeogram
software are shown (http://dna.leeds.ac.uk/agile/AgileMultiIdeogram/). The figure displays the locations of
homozygous regions identified from SNP genotyping data from multiple individuals against a circular
ideogram of chromosomes 1–22. Data for individuals III.1, III.4, III.5, III.13, IV.6, IV.8 and IV.11 are
shown. The homozygous regions in each family member are shown in black. The common autozygous
regions identified in all affected family members are highlighted in red. A large region spanning over 10Mb
was identified on chromosome 1 (Chr1:106188422-116250460 hg38) and a smaller region spanning >3Mb
Human 12 PSALVIWTSAAFIFSYITAVTLHHIDPALPY 42 Chimp 12 PSALVIWTSAAFIFSYITAVTLHHIDPALPY 42 Dog 12 PSALVIWTAAAFIFSYITAIILHHVDPALPY 42 Cow 12 PSALVIWTAAAFIFSYITAITLHHVDPVLPY 42 Mouse 12 PSALVIWTFATFIFSYITAITLHHVDPALPY 42 Rat 12 PSALVIWTFATFIFSYITAITLHHVDPALPY 42 Chicken 12 PVALVVWSAATFVFSYITAIVLHHVDPLVPY 42 Zebrafish 12 PVALVVWTAATFIFAYITAVVLRHVDPLVPY 42 Nematode 14 PVLIALIFFVQSFFVYTIAVLKHDVDPIFPY 44
p.Val73_Tyr75del ttt
Human 60 LNIAAVLCIATIYVRYKQVHAL-SP-EENVI 88 Chimp 60 LNIAAVLCIATIYVRYKQVHAL-SP-EENVI 88 Dog 60 LNIAAVLCIATIYVRYKQVQAL-SP-EETHI 88 Cow 60 LNIAAVLCVATIYVRYKQVHAL-NP-EENRI 88 Mouse 60 LNIAAVLGIATMYVRYKQVHAL-NP-EENLI 88 Rat 60 LNIAAVLGIATIYVRYKQVHAL-NP-EENLI 88 Chicken 60 LNVSSFLGMATMYVRYKQVYAL-NP-DKSRI 88 Zebrafish 60 LNVSAFLGVATMYVRYKQLQALADV-DDTRL 87 Nematode 62 ANISSVLLALVVFVRYRQLRGIFAFYDEANL 92
Human 29 TAVTLHHIDPALPYISDTGTVAPEKCLFGAM 59 Chimp 29 TAVTLHHIDPALPYISDTGTVAPEKCLFGAM 59 Dog 29 TAIILHHVDPALPYISDTGTVAPEKCLFGAM 59 Cow 29 TAITLHHVDPVLPYISDTGTVAPEKCLFGAM 59 Mouse 29 TAITLHHVDPALPYISDTGTIPPERCLFGVM 59 Rat 29 TAITLHHVDPALPYISDTGTMPPERCLFGVM 59 Chicken 29 TAIVLHHVDPLVPYISDTGTIPPERCLFGIM 59 Zebrafish 29 TAVVLRHVDPLVPYISDTGTVAPERCVFGVM 59 Nematode 31 IAVLKHDVDPIFPYLSSAADKRPQSCIFAIG 61
p.His121Leu t
Human 106 LSIVANFQKTTLFAAHVSGAVLTFGMGSLYM 136 Chimp 106 LSIVANFQKTTLFAAHVSGAVLTFGMGSLYM 136 Dog 106 LSVVANFQKTAFFIVHVCGAVLTFGMGSLYM 136 Cow 106 LSLVANFQKTTFFAVHVCGAVLTFGMGSLYM 136 Mouse 106 LSLVANFQKSTLFIVHVCGAVLAFSMGSFYM 136 Rat 106 LSLVANFQKSALFIVHVCGAVLAFSMGSFYM 136 Chicken 106 LCIIANFQKCILYYIHVVGACLTFGVGAIYM 136 Zebrafish 107 MCVVANFQKTTLFSMHLVGAILTFGIGALYV 137 Nematode 110 LFFVANVQETAIIPVHMSSAVASFGGFSIYM 140
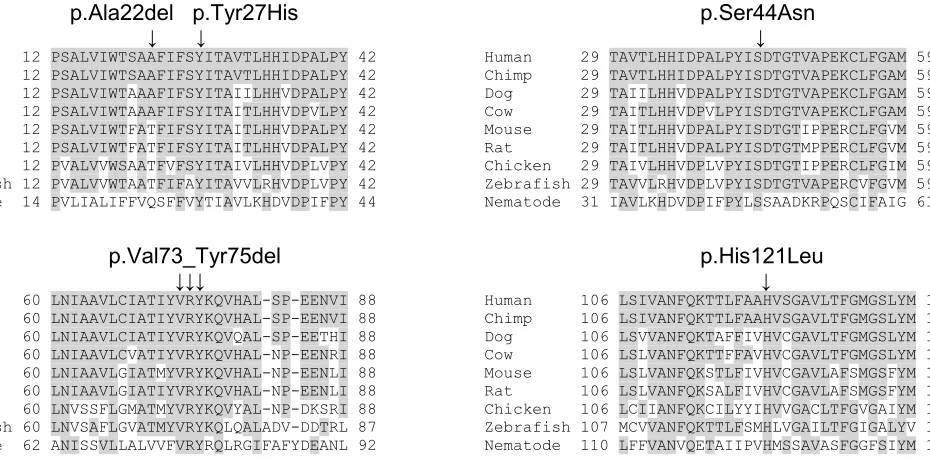
Figure S2. Protein sequence alignment of human DRAM2 with orthologues. Multiple protein
alignments were calculated using HomoloGene (http://www.ncbi.nlm.nih.gov/homologene) [Edgar, R.C.
(2004) Nucleic Acids Res. 32, 1792-7]. Thirty amino acid residues surrounding each mutation are shown.
Conserved amino acid residues are shaded. The positions of the missense mutations p.Tyr27His, p.Ser44Asn
and p.His121Leu are indicated along with the in-frame deletions p.Ala22del and p.Val73_Tyr75del.
Accession numbers: Human NP_848549.3; Chimpanzee XP_001162049.1; Dog XP_005621845.1; Cow
NP_001070464.1; Mouse NP_080289.1; Rat NP_001020189.1; Chicken XP_003642762.1; Zebrafish
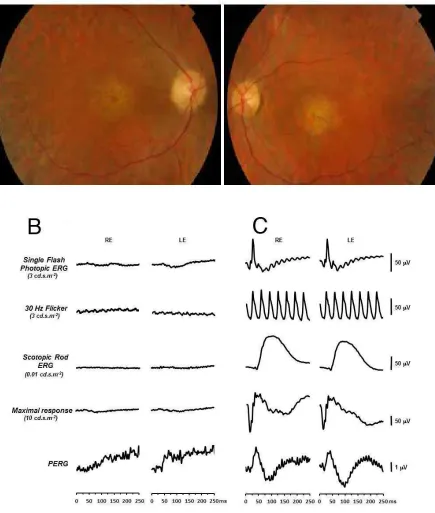
[image:23.595.73.538.64.299.2]Figure S3. Clinical features of Case 1325 with a diagnosis of retinal dystrophy and early maculopathy.
Fundus photographs of the right and left eyes at 35 years of age (A) shows central macular atrophy with
grey dots in the temporal macula with intra-retinal pigment migration. Flash and pattern electroretinography
(ERG and PERG) of the case (at 46 years of age) (B) and a normal control individual (C) were recorded to
ISCEV standard protocols for the right (RE) and left (LE) eyes. Light-adapted single flash photopic ERG,
30Hz flicker (cone-isolating) ERG, dark-adapted scotopic rod ERG and PERG traces were all severely
attenuated or absent compared to the normal control values suggesting a generalised rod-cone dysfunction.
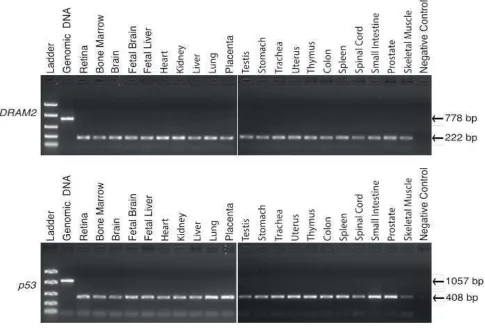
fetal tissue total RNA was purchased from Clontech and converted to cDNA using standard protocols. The
retina cDNA was purchased from Clontech. A 222-bp fragment of DRAM2spanning intron 6 was amplified
from the cDNAs using primers DRAM2_RT_F 5’-GGAGCTGTGCTTACCTTTGG-3’ and DRAM2_RT_R
5’-GGGGTTCCAATGGAGTTTCT-3’ (genomic PCR size = 778 bp). P53 control primers used were P53
RT-F 5’-GTACTCCCCTGCCCTCAACA-3’ and P53 RT-R 5’-CTGGAGTCTTCCAGTGTGAT-3’ (cDNA
[image:25.595.55.540.135.463.2]Chromosome Gene Effect cDNA change Protein change
1 HMGB4 Missense NM_145205:exon2:c.C345A p.N115K
1 GJB5 Missense NM_005268:exon2:c.C166T p.R56C
1 DRAM2 Frameshift deletion NM_178454:exon4:c.140delG p.G47fs
1 LY9 Missense NM_001261456:exon5:c.A1238G p.N413S
2 NEB Missense NM_004543:exon131:c.T17909C p.I5970T
2 LY75 Missense NM_001198759:exon12:c.C1960T p.L654F
3 LOC401052 Missense NM_001008737:exon4:c.A287C p.H96P
5 SPEF2 Missense NM_024867:exon5:c.A601G p.R201G
5 BRD8 Missense NM_139199:exon9:c.C671T p.S224F
6 CD109 Missense NM_001159588:exon4:c.A385G p.I129V
6 ZNF292 Missense NM_015021:exon8:c.A8132G p.D2711G
7 FZD1 Missense NM_003505:exon1:c.G1578T p.K526N
10 GPRIN2 Missense NM_014696:exon3:c.A724G p.R242G
10 ADAMTS14 Missense NM_080722:exon16:c.C2363T p.A788V
10 RRP12 Missense NM_001145114:exon24:c.G2847C p.K949N
10 GBF1 Missense NM_001199378:exon3:c.C112A p.P38T
11 OR51V1 Missense NM_001004760:exon1:c.G286C p.G96R
11 OR52H1 Missense NM_001005289:exon1:c.G3T p.M1I
12 PLEKHG6 Nonsense NM_001144857:exon9:c.C1023G p.Y341X
12 TAPBPL Missense NM_018009:exon1:c.G49A p.G17R
12 NUAK1 Missense NM_014840:exon1:c.A32G p.D11G
16 SOCS1 Missense NM_003745:exon2:c.C116G p.P39R
17 CD300C Missense NM_006678:exon2:c.G103C p.V35L
19 PLIN4 Missense NM_001080400:exon3:c.A2200G p.I734V
19 OR10H3 Missense NM_013938:exon1:c.G293T p.C98F
19 OR10H4 Missense NM_001004465:exon1:c.G293T p.C98F
19 ZNF773 Missense NM_198542:exon4:c.C290A p.A97E
21 USP16 Missense NM_001001992:exon14:c.A1829G p.E610G
X SHROOM2 Missense NM_001649:exon4:c.C2725G p.Q909E
X APEX2 Missense NM_001271748:exon5:c.G509A p.R170H
X CYLC1 Missense NM_001271680:exon1:c.G14C p.R5T
X TCEAL5 Missense NM_001012979:exon3:c.C246A p.D82E
X MAGEA10 Missense NM_021048:exon4:c.A1014C p.E338D
For whole exome sequencing, exon capture was performed using the SureSelectXT Human All Exon V4
target enrichment reagent (Agilent) and paired-end sequencing was completed on a HiSeq2000 system
(Illumina). The raw sequence data files were processed on the Galaxy platform and aligned to the human
reference genome sequence (hg19/GRCh37) using Bowtie2. The alignment was processed in BAM format
with Picard and the Genome Analysis Toolkit to correct alignments around insertions-deletions, and to
identify and remove duplicates and sequencing reads with quality scores less than 20. The Unified
Genotyper reported variants in the VCF format which were annotated using ANNOVAR. For filtering, we
excluded variants (i) with a read depth of less than 10, (ii) that were outside the exon and flanking two
base-pair splice donor and acceptor sites, (iii) that were synonymous and (iv) with a minor allele frequency
(MAF) >1% in the NHLBI Exome Sequencing Project Exome Variant Server (EVS; release version
[image:26.595.36.567.75.549.2]Exon Forward primer (5’-3’) Reverse primer (5’-3’) Size (bp)
Variant PolyPhen2 MutationTaster SIFT Blosum62* CADD** PROVEAN MutPred
p.Ala22del N/A Disease causing (prediction probability 0.9999)
N/A N/A Scaled C-score = 18.84
Deleterious (score -7.523) N/A p.Tyr27His Probably damaging (score 1.000) Disease causing (prediction probability 0.9999) Damaging (score 0.000)
Score +2 Scaled C-score = 22.8
Deleterious (score -4.029) Deleterious mutation (prediction probability 0.742) p.Ser44Asn Probably damaging (score 0.999) Disease causing (prediction probability 0.9999) Damaging (score 0.000)
Score +1 Scaled C-score = 22.5
Deleterious (score -2.650)
Deleterious mutation (prediction probability 0.879)
p.Val73_Tyr75del N/A Polymorphism
(prediction probability 0.9867)
N/A N/A Scaled C-score = 17.47
Deleterious (score -23.371) N/A p.His121Leu Probably damaging (score 0.999) Disease causing (prediction probability 0.9999) Damaging (score 0.000)
Score -3 Scaled C-score = 24.6
Deleterious (score -10.605)
Deleterious mutation (prediction probability 0.906)
URLs: PolyPhen2, http://genetics.bwh.harvard.edu/pph2/[Adzhubei, I.A. et al. (2010). Nat. Methods 7, 248-9]; Mutationtaster, http://www.mutationtaster.org/
[Schwarz, J.M. et al. (2010). Nat. Methods 7, 575-6]; SIFT, http://sift.jcvi.org/[Ng, P.C. et al. (2003). Nucleic Acids Res. 31, 3812-4]; Blosum62 [Henikoff, S.
et al. (1993). Proteins 17, 49-61]; CADD, http://cadd.gs.washington.edu [Kircher, M. et al. (2014). Nat. Genet. 46:310-5]; PROVEAN, http://provean.jcvi.org/
[Choi, Y. et al. (2012). PLoS ONE 7, e46688]; MutPred, http://mutpred.mutdb.org/ [Li, B. et al. (2009). Bioinformatics 25, 2744-50]. *Blosum62 scores range
from +3 to -3 and negative scores are more likely to be damaging substitutions. **CADD scores are reported as scaled C-scores and values œ"42 and œ 10
[image:28.842.36.806.68.328.2]Chromosome
Cases* (nmax=18)
Controls** (nmax=1,917)
Binomial p value Likely compound
heterozygotes Likely homozygotes
Likely compound
heterozygotes Likely homozygotes
DRAM2 1 1 1 0 0 0.0001
SELP 1 1 1 5 1 0.0026
ADAP2 17 0 1 0 0 0.0095
GOLGA1 9 0 1 0 0 0.0095
CCDC134 22 0 1 0 0 0.0096
*Case group: 18 probands with (i) a retinal dystrophy with early cone photoreceptor involvement (macular dystrophy or cone rod dystrophy), (ii) absence of fundoscopic and fundus autofluorescence imaging features suggestive of ABCA4-retinopathy and (iii) an unknown molecular diagnosis after inspection
of exome sequencing data for causal variants in known retinal dystrophy genes. The exomes from all cases were prepared using the Agilent SureSelectXT Human All Exon V5 capture and an Illumina HiSeq2000 sequencer.
**UCL-exomes control samples: 1,917 unrelated individuals, predominantly of European origin, with no diagnosis of retinal disease. Exome sequencing data from controls was analyzed using the same sequence variant-calling strategy as the cases. Variants with a read depth <7 were ignored.
We considered a case, or a control, as a “recessive disease candidate” if it harboured œ4" rqvgpvkcnn{" hwpevkqpcn" *rtguwogf" nquu-of-function, non-synonymous or splice site altering) rare variants in the heterozygous state (“likely eqorqwpf"jgvgtq|{iqvguÑ+"qt"œ3"rqvgpvkcnn{"hwpevkqpcn."tctg"xctkcpv"kp" the homozygous state (“likely homozygotes”). As “rare” we defined changes that: (i) had a minor allele frequency of <0.5% in the EVS dataset and (ii) had <2 occurrences in 500 additional UCL-exomes control samples; the latter were randomly sampled and not included directly in the case-control analysis. The BAM files were inspected using the Integrative Genomics Viewer (IGV) and obvious artefacts were removed. This IGV check also excluded pairs of genetic variants located on the same haplotype, when evidenced by the presence of both variants on the same short sequencing reads.
[image:29.842.25.823.69.231.2]