A&A 580, A105 (2015)
DOI:10.1051/0004-6361/201425539 c
ESO 2015
Astronomy
&
Astrophysics
Sequential planet formation in the HD 100546 protoplanetary disk?
P. Pinilla
1, T. Birnstiel
2, and C. Walsh
11 Leiden Observatory, Leiden University, PO Box 9513, 2300 RA Leiden, The Netherlands
e-mail:[email protected]
2 Harvard-Smithsonian Center for Astrophysics, 60 Garden Street, Cambridge, MA 02138, USA
Received 18 December 2014/Accepted 25 May 2015
ABSTRACT
Context.The disk around the Herbig Ae star, HD 100546, shows structures that suggest the presence of two companions in the disk at∼10 and∼70 AU. The outer companion seems to be in the act of formation.
Aims.Our aims are to provide constraints on the age of the planets in HD 100546 and to explore the potential evidence for sequential planet formation in transition disks such as HD 100546.
Methods.We compare the recent resolved continuum observations of the disk around HD 100546 with the results of dust evolution simulations using an analytical prescription for the shapes of gaps carved by massive planets.
Results.An inner pressure bump must have been present since early in the disk lifetime to have good agreement between the dust evolution models and the continuum observations of HD 100546. This pressure bump may have resulted from the presence of a very massive planet (∼20 MJup), which formed early in the inner disk (r ∼10 AU). If only this single planet exists, the disk is likely to
be old, comparable to the stellar age (∼5−10 Myr). Another possible explanation is an additional massive planet in the outer disk (r∼70 AU): either a low-mass outer planet (<∼5MJup) injected at early times, or a higher mass outer planet (>∼15MJup) formed very
recently, traps the right amount of dust in pressure bumps to reproduce the observations. In the latter case, the disk could be much younger (∼3.0 Myr).
Conclusions.In the case in which two massive companions are embedded in the disk around HD 100546, as suggested in the literature, the outer companion could be at least>∼2.5 Myr younger than the inner companion.
Key words.protoplanetary disks – circumstellar matter – planet-disk interactions
1. Introduction
Transition disks display different interesting structures such as dust depleted cavities (e.g. Brown et al. 2009; Andrews et al. 2011), azimuthal asymmetries (e.g.Isella et al. 2013;Casassus et al. 2013; van der Marel et al. 2013;Pérez et al. 2014), spi-ral arms (e.g. Fukagawa et al. 2004;Muto et al. 2012;Grady et al. 2013), and spatial segregation of small and large particles (e.g.Follette et al. 2013;Garufi et al. 2013;Zhang et al. 2014; Hashimoto et al. 2015). These structures suggest that these disks host a massive planet or multiple planets. Observations of planet candidates in transition disks (e.gHuélamo et al. 2011;Kraus & Ireland 2012;Biller et al. 2012;Quanz et al. 2013) have further supported this idea. Nonetheless, other mechanisms such as pho-toevaporation may also play an important role and explain some of the observed structures (e.g.Alexander et al. 2006;Owen & Clarke 2012;Rosotti et al. 2013).
Observations of the disk around the Herbig Ae star HD 100546 have indicated the presence of two potential com-panions. By modelling the [O I] 6300 Å emission line ob-tained with VLT/UVES in HD 100546,Acke & van den Ancker (2006) suggested the presence of a massive planet (>∼20 MJup)
at∼6.5 AU distance from the star. Using VLTI/AMBER atH -andK-band,Tatulli et al.(2011) proposed a less massive planet (∼1−8 MJup) in the inner disk. However, using MIDI/VLT
ob-servations and by constraining the curvature of the disk wall of the inner cavity,Mulders et al.(2013) found a lower limit for the mass of the inner companion. Taking temperature changes
when a planet opens a gap into account,Mulders et al.(2013) conclude that the mass of a potential planet located at∼10 AU is 20−30 MJup. On the other hand, high-contrast imaging with
VLT/NACO shows signatures of a massive planet (∼15MJup) at
∼70 AU, which may be its formation stage (Quanz et al. 2013, 2015).Currie et al. (2014) reported Gemini/NICI thermal in-frared data and detected the outer protoplanet at the same lo-cation and brightness as that found byQuanz et al.(2013). This emission seems to have an extended structure which may come from a circumplanetary disk. In addition, spiral arms have been observed in scattered light images (e.g.Grady et al. 2001;Ardila et al. 2007;Boccaletti et al. 2013;Avenhaus et al. 2014), which may be related to the presence of these planets.
Previous observations of protoplanetary disks have revealed that the disk radial extent can be much larger for the molecular gas than for the millimetre-sized particles. This is the case for TW Hya, whose CO emission extends up to∼215 AU, while the mm grains extend to only∼60 AU from the star (Andrews et al. 2012).Birnstiel & Andrews(2014) suggest that radial drift may be responsible for the different radial extents of the gas and large dust grains. However, the disk around HD 100546 appears to be a special case: the radial extent of the gas is∼400 AU, while most of the emission at millimetre wavelengths comes from a narrow ring concentrated at∼26 AU, with a width of∼21 AU. In addition, a much fainter ring of emission (a factor of∼100 lower) comes from the outer disk, which is centred at∼190 AU, with a width of∼75 AU (Walsh et al. 2014). This double-ring emission is consistent with the two-planet scenario (Walsh et al. 2014).
Ring-like emission in transition disks can be explained by the dust evolution, which occurs when a single massive planet or multiple planets interact with the disk (e.g.Pinilla et al. 2012a, 2015;Zhu & Stone 2014). An alternative explanation for multi-ple rings is magneto-rotational instability in the outer regions of disks (e.g.Pinilla et al. 2012b;Flock et al. 2015). In protoplane-tary disks, particles migrate inward because of the sub-Keplerian motion of the gas (e.g.Weidenschilling 1977;Nakagawa et al. 1981;Tanga et al. 1996;Birnstiel et al. 2010). When a massive planet opens a gap, particles stop their inward migration due to the positive pressure gradient at the outer edge of that gap. Dust grains accumulate and grow in this preferential region known as a pressure trap, whose location and structure depend on disk vis-cosity, the mass and location of the planet (e.g.Rice et al. 2006). In this work, we investigate the influence of the two sug-gested planets in HD 100546 on the dust distribution in the disk, and compare the resulting predicted continuum emission with the most recent mm observations. By computing dust evolution models for different parameters, we aim to put constraints on different planet properties, and to address the following ques-tions: can dust evolution, without any planet(s) in the disk, ex-plain the two-component emission observed with ALMA? What happens when a single inner companion is assumed? What if two companions are assumed? To answer these questions, we cover a large parameter space, which includes the mass, location, and age of the planets1, and disk viscosity.
For HD 100546, proper hydrodynamical simulations for the planet-disk interaction are highly computationally demanding because of the large radial separation between the two planet candidates. Since we aim to study several cases with different planet properties, we instead use analytical solutions to model the shapes of gaps in the disk. We use the Crida et al. (2006) prescription for the width, and theFung et al.(2014) prescrip-tion for the depth. In Sect.2, we explain the assumptions for the carved gaps, the potential caveats, and the connection with dust evolution models. In Sect. 3we present the results of the dust evolution models, the computed visibilities at different wave-lengths (λ =[0.87,1.0,3.0,7.0] mm), and the comparison with ALMA and ATCA observations of HD 100546. Sections4and5 are the discussion and conclusions of this work.
2. Models and set-up
In this section, the analytical approximation for the shape of the gaps carved by planets is described, together with the dust evo-lution models, and the computation of the visibilities. To test this analytical approach and the validity of the resulting dust density distributions, different benchmark cases are considered.
2.1. Carved gaps
Because of the large separation between the potential planets in HD 100546 (∼10 AU and∼70 AU), hydrodynamical simu-lations are computationally expensive. High grid resolution is needed close to the planet locations, and the inner and outer ra-dial boundaries should be far enough from the planet positions to avoid unphysical results. Because our interest is focussed on the influence of the gas surface density carved by planets on the radial dust evolution, we use an approximation of the ra-dial shape of the gaps in protoplanetary disks rather than full hydrodynamical simulations. We assume the analytical results
1 By age, we mean the time since the injection of the planet into the
simulations.
presented in Crida et al.(2006) and Fung et al. (2014). Crida et al.(2006) proposed an equilibrium profile considering the vis-cous torque (tν), gravitational torque (tg), and the torque removed
by pressure supported waves or pressure torque (tP). This
analyt-ical profile therefore satisfies thattν+tg+tP =0. In anα-disk
(Shakura & Sunyaev 1973), where disk viscosity is parametrised asν =αc2s/Ω, the equilibrium solution for the gas surface
den-sity (Σ) when a planet located atrp is interacting with the disk
(seeCrida et al. 2006, Eqs. (11), (13), and (14)) is rH
Σ
dΣ dr !
= tg−
3 4αc
2 s
H
r
2
rrpΩ2pa00+32αc2srrH
, (1)
withrH being the Hill radius of the planet (rH = rp(q/3)1/3,
where q is the planet-stellar mass ratio MP/M?, and rp the
planet orbital radii),Ωpthe angular orbital velocity of the planet,
H/rthe aspect ratio,csthe sound speed, anda00a dimensionless
function given by
a00 (r−rp) rH
!
=1
8
(r−rp)
rH
−1.2
+200
(r−rp)
rH
−10
· (2)
This dimensionless functiona00is an ansatz from 2D vertically isothermal simulations. When Eq. (1) is solved, a boundary con-dition needs to be imposed, which in our case is assumed to be the unperturbed density. Because the equilibrium solution of Eq. (1) assumes the gravitational and pressure torques to be null close to the planet (−2rH<r−rp <2rH), the depth of the gap is
not perfectly constrained.
An analytical solution for the depth of the gap close to the planet is difficult to calculate because of the strong tidal grav-itational field of the planet in this region. Using two indepen-dent codes (PEnGUInandZEUS90),Fung et al.(2014) provided an empirical relation of the depth of the gap carved by a non-migrating giant planet in a locally isothermal disk. They consider a large parameter space for the planet-stellar mass ratioq, vis-cosityα, and aspect ratioH/r, finding very similar results with both codes.
We imitate the gas gaps carved by massive planets by solving Eq. (1) and correcting the depth of the gap with the empirical scalings (Eqs. (12) and (14) fromFung et al. 2014), between −2rH <r−rp <2rH. Both the width and the depth of the gaps
are essential for the final dust distributions in disks. The width determines the location of the pressure maximum at the outer edge of the gap and therefore the location of the peak of the millimetre emission (e.g.Pinilla et al. 2012a). The depth is also important because of the possible dust filtration (e.g.Rice et al. 2006;Zhu et al. 2012).
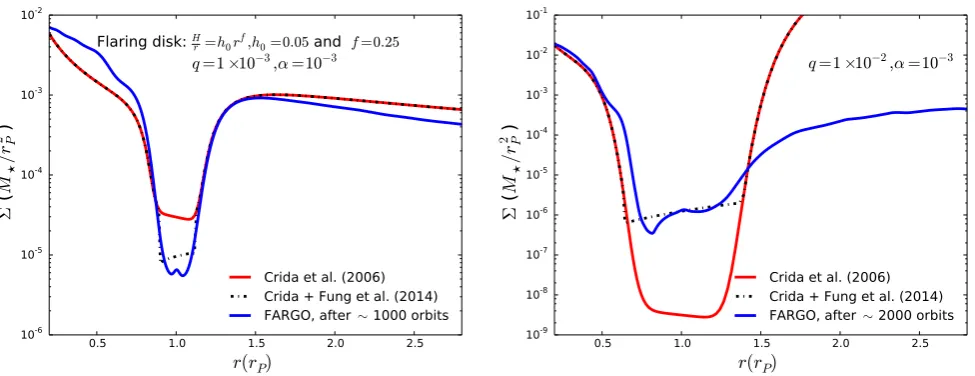
To compare the results from these approximations, Fig. 1 displays the comparison of the gas surface density between hy-drodynamical simulations done withFARGO(Masset 2000), and the gap shape obtained using the solution byCrida et al.(2006) and corrected by the empirical relations fromFung et al.(2014). For this comparison, it is considered that a massive planet, with q=1×10⁻³(left panel) andq =1×10⁻²(right panel), opens
a gap in a flared disk, i.e.H/r=h0rf, withh0 =0.05 being the
aspect ratio at the position of the planet, and f a flaring index equal to 0.25. The disk viscosity is assumed to beα = 10−3. From the hydrodynamical simulations, the gas surface density is azimuthally averaged after the disk reaches a steady-state, 1000 and 2000 planet orbits forq =1×10⁻³ andq =1×10⁻²
re-spectively. As shown in Fig.1, this approximation for the shape of the gaps is very good for the case ofq=1×10⁻³. In the case
0.5 1.0 1.5 2.0 2.5
r
(
r
P)
10-6 10-5 10-4 10-3 10-2
Σ
(
M
/r
2
)
Pq
=1
×10
−3,α
=10
−3Flaring disk:
Hr=
h
0r
f,h
0=0.
05and
f
=0.
25Crida et al. (2006)
Crida + Fung et al. (2014)
FARGO, after
∼1000 orbits
0.5 1.0 1.5 2.0 2.5
r
(
r
P)
10-9 10-8 10-7 10-6 10-5 10-4 10-3 10-2 10-1
Σ
(
M
/r
2
)
Pq
=1
×10
−2,α
=10
−3 [image:3.595.58.546.75.263.2]Crida et al. (2006)
Crida + Fung et al. (2014)
FARGO, after
∼2000 orbits
Fig. 1.Comparison between the analytical gap prescriptions and hydro-simulations when a massive planet opens a gap. The disk is assumed to be a flared disk, i.e.H/r=h0rf, withh0=0.05 the aspect ratio at the position of the planet, andfflaring index equal to 0.25. The planet-to-star mass
ratio isq=1×10⁻³(left panel) andq=1×10⁻²(right panel), and the planet position isr
p=1. The disk viscosity is assumed to beα=10−3for
both cases.
azimuthally-averaged profile from the hydrodynamical simula-tions. When a very massive planetq>∼5×10⁻³interacts with the disk, the formed gaps become eccentric (Kley & Dirksen 2006), making the radial gap profile wider and less steep. The location of the pressure bump at the outer edge of the gap may change from 7−8RHto 9−10RHfor a non-eccentric to an eccentric gap.
Thus, in the case of transition disks, to reproduce the peak of the millimetre emission at a certain distance from the star using this analytical approach, we give an approximate value for the planet location rather than a specific position whenq>∼5×10⁻³. Since the match between the hydrodynamical simulations and the ana-lytical approach only works for the gap shape, and potential dif-ferences become significant far from the gap location (Fig. 1), we assume the gas surface density to follow the unperturbed density far from the location of the planet. Additional azimuthal features that may exist when a massive planet interacts with the disk, such as vortices or spiral arms (e.g.Kley & Dirksen 2006; Ataiee et al. 2013;Fung et al. 2014;Zhu & Stone 2014;Juhasz et al. 2015), are not considered in this work. Instead, we focus on the radial distribution of particles.
2.2. Dust evolution and radial gas velocity
To model the dust evolution, we use the formulation ofBirnstiel et al.(2010). This model solves the advection-diffusion diff eren-tial equation for the dust surface densityΣd, and simultaneously
simulates the growth, fragmentation, and erosion of dust grains by considering collisions of particles. For the relative velocities between particles, Brownian motion, turbulent velocities, set-tling to the midplane, and radial dust velocities are taken into account. The detailed explanation of this dust evolution model is inBirnstiel et al.(2010). This model has been used extensively to investigate dust distributions in different types of disks, includ-ing comparisons with observations (e.g. Birnstiel et al. 2013; van der Marel et al. 2013;Pinilla et al. 2013;de Juan Ovelar et al. 2013). We investigate the evolution of 180 species of dust grains, defined by size from 1 µm to 200 cm. The radial velocity of dust depends on the coupling of the dust particles to the gas. The Stokes number (St) quantifies this coupling, which in the Epstein regime, where the mean free path of the gas moleculesλmfp is
higher than the size of particlesa(λmfp≥4/9a), is defined as St= aρs
Σ
π
2, (3)
whereρsis the volume density of a dust grain of sizea. In terms of the Stokes number, the total radial dust velocity is
3r,d=
3r,g
1+St2 + 1 St−1+St
∂rP
ρgΩ
, (4)
withρg being the total gas surface density. The first term of
Eq. (4) depends on the radial gas velocity 3r,g, which in a disk
evolving by viscous accretion is 3r,g=−
3
Σ√r
∂ ∂r(Σν
√
r). (5)
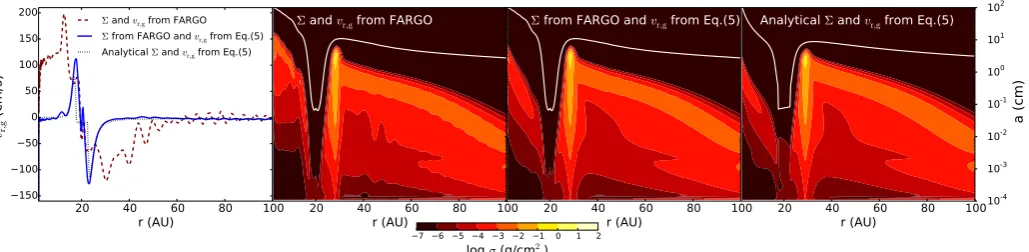
When the dust evolution models are combined with hydrody-namical simulations, the gas surface density and gas radial ve-locities can be directly taken as initial conditions for the dust evolution models, once the disk has reached a steady-state. Alternatively, the gas surface density can be based on the hydro-dynamical simulations and the gas radial velocity from Eq. (5) as inPinilla et al.(2012a). When a non-migrating planet is in the disk,Σis calculated with the analytical solution described in Sect.2.1and using thisΣ-profile, the gas radial velocities are calculated assuming Eq. (5). To see the potential differences of assuming the gas radial velocities from hydrodynamical simu-lations or viscous accretion, Fig.2compares the gas radial ve-locities obtained by hydrodynamical simulations using FARGO forq = 1×10⁻³, H/r = h0rf withh0 = 0.05 and f = 0.25,
andα=10−3(azimuthally averaged and averaging over the last
100 orbits of evolution i.e orbits 1000−1100), when3r,d is
cal-culated from viscous accretion (Eq. (5)) and assuming Σfrom
FARGO; and when the gas surface density is calculated
analyti-cally (Sect.2.1) and3r,dfrom Eq. (5). In addition the dust density
20 40 60 80 100 r (AU)
150 100 50 0 50 100 150 200
vr,g
(c
m
/s)
Σ and vr,g from FARGO Σ from FARGO and vr,g from Eq.(5) Analytical Σ and vr,g from Eq.(5)
20 40 60 80 100
r (AU)
Σ and vr,g from FARGO
20 40 60 80 100
r (AU)
Σ from FARGO and vr,g from Eq.(5)
20 40 60 80 100
r (AU) 10
-4
10-3
10-2
10-1
100
101
102
a (cm)
Analytical Σ and vr,g from Eq.(5)
7 6 5 4 3 2 1 0 1 2
[image:4.595.44.559.77.203.2]log σ (g/cm2)
Fig. 2.Left panel: comparison of the gas radial velocity obtained by hydrodynamical simulations usingFARGOforq=1×10⁻³,H/r=h 0rf with
h0 =0.05 and f =0.25, andα=10−3, when3r,d is calculated from viscous accretion (Eq. (5)), assumingΣby azimuthally averaging the gas
surface density fromFARGOsimulations, and when the gas surface density is calculated analytically (Sect.2.1) and3r,dfrom Eq. (5).Other panels:
dust density distribution at the same time of evolution (∼1 Myr) for the same assumptions. White line corresponds toSt =1 (Eq. (3)), which is proportional to the gas surface density.
proved the reliability of this analytical approach compared to the hydrodynamical simulations to obtain proper radial density distribution of dust particles.
2.3. Visibilities at mm-wavelenghts
To compare the results from the dust evolution models with mil-limetre observations, we calculate the real part of the visibilities in theuv-plane:VReal(ruv) is given by (Berger & Segransan 2007)
VReal(ruv)=2π
Z ∞
0
I(r)J0(2πruv)rdr, (6)
whereJ0is the zeroth-order Bessel function of the first kind and
I(r) is the radial-dependent emergent intensity, which is directly calculated using the vertically integrated dust density distribu-tionσ(r,a) from the dust evolution results at a specific time of evolution. Thus, σ(r,a) is different at each location for all the dust particle sizes (180 species) assumed in this work. For a given wavelength (λ), the intensity is given by,
I(r)=Bλ(T(r))h1−exp−τλ(r)i, (7) withBλ(T(r)) being the Planck function at the temperatureT(r) andτλthe optical depth, which is computed as
τλ=σ(r,a)κλ
cosi , (8)
where the opacities at a particular wavelength κλ are calcu-lated for each grain size, assuming Mie theory and a mix of magnesium-iron silicates (e.g.Dorschner et al. 1995). The op-tical constants are taken from the Jena database2.
2.4. Set-up
We assume the disk mass to be 0.05 M, consistent with the dust mass from Mulders et al.(2013), and a canonical dust-to-gas mass ratio of 100; however, disk masses are very uncer-tain. From optically thin mm emission, the disk mass can be estimated assuming dust opacities and a dust-to-gas mass ratio (e.g.Andrews & Williams 2005). Nonetheless, this calculation
2 http://www.astro.uni-jena.de/Laboratory/Database/
databases.html, with a specific silicate composition of: 10% MgFeSiO4, 28% MgSiO3, 31% Mg2SiO4, 1% NaAlSi2O6.
is unreliable since the dust opacity depends on composition and shape of the dust (e.g.Min 2005;Demyk et al. 2013), and the gas and dust are not necessarily co-spatial (e.g.Birnstiel & Andrews 2014). The gas mass can also be calculated from observations of CO and its isotopologues (e.g.Williams & Best 2014); how-ever, this estimation can depend on the chemical disk evolution, such as isotope selective processes (Miotello et al. 2014). The disk mass assumed for HD 100546 is broadly consistent with the mass estimate from e.g.Henning et al.(1998), but it remains a very uncertain parameter and thus we keep it fixed in this work. We fix the gas disk extent to [2−400] AU, in agreement with the COJ =3−2 emission fromWalsh et al.(2014). The initial gas surface density is a power law, such thatΣ(r)= Σ0(r/rp1)−1.
We use a temperature profile specific for HD 100546 and de-rived byBruderer et al.(2012), who constrained the gas temper-ature via detailed modelling of the observed low-J CO line emis-sion from single dish observations with the Atacama Pathfinder Experiment (APEX;Pani´c et al. 2010), mid/high-J CO lines ob-served withHerschel-PACS (Sturm et al. 2010), and continuum emission. For the dust evolution models, we impose the dust temperature as the gas temperature in the midplane, whereTgas'
Tdust(with values ofT20 AU'100 K,T400 AU'25 K). This
tem-perature is an upper limit, since it is obtained from observations of the warm gas in the disk atmosphere. However, CO chan-nel maps from ALMA observations (Walsh et al. 2014) do not show the double lobe signature, which indicates the presence of a CO freeze-out zone (see e.g.de Gregorio-Monsalvo et al. 2013). Hence, HD 100546 is a warm disk (Tmidplane>∼20−25 K
everywhere). Thus, we do not expect that the disk temperature considerably differs from the adopted temperature. This tem-perature is used for the dust evolution models and assumed to be the temperature of the vertically integrated dust density dis-tribution for the calculation of the intensity and visibilities at mm-wavelengths, which are mostly sensitive to the distribution of large grains. Because large (mm-sized) grains efficiently set-tle towards the midplane, the surface density of large grains in the disk atmosphere (where the temperature is higher) is neg-ligible (Dullemond & Dominik 2005). Therefore, adopting the midplane temperature only in the calculation of the emergent continuum emission is an appropriate assumption.
Based on that temperature, the aspect ratio is calculated as cs/vK = H/r = h0rf, obtainingh0 = 0.045 and f = 0.33 at
Table 1.Stellar, disk, and planets parameters.
Parameter Symbol/units Value Stellar mass M?[M] 2.4
Disk mass Mdisk[M] 0.05 Inner disk radius rin[AU] 2.0
Outer disk radius rout[AU] 400
Viscosity α [2×10−3,5×10−3]
Inner planet mass Mp1[MJup] [1,5,10,20,30]
Outer planet mass Mp2[MJup] [5,10,15,20]
Inner planet position rp1[AU] ∼10
Outer planet position rp2[AU] ∼70
Distance to the disk d[pc] 103 Disk inclination i[◦
] 45
Fragmentation velocity 3f[m s−1] 10 Volume density of dust ρs[g cm−3] 1.2
withα=[2×10−3,5×10−3] as inMulders et al.(2013). For the
visibilities, the disk is taken to be at a distance of 103 pc with an inclination (i) of 45◦(van den Ancker et al. 1997), and a position angle (PA) of 146◦(east from north).
We assume a large range of planet masses according to previous studies (Acke & van den Ancker 2006; Tatulli et al. 2011; Mulders et al. 2013; Quanz et al. 2013; Currie et al. 2014). For an inner companion located rp1 ∼ 10 AU, we
as-sume the planet-stellar mass ratio to be ∼[4.2 ×10−4,2.1 ×
10−3,4.2×10−3,8.3×10−3,1.3×10−2], which corresponds to Mp1 = [1,5,10,20,30] MJupplanets around a 2.4 Mstar. For
the outer planet located at rp2 ∼ 70 AU, we consider Mp2 =
[5,10,15,20]MJup.
Finally, for the dust evolution models, we assume that the velocity threshold above which particles fragment, the so-called fragmentation velocity, is 3f = 10 m s−1. For the initial dust
density distribution, we assume all particles to be 1 µm-sized. The dust particles are considered to have a volume density of
ρs=1.2 g cm−3, according to the averaged values of the volume
density for silicates (e.g.Blum & Wurm 2008). All parameters are summarised in Table1.
3. Results
In this section, we present the results for the case of no planet, and for the cases where either one or two planets are embedded in the disk. For the latter case, we consider the two scenarios where the second (outer) planet is injected either at the same time as the inner planet, or at a later time.
For the models where the planets are injected at later times, we do not assume an actual model to introduce the planet and let it grow. Our main aim is to study the final dust density dis-tributions assuming that the planets are already formed and em-bedded in the disk. Massive planets such as those assumed in this work are expected to have slow Type II migration, in which case migration timescales follow the viscous diffusion time of the gas, as do the pressure bumps and the dust. Thus, potential dust traps are likely to follow the migration of the planets, keep-ing qualitatively similar results.
3.1. No planets in the disk
Figure3illustrates the dust density distribution at different times of evolution, and the corresponding real part of the visibilities at 870µm, when no planet is embedded in the disk. Moreover, ALMA Cycle 0 data at this wavelength are also plotted for
10
-410
-310
-210
10
-1 010
110
2a (cm)
t = 0.1 Myr
t = 1.0 Myr
10
110
2r (AU)
10
-410
-310
-210
10
-1 010
110
2a (cm)
t = 3.0 Myr
10
110
2r (AU)
t = 5.0 Myr
a
drifta
frag7 6 5 4 3 2 1 0 1 2
log
σ
(g/cm
2)
0
50 100 150 200 250 300 350 400 450
Deprojected baseline (k
λ
)
0.2
0.0
0.2
0.4
0.6
0.8
1.0
1.2
Real (Jy)
•
ALMA-Cycle 0 data
Intensity at 870
µm
No planet
[image:5.595.57.273.98.246.2]1Myr
2Myr
3Myr
5Myr
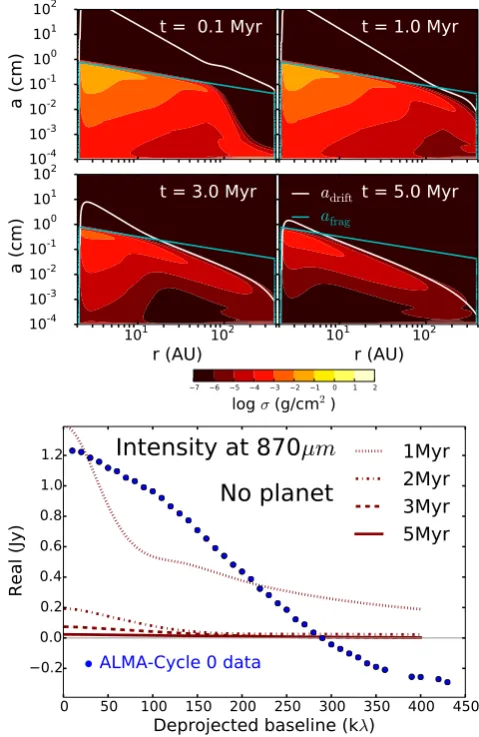
Fig. 3. Dust density distribution at different times of evolution ( up-per panel) and real part of the visibilities at 870µm (bottom panel) at different times of dust evolution, when no planet is embedded in the disk. ALMA Cycle 0 data at this wavelength are over-plotted (data from Walsh et al. 2014). In theupper panel, the white and blue line corre-spond toadrift(Eq. (10)), andafrag(Eq. (9)), respectively.
comparison. Note that the errors are also plotted and they are smaller than the point size (because of the very high signal-to-noise ratio of the ALMA data, Walsh et al. 2014). For this sim-ulationα=2×10⁻³is assumed. At early times (t<
∼ 1 Myr), the dust particles grow to the maximum grain size before particles fragment. When fragmentation is mainly because of turbulent relative velocities,afragis (Birnstiel et al. 2012),
afrag=
2 3π
Σ
ρsα
32
f
c2s
· (9)
At later times, the dust surface density decreases, so the drift barrier moves to smaller sizes and possibly below the fragmen-tation size (Eq. (9)). In such cases,adriftis (Birnstiel et al. 2012)
adrift=
2Σd πρs
v2
K
c2 s
d lnP d lnr −1
· (10)
10-4
10-3
10-2
10-1
100
101
102
a (cm)
1
M
Jupα
=2
.
0
×10
−3Dust distribution at t = 1.5 Myr St =1
afrag
0.2 0.0 0.2 0.4 0.6 0.8 1.0 1.2
Real (Jy)
1
M
JupIntensity at 870µm
1.0Myr
1.5Myr
2.0Myr
10-4
10-3
10-2
10-1
100
101
102
a (cm)
5
M
Jup0.2 0.0 0.2 0.4 0.6 0.8 1.0 1.2
Real (Jy)
5
M
Jup101 102
r (AU)
10-4
10-3
10-2
10-1
100
101
102
a (cm)
10
M
Jup0 50 100 150 200 250 300 350 400 450
Deprojected baseline (kλ)
0.2 0.0 0.2 0.4 0.6 0.8 1.0 1.2
Real (Jy)
• ALMA-Cycle 0 data
10
M
Jup7 6 5 4 3 2 1 0 1 2
log σ (g/cm2)
10-4
10-3
10-2
10-1
100
101
102
a (cm)
1
M
Jupα
=5
.
0
×10
−3Dust distribution at t = 1.5 Myr St =1
afrag
0.2 0.0 0.2 0.4 0.6 0.8 1.0 1.2
Real (Jy)
1
M
JupIntensity at 870µm
1.0Myr
1.5Myr
2.0Myr
10-4
10-3
10-2
10-1
100
101
102
a (cm)
5
M
Jup0.2 0.0 0.2 0.4 0.6 0.8 1.0 1.2
Real (Jy)
5
M
Jup101 102
r (AU)
10-4
10-3
10-2
10-1
100
101
102
a (cm)
10
M
Jup0 50 100 150 200 250 300 350 400 450
Deprojected baseline (kλ)
0.2 0.0 0.2 0.4 0.6 0.8 1.0 1.2
Real (Jy)
• ALMA-Cycle 0 data
10
M
Jup7 6 5 4 3 2 1 0 1 2
[image:6.595.48.548.83.356.2]log σ (g/cm2)
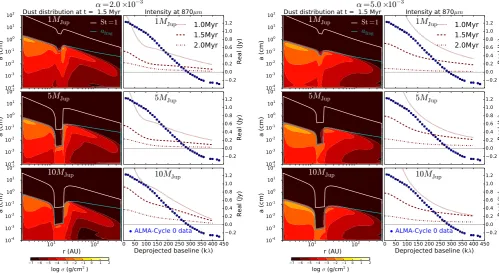
Fig. 4.Dust density distribution after 1.5 Myr of evolution and real part of the visibilities at 870µm at different times of dust evolution, when a single planet interacts with the disk for two different values of disk viscosity,α=2×10⁻³(left column) andα=5×10⁻³(right column).From
top to bottom, the masses of the planet are: 1, 5, and 10MJup. ALMA Cycle 0 data are over-plotted in Fig.3. In the dust density distribution plots,
the white and blue lines correspond toSt=1 (Eq. (3)), andafrag(Eq. (9)) respectively.
Once the particles grow to sizes for which radial drift dominates (t>∼ 1 Myr), the disk is quickly depleted of millimetre dust par-ticles. This is reflected in the profile of the real part of the visi-bilities where the flux at 870µm drastically reduces after 1 Myr of evolution, becoming already very low at 2 Myr.
As a consequence, any mechanism that helps to reduce the rapid inward drift is needed to explain the millimetre emis-sion of this disk. We assume that a pressure trap is formed at the outer edge of a gap carved by a massive planet, motivated also by the companion candidates suggest in the literature (e.g. Acke & van den Ancker 2006;Tatulli et al. 2011;Brittain et al. 2014). Particles concentrate in the regions of highest pressure (e.g. Weidenschilling 1977; Brauer et al. 2008), and therefore the assumed pressure bump can help to reduce the radial drift.
3.2. A planet is embedded in the inner disk
Assuming the analytical profiles for gaps carved by massive planets described in Sect. 2.1, we consider an inner planet of different massesMp1 =[1,5,10,20,30]MJupatrp1 ∼10 AU to
investigate the trapping efficiency and the comparison with ob-servations. Since we neglect the possible effect of an eccentric gap in our simulations, we give an approximated value for the location of the planets (Sect2.1).
Figure4shows the dust density distribution after 1 Myr of evolution, and the corresponding real part of the visibilities at 870 µm forα = [2×10−3,5×10−3], when a 1, 5 or 10 MJup
planet is embedded in the inner part of the disk. The results of these simulations suggest that a planet whose mass is lower than 10MJupis not massive enough to result in trapping of
millimetre-sized dust particles, sufficient to create a visibility curve that is
in agreement with ALMA Cycle 0 observations. In any of these cases, the flux is already under-predicted after 1.5 Myr of evolu-tion.Pinilla et al.(2012a) show that when a planet ofq=10−3,
i.e. a 1 MJuparound a solar-type star, carves a gap in the disk,
particles can be trapped at the outer edge whenα = 10−3. The reason why trapping is more difficult in this case is because of the larger difference between the maximum grain size or afrag
(Eq. (9)), and the particle size in which dust feels the highest ra-dial drift i.e.St=1. Particles withSt∼1 are the easiest to trap, howeverafragis in this case around one order of magnitude lower
than the grain size that corresponds toSt=1. These smaller par-ticles are more difficult to trap because the drift is inefficient for particles withSt<∼α. For these models, the maximum grain size is lower because of the higher temperatures andα-viscosity con-sidered here compared with those inPinilla et al.(2012a). The visibility shape does not change significantly for the two values of the viscosity. For this reason, for the following results, we only focus on the cases with α = 2×10⁻³. Increasingα
de-creases the maximum grain size even further (Eq. (9)), making the particle trapping more difficult. Assuming a lower viscosity or a higher fragmentation velocity can help to trap the particles (Pinilla et al. 2015).
When the mass of the inner planet is increased, the trapping becomes more efficient. Figure5shows the dust density distribu-tion at different times of evolution and the real part of visibilities atλ=[0.87,1.0,3.0,7.0] mm, when a 20 and 30MJupplanet is
embedded in the inner part of the disk. ALMA Cycle 0 data from Walsh et al.(2014) and ATCA data fromWright et al.(2014) are over-plotted for comparison. For the case of a 20 MJup planet,
10
-410
-310
-210
10
-1 010
110
2a (cm)
0.1 Myr
20
M
Jup
and
α
=2
.
0
×
10
−
3
St =1
a
frag1.0 Myr
10
110
2r (AU)
10
-410
-310
-210
10
-1 010
110
2a (cm)
5.0 Myr
10
110
2r (AU)
10.0 Myr
7 6 5 4 3 2 1 0 1 2
log
σ
(g/cm
2)
10
-410
-310
-210
10
-1 010
110
2a (cm)
0.1 Myr
30
M
Jup
and
α
=2
.
0
×
10
−
3
St =1
a
frag1.0 Myr
10
110
2r (AU)
10
-410
-310
-210
10
-1 010
110
2a (cm)
5.0 Myr
10
110
2r (AU)
10.0 Myr
7 6 5 4 3 2 1 0 1 2
log
σ
(g/cm
2)
0 100 200 300 400 0.2
0.00.2 0.4 0.6 0.81.0 1.2
Real (Jy)
•
ALMA-Cycle 0
870
µm
•
ALMA-Cycle 0
870
µm
0 100 200 300 400 0.2
0.0 0.2 0.4 0.6 0.8 1.0 1.2
•
ALMA-Cycle 0
1mm
•
ALMA-Cycle 0
1mm
0.1Myr
1.0Myr
5.0Myr
10Myr
0 100 200 300 400
Deprojected baseline (kλ)
0.02 0.01 0.00 0.01 0.02 0.03 0.04 0.05 0.06
Real (Jy)
ATCA
3mm
ATCA
3mm
0 200 400 600 800 1000
Deprojected baseline (kλ)
0.002 0.000 0.002 0.004 0.006 0.008
ATCA
7mm
ATCA
7mm
0 100 200 300 4000.2 0.0 0.2 0.4 0.6 0.8 1.0 1.2
Real (Jy)
•
ALMA-Cycle 0
870
µm
0 100 200 300 400 0.2
0.00.2 0.4 0.6 0.81.0 1.2
•
ALMA-Cycle 0
1mm
0.1Myr
1.0Myr
5.0Myr
10Myr
0 100 200 300 400
Deprojected baseline (kλ)
0.030.02 0.01 0.00 0.01 0.02 0.03 0.04 0.05 0.06
Real (Jy)
ATCA
3mm
0 200 400 600 800 1000
Deprojected baseline (kλ)
0.002 0.000 0.002 0.004 0.006 0.008
ATCA
[image:7.595.50.546.79.459.2]7mm
Fig. 5. Dust density distribution at different times of evolution (upper row) and the corresponding real part of the visibilities at λ = [0.87,1.0,3.0,7.0] mm (lower row) at different times of dust evolution, when a 20MJupplanet (left column) and 30MJup planet (right column)
is embedded in the inner disk. Data from ALMA Cycle 0 fromWalsh et al.(2014) and ATCA fromWright et al.(2014) are over-plotted. In the
upper panels, the white and blue line correspond toSt=1 (Eq. (3)), andafrag(Eq. (9)) respectively.
(>∼5 Myr) to grow, drift, and concentrate the millimetre grains in a narrow ring. Already at 5 Myr, most of the millimetre particles are concentrated in a narrow region; however, the large amount of these grains leads to a over-prediction of the fluxes. The con-tinuous fragmentation that occurs in the pressure bump, together with some small-sized dust crossing the gap, reduce the amount of millimetre grains, enabling a better fit to the data at 10 Myr. The total flux is under-predicted at 7 mm because the maximum grain size in the trap is around 1mm. The null of the visibilities at∼290 kλis in good agreement with the observations, imply-ing that a 20MJupplanet located in the inner part of the disk, can
create a pressure maximum at∼26 AU, where the centre of the inner narrow ring was observed with ALMA Cycle 0.
If the planet is located at the same location, and its mass is increased to 30MJup, the resulting carved gap is wider, moving
the location of the pressure maximum outwards and therefore the peak of the millimetre emission. For this reason, the null of the visibilities is at shorter baselines (∼245 kλ, Fig.5). In addition, the total flux is higher because the gap is also deeper, filtering more dust, and as a result, a larger number of millimetre particles remain in the trap. However, the fluxes at 7 mm are lower than in the case of a 20MJupplanet. This is because the maximum grain
size has decreased slightly in the trap as the pressure maximum is further away, where the gas surface density is also lower, de-creasingafrag(Eq. (9)) within the bumps. An important remark is
that at 7 mm the emission likely has a>∼10% contamination from free-free emission (Wright et al. 2014), which is neglected in our calculations. Hence, we expect the models to underestimate the 7 mm flux.
From the simulations with one single planet in the inner disk, the best model that reproduces the observations at different wavelength is for a 20MJupplanet andα=2×10⁻³, consistent
with the results fromMulders et al.(2013), who found similar results from modelling mid-infrared data. For these parameters, the best fit is for an old disk (∼5−10 Myr). Nevertheless, with one single planet, the outer ring of mm emission observed with ALMA remains unexplained (Walsh et al. 2014) .
3.3. Two planets are embedded in the disk
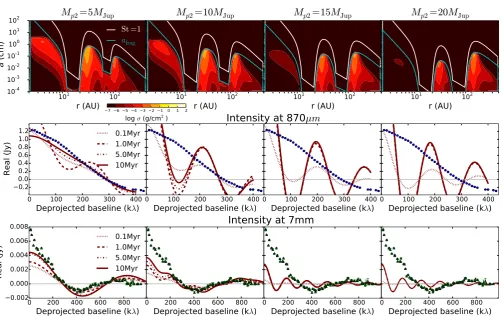
Fig. 6.Upper panels: dust density distribution at 1.5 Myr of evolution when two planets are injected in the disk simultaneously. The mass of the inner planet is 20MJupand it is located atrp1∼10−15 AU, while the outer planet atrp2>∼70 AU is assumed to beMp2=[5,10,15,20]MJupfrom
left to right panelsrespectively. The white line isSt=1, and the blue line isafrag. The corresponding real part of the visibilities for eachMp2at
λ=0.87 mm (middle panels) andλ=7.0 mm (lower panels) are displayed for different times of dust evolution, for eachMp2. ALMA Cycle 0
and ATCA data are over-plotted for comparison.
embedded in the inner disk, we consider the best single-planet fit of Mp1 = 20MJup, and a disk viscosity ofα = 2 × 10⁻³.
For the outer planet, it is assumed Mp2 = [5,10,15,20] MJup
andrp2 ∼70 AU. There are two sets of simulations: one where
the two planets are assumed to interact with the disk from the same stage of evolution, and a second, where the outer planet is assumed to interact with the disk from a later stage.
3.3.1. Simultaneous injection of both planets
Figure 6 illustrates the dust density distribution at 1.5 Myr of evolution when two planets are interacting in the disk from the same stage of evolution (t ∼ 1000 yr). The inner planet is a 20 MJup planet at rp1 ∼ 10 AU, while the outer planet at
rp2 ∼ 70 AU is assumed to be Mp2 = [5,10,15,20] MJup. In
addition, the real part of the visibilities atλ=[0.87,7.0] mm are displayed for eachMp2, and at different times of dust evolution.
When a second planet is assumed, the gas surface density sharply decreases with radius in the region between the two planets. As a consequence of the high negative pressure gradient, the dust par-ticles move quickly inward (timescales shorter than∼1 Myr) and stop their migration in the pressure maximum at the outer edge on the inner gap. This effect creates a narrow ring-like concen-tration of large particles centred at∼26 AU in shorter timescales than in the case of a single inner planet.
In this case, a second trap also exists at the outer edge of the gap carved by the planet at rp2 ∼ 70 AU. The amount of
dust concentrated in this second trap depends on the mass of the outer planet. When the planet is more massive, dust filtration becomes more effective and the millimetre flux increases. This has a significant influence on the resulting real part of the visi-bilities. Because of the dust trapping in both pressure maxima, the visibility profiles show strong oscillations. For the case of Mp2 = 5 MJup, these oscillations are smoothed out late in the
evolution (∼10 Myr) because of the continued crossing of dust particles through the outer gap, which is filling the inner trap (middle and bottom left panels of Fig.6). In this case, there is a similar contrast of the inner to the outer ring emission as that observed with ALMA Cycle 0 (of the order of∼100), generat-ing similar visibility profiles to those observed. Nevertheless, for the case of a higher mass planet (Mp2 >∼ 10MJup), the amount
of dust concentrated in both traps is similar, and the undulating shape is more extreme and persists at late times, in contradic-tion to observacontradic-tions. The total flux atλ = 0.87 mm is slightly lower than in the case of the 20 MJup single planet; however,
these fluxes can be higher if the disk mass or dust-to-gas ratio are assumed to be higher, or they can change by assuming dif-ferent dust composition (Min 2005). We keep these two values the same for all the simulations to have a clear distinction of the effect of the planet parameters on the final dust distributions.
From these two-planets simulations, in which both planets are considered to interact with the disk from early in the disk lifetime, we conclude that the outer planet should be a low-mass planet (<∼5MJup) compared to the inner planet (20MJup), and the
10
110
2r (AU)
10
-410
-310
-210
-110
010
110
2a (cm)
t = 2.5 Myr
20
M
Jupat
∼10
AU and 15
M
Jupat
∼70AU
7 6 5 4 3 2 1 0 1 2
log σ (g/cm2)
10
110
2r (AU)
10
-410
-310
-210
-110
010
110
2a (cm)
t = 2.5 Myr
20
M
Jupat
∼10
AU and 20
M
Jupat
∼70AU
7 6 5 4 3 2 1 0 1 2
log σ (g/cm2)
0 100 200 300 400 0.2
0.0 0.2 0.4 0.6 0.8 1.0 1.2
Real (Jy)
870
µm
0 100 200 300 400 0.2
0.0 0.2 0.4 0.6 0.8 1.0
1.2
1mm
2.0Myr2.5Myr 5.0Myr 10Myr
0 100 200 300 400
Deprojected baseline (k
λ
)
0.02 0.01 0.00 0.01 0.02 0.03 0.040.05 0.06
Real (Jy)
3mm
0 200 400 600 800 1000
Deprojected baseline (k
λ
)
0.002 0.000 0.002 0.004 0.006 0.008
7mm
15MJup
at 70AU
injected after 2Myr
0 100 200 300 400 0.2
0.0 0.2 0.4 0.6 0.8 1.0 1.2
Real (Jy)
870
µm
0 100 200 300 400 0.2
0.0 0.2 0.4 0.6 0.8 1.0
1.2
1mm
2.0Myr2.5Myr 5.0Myr 10Myr
0 100 200 300 400
Deprojected baseline (k
λ
)
0.02 0.01 0.00 0.01 0.02 0.03 0.04 0.05 0.06
Real (Jy)
3mm
0 200 400 600 800 1000
Deprojected baseline (k
λ
)
0.002 0.000 0.002 0.004 0.006 0.008
7mm
20MJup
at 70AU
[image:9.595.68.529.71.414.2]injected after 2Myr
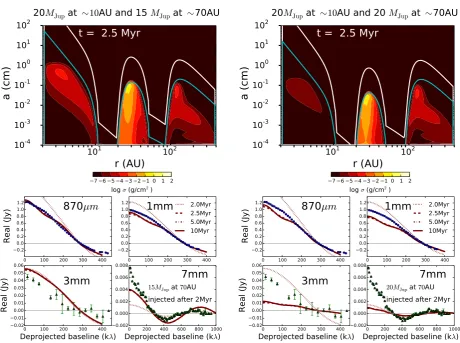
Fig. 7.Upper panels: dust density distribution at 2.5 Myr of evolution when a 20MJupplanet is embedded in the inner disk (10−15 AU) and a
second planet (15MJupleft panels, 20MJupright panels) is injected in the outer region (rp2>∼70 AU) after 2 Myr of dust evolution. The white line
isSt =1, and the blue line isafrag.Bottom panels: real part of the visibilities atλ=[0.87,1.0,3.0,7.0] mm at different times of dust evolution;
ALMA Cycle 0 and ATCA data are over-plotted for comparison.
3.3.2. Later injection of the outer planet
High-contrast imaging of this disk with VLT/NACO shows sig-natures of a massive planet (∼15−20MJup) in the outer region
at∼70 AU (Quanz et al. 2013;Currie et al. 2014). However, in the previous section we showed that if the planet in the outer disk is as old as the one in the inner disk, the resulting visibility profiles are in disagreement with observations. To have a very massive planet in the outer disk and similar millimetre emission contrast between the inner and the outer ring (∼100), the outer planetmustbe younger than the inner planet. In this scenario, at the time that the outer planet is injected in the disk, most of the dust has already moved towards the inner trap, decreasing the mass of dust available for trapping in the second pressure bump. Figure7 shows the dust density distribution at 2.5 Myr of evolution when a 20MJupplanet is embedded in the inner disk,
and a second planet (Mp2 =[15,20]MJup) is injected in the outer
region (rp2 ∼70 AU) after 2 Myr of dust evolution. In
compar-ison with the corresponding cases of Fig. 6, it is important to notice that the outer ring is fainter in this case than when the two planets are assumed to interact with the disk over the same timescale. The oscillations on the visibility profiles are much smoother in these cases, and better fit the total flux. The null in the visibility profiles remains similar as in the single planet case (∼290 kλ). A 15MJupouter planet fits the visibility shapes
better and total fluxes than a 20 MJupplanet, in agreement with
the Gemini/NICI observations reported byCurrie et al.(2014),
who constrain the mass of the outer planet to be at most 15MJup.
The real part of the visibilities still have smooth oscillations; however, this can be further smoothed out by assuming than the planet is injected even later in the simulations. Figure8displays the case of a 20 MJup planet embedded in the inner disk from
early stages, and an outer 15MJupplanet injected after 3 Myr
of dust evolution. To reproduce the observations, the lower the mass of the planet, the earlier it needs to be introduced into the outer disk. Therefore, assuming the mass predicted by Quanz et al.(2013,2015) andCurrie et al.(2014) for the outer planet (and its possible circumplanetary disk), implies that this planet must beat least>∼2−3 Myr younger than the planet in the inner disk.
4. Discussion
We have shown that radial drift alone cannot reproduce the dust distribution observed for HD 100546 (Sect.3.1). To obtain good agreement between the dust evolution models, which include radial drift, with the millimetre observations, an inner pressure bumpmustexist since early in the disk lifetime (<0.1 Myr).
0 100 200 300 400 0.2
0.0 0.2 0.4 0.6 0.8 1.0 1.2
Real (Jy)
870
µm
0 100 200 300 400 0.2
0.0 0.2 0.4 0.6 0.8 1.0
1.2
1mm
3.0Myr3.5Myr 5.0Myr 10Myr
0 100 200 300 400
Deprojected baseline (k
λ
)
0.02 0.01 0.000.01 0.02 0.03 0.040.05 0.06
Real (Jy)
3mm
0 200 400 600 800 1000
Deprojected baseline (k
λ
)
0.002 0.000 0.002 0.004 0.006 0.008
7mm
15MJup
at
70AU
[image:10.595.48.280.75.232.2]injected after 3Myr
Fig. 8. Real part of the visibilities atλ = [0.87,1.0,3.0,7.0] mm at different times of dust evolution when a 20 MJup planet is embedded
in the inner disk (10−15 AU) from early stages, and a second planet (15MJup) is injected after 3 Myr of dust evolution. ALMA Cycle 0 and
ATCA data are over-plotted for comparison.
(∼20MJup) for a disk viscosity ofα=2×10⁻³. This in
agree-ment withMulders et al.(2013) results, but is derived from dif-ferent observations (Sect3.2). The trapping in HD 100546 disk is difficult because of the high disk temperature (as derived in Bruderer et al. 2012) and disk viscosity, which both increase the relative motion of the particles due to turbulence, and decrease the maximum grain size that particles can reach under these as-sumptions. This maximum grain size is one order of magnitude lower than the size corresponding toS t=1, which are the parti-cles that feel the highest radial drift and are the easiest to trap in a pressure bump. Assuming a higher viscosity would make the trapping even more difficult and a more massive inner planet, lo-cated closer to the star, would be needed to explain the millime-tre emission. In the case of a single planet embedded in the inner part of the disk, the disk is more likely to be old (∼5−10 Myr).
In addition to the inner planet, we also assumed an outer planet as suggested by various authors e.g. Boccaletti et al. (2013) and Quanz et al.(2013). When the two planets are as-sumed to interact with the disk from the same stage of evolu-tion, we demonstrated that the mass of the outer planet needs to be lower than the inner planet (<∼5 MJup), otherwise the
re-sulting dust density distributions are in disagreement with mil-limetre observations. This is because, if a second massive planet is coeval with the inner planet, it traps inward drifting grains too effectively in the outer bump, and the contrast ratio between the bumps becomes too strong compared with observations. However, the mass suggested by various authors for the outer planet is higher than 5 MJup. As in the single planet case, the
models are more consistent with observations when the disk is old (∼5−10 Myr). To test how sensitive the resulting timescales are to the assumed gas surface density profile, we considered the best-fit single planet model and adopted an exponentially ta-pered disk rather than a power law. For this case, mm-grains are concentrated in a much narrower ring, shifting the null of the vis-ibilities to longer baselines, in disagreement with observations. In addition, at very early times, there is an oscillating behaviour (similar to the previous two-planet simulations). Hence, with this gas surface density profile, stronger oscillating behaviour is ex-pected for the visibilities for the case of two planets. Thus, a power law for the gas surface density gives us a better fit to the observations.
0
50 100 150 200 250 300 350 400 450
Deprojected baseline (k
λ
)
0.2
0.0
0.2
0.4
0.6
0.8
1.0
1.2
Real (Jy)
Intensity at 870
µm
[image:10.595.313.551.76.235.2]Case 1: no planet
Case 2: single planet
Case 3: 2 planets (sim)
Case 4: 2 planets (delayed)
Fig. 9.Real part of the visibilities at 870µm. Case 1: no planet embed-ded in the disk andt=2 Myr. Case 2: a single planet embedded in the disk of 20MJupmass at∼10 AU andt=10 Myr. Case 3: two planets
simultaneously interacting with the disk, 20MJupat∼10 AU and 5MJup
at∼70 AU, andt=10 Myr. Case 4: two planets in the disk, but the outer planet is injectedt=3 Myr after the inner planet, 20MJup at∼10 AU
and 15MJupat∼70 AU, andt=3.5 Myr. ALMA Cycle 0 is over-plotted
for comparison.
If the mass of the outer planet is assumed to be large, as sug-gested byQuanz et al.(2013) (∼15MJup), we demonstrated that
the outer planet must be at least∼2−3 Myr younger than the inner planet, favouring a significantly younger outer planet ob-served in the act of formation. In this case, the disk can be much younger than when the disk only hosts a single planet. The re-quired time to be in agreement with observations is a few tenths of a Myr after the outer planet is injected. Figure9summarises our main findings and compares the cases of no planet, a sin-gle planet, two planets injected simultaneously, and two planets where the outer planet is injected after 3 Myr of evolution. One of the uncertainties of these predictions is the disk midplane tem-perature, which may be slightly lower than obtained byBruderer et al.(2012) (Sect.2.4). The temperature profile used is an up-per limit; however, ALMA Cycle 0 COJ = 3−2 observations show no signs of CO freeze-out, i.e. we also have a lower limit of∼20 K. A slightly lower midplane temperature decreases the dust drift velocities (Eq. (4)), and increase the maximum grain size (Eqs. (10) and (9)). Observations with higher angular res-olution and sensitivity of optically thin emission from multiple transitions of CO isotopologues are needed to give better con-straints on the disk midplane temperature and confirm the cur-rent predictions. However, we expect that the overall trends re-main similar with a slight lowering of the dust temperature.
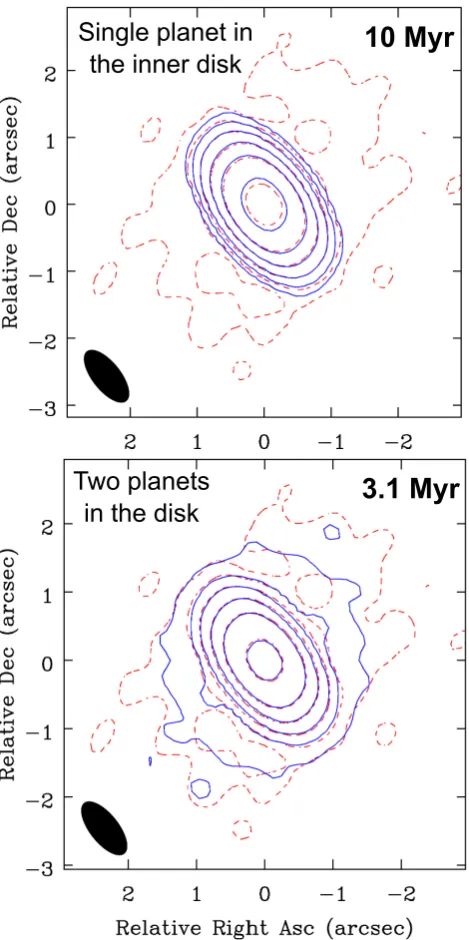
Moreover, Fig.10shows the synthetic ALMA Cycle 0 con-tour lines image at 870µm (imaged using identical (u,v) coor-dinates as the ALMA observations), for the cases of one single planet and an old disk, and two massive planets and a younger disk. The latter scenario reproduces a more extended emission than with a single planet, but it is not as extended as observed. This discrepancy is because the width of the carved gaps (thus the location of the pressure maximum at the outer edge of the gap) is underestimated in our models compared to proper hy-drodynamical simulations (Sect.2.1). The location of the pres-sure maximum of a gap carved by a 15 MJup planet at 70 AU
is expected to be∼190 AU i.e. at 9−10rH from the planet
Single planet in
the inner disk
Two planets
in the disk
10 Myr
[image:11.595.49.284.76.547.2]3.1 Myr
Fig. 10. ALMA Cycle 0 continuum contours at 870µm (red dashed lines) and the contours corresponding to the models (blue solid lines) when an inner 20MJupplanet alone (top panel) is embedded in the disk,
and with two planets in the disk (bottom panel), where the outer planet is injected after 3 Myr of evolution. Contours are every 3, 10, 30, 100, 300, and 1000 times the rms (0.5 mJy beam−1).
showing that with high angular resolution observations, two rings can be resolved in the two-planet scenario.
The age of HD 100546 itself is very uncertain (∼3−10 Myr Acke & van den Ancker 2006) and a more precise measurement of the age of this star can give us hints as to the nature of the potential planets embedded in this disk. An observation to ul-timately test dust trapping in two pressure bumps, would be to measure spectral index variations inside and outside these pres-sure maxima locations (Pinilla et al. 2014), which are testable with future ALMA capabilities. Figure 12shows the expected radial variations of the spectral index, calculated between 1 and 3 mm, when a single inner planet of 20 MJupmass is embedded
in the inner disk at∼10 AU, and when two planets are in the disk,
2 1 0 1 2
Relative Right Asc (arc)
2 1 0 1 2
Relative Dec (arc)
Single planet
2 1 0 1 2
Relative Right Asc (arc)
Two planets
4.5 4.0 3.5 3.0 2.5 2.0 1.5 1.0 0.5
[image:11.595.310.553.76.232.2]log10
(
F870µm) (Jy/beam)
Fig. 11. Synthetic images at 870µm convolved with a 0.100 × 0.100 beam from the models of a single planet (20MJupat∼10 AU) and two
planets (20MJup at∼10 AU and 15MJup at∼70 AU), injected 3 Myr
after the inner planet.
10
110
2r (AU)
1.5
2.0
2.5
3.0
3.5
4.0
4.5
5.0
5.5
6.0
sp
ec
tra
l in
de
x (
α
1−3m
m
)
Inner
planet
Outer
planet
Single planet Two planets
Fig. 12.Radial variations of the spectral index, calculated between 1 and 3 mm, when a single inner planet of 20MJup mass is embedded
in the disks and when two planets are in the disk, but the outer planet (15MJup) is injected 3 Myr after the inner planet (20MJup). The vertical
lines correspond to the positions of the pressure maxima at the outer edge of the gap(s) carved by the planet(s).
but the outer planet (15 MJup) is injected 3 Myr after the inner
planet (20MJup). At the location of the pressure trap, the
spec-tral index is lower because of the accumulation of mm-grains and vice versa.
We also used ATCA observations to compare the visibility profiles at 3 and 7 mm with the models. The models with two planets predict slightly better the total flux, and estimate well the observed null of the real part of the visibilities at these wave-lengths. The null at 7 mm is at a moderately longerkλthan at shorter wavelengths. This happens because larger grains are ex-pected to be more concentrated. Nonetheless, for all cases, the total flux at 7 mm is under-predicted, which partially comes from the neglect of free-free emission in the models, and because of the small maximum grain size (∼1 mm) under the assumed tem-perature and disk viscosity in the outer disk.
5. Conclusion
[image:11.595.312.552.296.443.2]the inner disk (r ∼ 10 AU), the mass of the planet should be high (∼20MJup) for a disk viscosity ofα=2×10⁻³, in
agree-ment withMulders et al.(2013), who found similar results from modelling mid-infrared data. In the case in which this is the only planet embedded in the disk, the disk is more likely to be old (∼5−10 Myr). In this case the outer ring of emission observed with ALMA remains unexplained (Fig.10). If an outer planet is also embedded in the disk, and it is as massive as suggested by Quanz et al.(2013,2015) andCurrie et al.(2014) (∼15MJup),
this outer planet should be at least∼2−3 Myr younger than the inner planet, supporting the hypothesis that the outer planet may be in the act of formation. In this case, the models produce an outer ring of emission that is 100 times fainter than the inner ring of emission as observed with ALMA Cycle 0 (Fig.10). If the outer planet is embedded in the disk at the same time as the inner planet, inward drifting grains are efficiently trapped in the outer bump, and the contrast of the millimetre fluxes be-tween the two pressure traps becomes too strong compared with the observations. The ATCA observations at 3 and 7 mm also favour the two-planets scenario. Future high angular resolution and sensitivity observations of multiple transitions of optically thin emission from CO isotopologues, which can constrain better the disk gas surface density and temperature profiles, and con-tinuum images with ALMA will allow us to resolve potential rings (Fig. 11), to measure spectral index variations inside and outside pressure maxima locations (Fig.12), and to confirm par-ticle trapping by one or two planets in this disk.
Acknowledgements. The authors are very grateful to E. F. van Dishoeck and D. Harsono for all their comments and fruitful discussions. We thank to S. Bruderer for providing his data for the disk temperature and C. Wright for the ATCA data. P.P. is supported by Koninklijke Nederlandse Akademie van Wetenschappen (KNAW) professor prize to Ewine van Dishoeck. T.B. ac-knowledges support from NASA Origins of Solar Systems grant NNX12AJ04G. C.W. acknowledges support from the Netherlands Organisation for Scientific Research (NWO, grant number 639.041.335). Astrochemistry in Leiden is sup-ported by the Netherlands Research School for Astronomy (NOVA), by a Royal Netherlands Academy of Arts and Sciences (KNAW) professor prize, and by the European Union A-ERC grant 291141 CHEMPLAN. This paper makes use of the following ALMA data: ADS/JAO.ALMA#2011.0.00863.S. ALMA is a part-nership of ESO (representing its member states), NSF (USA) and NINS (Japan), together with NRC (Canada) and NSC and ASIAA (Taiwan), in cooperation with the Republic of Chile. The Joint ALMA Observatory is operated by ESO, AUI/NRAO and NAOJ.
References
Acke, B., & van den Ancker, M. E. 2006,A&A, 449, 267
Alexander, R. D., Clarke, C. J., & Pringle, J. E. 2006,MNRAS, 369, 229
Andrews, S. M., & Williams, J. P. 2005,ApJ, 631, 1134
Andrews, S. M., Wilner, D. J., Espaillat, C., et al. 2011,ApJ, 732, 42
Andrews, S. M., Wilner, D. J., Hughes, A. M., et al. 2012,ApJ, 744, 162
Ardila, D. R., Golimowski, D. A., Krist, J. E., et al. 2007,ApJ, 665, 512
Ataiee, S., Pinilla, P., Zsom, A., et al. 2013,A&A, 553, L3
Avenhaus, H., Quanz, S. P., Meyer, M. R., et al. 2014,ApJ, 790, 56
Berger, J. P., & Segransan, D. 2007,New Astron. Rev., 51, 576
Biller, B., Lacour, S., Juhász, A., et al. 2012,ApJ, 753, L38
Birnstiel, T., & Andrews, S. M. 2014,ApJ, 780, 153
Birnstiel, T., Dullemond, C. P., & Brauer, F. 2010,A&A, 513, A79
Birnstiel, T., Klahr, H., & Ercolano, B. 2012,A&A, 539, A148
Birnstiel, T., Dullemond, C. P., & Pinilla, P. 2013,A&A, 550, L8
Blum, J., & Wurm, G. 2008,ARA&A, 46, 21
Boccaletti, A., Pantin, E., Lagrange, A.-M., et al. 2013,A&A, 560, A20
Brauer, F., Dullemond, C. P., & Henning, T. 2008,A&A, 480, 859
Brittain, S. D., Carr, J. S., Najita, J. R., Quanz, S. P., & Meyer, M. R. 2014,ApJ, 791, 136
Brown, J. M., Blake, G. A., Qi, C., et al. 2009,ApJ, 704, 496
Bruderer, S., van Dishoeck, E. F., Doty, S. D., & Herczeg, G. J. 2012,A&A, 541, A91
Casassus, S., van der Plas, G., M, S. P., et al. 2013,Nature, 493, 191
Crida, A., Morbidelli, A., & Masset, F. 2006,Icarus, 181, 587
Currie, T., Muto, T., Kudo, T., et al. 2014,ApJ, 796, L30
de Juan Ovelar, M., Min, M., Dominik, C., et al. 2013,A&A, 560, A111
de Gregorio-Monsalvo, I., Ménard, F., Dent, W., et al. 2013,A&A, 557, A133
Demyk, K., Meny, C., Leroux, H., et al. 2013, Proc. The Life Cycle of Dust in the Universe: Observations, Theory, and Laboratory Experiments LCDU2013, eds. A. Andersen, M. Baes, H. Gomez, C. Kemper, & D. Watson
Dodson-Robinson, S. E., & Salyk, C. 2011,ApJ, 738, 131
Dorschner, J., Begemann, B., Henning, T., Jaeger, C., & Mutschke, H. 1995,
A&A, 300, 503
Dullemond, C. P., & Dominik, C. 2005,A&A, 434, 971
Flock, M., Ruge, J. P., Dzyurkevich, N., et al. 2015,A&A, 574, A68
Follette, K. B., Tamura, M., Hashimoto, J., et al. 2013,ApJ, 767, 10
Fu, W., Li, H., Lubow, S., & Li, S. 2014,ApJ, 788, L41
Fukagawa, M., Hayashi, M., Tamura, M., et al. 2004,ApJ, 605, L53
Fung, J., Shi, J.-M., & Chiang, E. 2014,ApJ, 782, 88
Garufi, A., Quanz, S. P., Avenhaus, H., et al. 2013,A&A, 560, A105
Grady, C. A., Polomski, E. F., Henning, T., et al. 2001,AJ, 122, 3396
Grady, C. A., Muto, T., Hashimoto, J., et al. 2013,ApJ, 762, 48
Hashimoto, J., Tsukagoshi, T., Brown, J. M., et al. 2015,ApJ, 799, 43
Henning, T., Burkert, A., Launhardt, R., Leinert, C., & Stecklum, B. 1998,A&A, 336, 565
Huélamo, N., Lacour, S., Tuthill, P., et al. 2011,A&A, 528, L7
Isella, A., Pérez, L. M., Carpenter, J. M., et al. 2013,ApJ, 775, 30
Juhasz, A., Benisty, M., Pohl, A., et al. 2015,MNRAS, 451, 1147
Kley, W., & Dirksen, G. 2006,A&A, 447, 369
Kraus, A. L., & Ireland, M. J. 2012,ApJ, 745, 5
Masset, F. 2000,A&AS, 141, 165
Min, M. 2005, Ph.D. Thesis
Miotello, A., Bruderer, S., & van Dishoeck, E. F. 2014,A&A, 572, A96
Mulders, G. D., Paardekooper, S.-J., Pani´c, O., et al. 2013,A&A, 557, A68
Muto, T., Grady, C. A., Hashimoto, J., et al. 2012,ApJ, 748, L22
Nakagawa, Y., Nakazawa, K., & Hayashi, C. 1981,Icarus, 45, 517
Owen, J. E., & Clarke, C. J. 2012,MNRAS, 426, L96
Pani´c, O., van Dishoeck, E. F., Hogerheijde, M. R., et al. 2010,A&A, 519, A110
Pérez, L. M., Isella, A., Carpenter, J. M., & Chandler, C. J. 2014,ApJ, 783, L13
Pinilla, P., Benisty, M., & Birnstiel, T. 2012a,A&A, 545, A81
Pinilla, P., Birnstiel, T., Ricci, L., et al. 2012b,A&A, 538, A114
Pinilla, P., Birnstiel, T., Benisty, M., et al. 2013,A&A, 554, A95
Pinilla, P., Benisty, M., Birnstiel, T., et al. 2014,A&A, 564, A51
Pinilla, P., de Juan Ovelar, M., Ataiee, S., et al. 2015,A&A, 573, A9
Quanz, S. P., Amara, A., Meyer, M. R., et al. 2013,ApJ, 766, L1
Quanz, S. P., Amara, A., Meyer, M. R., et al. 2015,ApJ, 807, 64
Rice, W. K. M., Armitage, P. J., Wood, K., & Lodato, G. 2006,MNRAS, 373, 1619
Rosotti, G. P., Ercolano, B., Owen, J. E., & Armitage, P. J. 2013,MNRAS, 430, 1392
Shakura, N. I., & Sunyaev, R. A. 1973,A&A, 24, 337
Sturm, B., Bouwman, J., Henning, T., et al. 2010,A&A, 518, L129
Tanga, P., Babiano, A., Dubrulle, B., & Provenzale, A. 1996,Icarus, 121, 158
Tatulli, E., Benisty, M., Ménard, F., et al. 2011,A&A, 531, A1
van den Ancker, M. E., The, P. S., Tjin A Djie, H. R. E., et al. 1997,A&A, 324, L33
van der Marel, N., van Dishoeck, E. F., Bruderer, S., et al. 2013,Science, 340, 1199
Walsh, C., Juhász, A., Pinilla, P., et al. 2014,ApJ, 791, L6
Weidenschilling, S. J. 1977,MNRAS, 180, 57
Williams, J. P., & Best, W. M. J. 2014,ApJ, 788, 59
Wright, C. M., Maddison, S. T., Wilner, D. J., et al. 2014, MNRAS, submitted Zhang, K., Isella, A., Carpenter, J. M., & Blake, G. A. 2014,ApJ, 791, 42
Zhu, Z., & Stone, J. M. 2014,ApJ, 795, 53
![Fig. 5. Dust density distribution at di[0fferent times of evolution (upper row) and the corresponding real part of the visibilities at λ =.87, 1.0, 3.0, 7.0] mm (lower row) at different times of dust evolution, when a 20 MJup planet (left column) and 30 MJup](https://thumb-us.123doks.com/thumbv2/123dok_us/7904290.188615/7.595.50.546.79.459/density-distribution-erent-evolution-corresponding-visibilities-dierent-evolution.webp)
![Fig. 8. Real part of the visibilities atdiin the inner disk (10(15 λ = [0.87, 1.0, 3.0, 7.0] mm atfferent times of dust evolution when a 20 MJup planet is embedded−15 AU) from early stages, and a second planet MJup) is injected after 3 Myr of dust evolution](https://thumb-us.123doks.com/thumbv2/123dok_us/7904290.188615/10.595.48.280.75.232/visibilities-atdiin-aterent-evolution-planet-embedded-injected-evolution.webp)