DEVELOPMENT AND VALIDATION OF RP-HPLC METHOD
FOR RAPID SIMULTANEOUS ESTIMATION OF CALCIUM
PANTOTHENATE AND BIOTIN IN PURE AND TABLET
DOSAGE FORM
Dissertation submitted to
THE TAMILNADU Dr.M.G.R. MEDICAL UNIVERSITY CHENNAI- 600 032
In partial fulfillment of the requirements for the awards of the degree of MASTER OF PHARMACY
IN
PHARMACEUTICAL ANALYSIS
Submitted by R. KIRUTHIKA (REG.NO: 261530352)
Under the guidance of
Dr. R. RAJAPANDI, M.Pharm., Ph.D.,
DEPARTMENT OF PHARMACEUTICAL ANALYSIS,
ARULMIGU KALASALINGAM COLLEGE OF PHARMACY,
ANAND NAGAR, KRISHNANKOIL-626126
CERTIFICATE
This is to certify that the investigation described in the dissertation entitled “DEVELOPMENT AND VALIDATION OF RP-HPLC METHOD FOR RAPID SIMULTANEOUS ESTIMATION OF CALCIUM PANTOTHENATE
AND BIOTIN IN PURE AND TABLET DOSAGE FORM” submitted by
Reg. No: 261530352 research work was carried out in the Department of
Pharmaceutical Analysis, Arulmigu Kalasalingam College of Pharmacy, Anand Nagar, krishnankoil-626126 which is affiliated to The Tamilnadu Dr.M.G.R. Medical University, Chennai under my supervision and guidance for the partial fulfillment of degree of MASTER OF PHARMACY in the department of PHARMACEUTICAL ANALYSIS.
Place: Krishnankoil. Dr. R. RAJAPANDI M. Pharm., Ph.D., Date: Department of pharmaceutical Analysis,
CERTIFICATE
This is certify that the investigation described in the dissertation entitled
“DEVELOPMENT AND VALIDATION OF RP-HPLC METHOD FOR RAPID SIMULTANEOUS ESTIMATION OF CALCIUM PANTOTHENATE AND
BIOTIN IN PURE AND TABLET DOSAGE FORM” submitted by
Reg.no: 261530352 research work was carried out in the Department of
Pharmaceutical Analysis, Arulmigu kalasalingam college of pharmacy, Anand Nagar , Krishnankoil - 626126, which is affiliated to The Tamil Nadu Dr.M.G.R. Medical University, Chennai, under the supervision and guidance of Dr. R. RAJAPANDI M.Pharm., Ph.D., for the partial fulfillment of degree of MASTER OF PHARMACY in the department of PHARMACEUTICAL ANALYSIS.
Place: Krishnankoil. Prof. Dr. N. VENKATESHAN M.Pharm.,Ph.D., Date: Professor & Principal,
EVALUATION CERTIFICATE
This is to certify that dissertation work entitled “DEVELOPMENT AND VALIDATION OF RP-HPLC METHOD FOR RAPID SIMULTANEOUS ESTIMATION OF CALCIUM PANTOTHENATE AND BIOTIN PRESENT IN PURE AND TABLET DOSAGE FORM” submitted by Reg.no: 261530352
was carried out in the Department of Pharmaceutical Analysis, Arulmigu Kalasalingam College of Pharmacy, Anand Nagar, Krishnankoil -626126, which is affiliated to The Tamil Nadu Dr.M.G.R. Medical University, Chennai, under the supervision and guidance of Dr. R. RAJAPANDI M.Pharm., Ph.D., for the partial fulfillment of degree of MASTER OF PHARMACY in the department of PHARMACEUTICAL ANALYSIS were evaluated by,
Centre : Arulmigu Kalasalingam College of Pharmacy, Krishnankoil.
Date :
Examiners :
1.
ACKNOWLEDGEMENT
I pray our profound gratitude to the almighty god for this invisible help and blessing for the fulfillment of this work.
I take this privilege and pleasure to acknowledgement the contribution of many individuals who has been inspirational and supportive throughout my work under taken and endowed me most precious knowledge to see the success in my endeavor. My work bears the imprint of this people.
I am grateful to “Kalvivallal” Thiru T. Kalasalingam B.Com., for providing me required facilities for extending a rich and also I convey my sincere thanks to “llaiya vallal” Dr. K. Sridharan, Ph.D., Dynamic directors Dr. S. Shasi Anand, Ph.D., Mr. S. Arjun Kalasalingam, M.S., and management of our institution for providing me necessary infrastructure.
I expressed my sincere thanks to Dr. N. Venkateshan, M.Pharm., Ph.D., Principal of Arulmigu Kalasalingam College of Pharmacy, Krishnankoil, for permitting me to do project work in Fourrts India Laboratories Pvt. Limited, Chennai. And for this enthusiastic cooperation and timely advice and for providing faculties for the completion of my work
I give immense pleasure to express my deepest thanks, heartfelt indebtedness and respectful guide Dr. R. Rajapandi, M.Pharm, Ph.D., for his encouragement and guidance during the course of project and special thanks for providing suggestions during the project. Especially for their patience and immense acknowledge their constants quest for knowledge and strive for excellence will always remain a source of inspiration to me.
I respectfully acknowledge to my faculties Dr. J. Amutha Iswarya Devi M.Pharm., Ph.D., Mrs. A. Thenmozhi M.Pharm., Mr. T. Senthil Kumar M.Pharm., for providing suggestions, encouragement during the project.
Fourrts India Laboratories Pvt. Limited, Chennai for providing me necessary facilities and constant source of inspiration and has always encouraged scientific thinking to carry out this dissertation work for providing much of stimuli in the form of suggestions and guidance of enormous support for me during my entire project work. And also I would like to express my respectful thanks to Mr. J. Srinivasan, President of HR, Fourrts India Laboratories Pvt. Limited, Chennai for permitting me to undertake the research in their company.
I also convey my thanks to all the teaching and non-teaching staffs of our institution for their help during the course.
I am thanking to all my friends who have lent a hand to complete this dissertation.
Finally, I thank my GOD for giving me a very loving and caring family. But for their unflinching support constant motivation, immense faith and love. I wouldn’t have been able to thank my Mother and Father for always being there for me. Above all it is Almighty who has been pouring his blessings on me; to him I owe my lifelong indebtedness.
INDEX
S. No
Contents
Page No
1
Chapter 1: Introduction
1
2
Chapter 2: Literature Review
13
3
Chapter 3: Research Objective &
Plan of Research Work
23
4
Chapter 4: Drug Profile
25
5
Chapter 5: Materials & Equipments
27
6
Chapter 6: Experimental Works
29
7
Chapter 7: Results & Discussion
55
8
Chapter 8: Summary & Conclusion
91
9
Chapter 9: Glossary
94
CHAPTER 1:
INTRODUCTION
INTRODUCTION
This thesis deals with the studies carried for the simultaneous
estimation of calcium pantothenate and biotin in tablet dosage form by
RP-HPLC Method.
Modern medicines for human consumption are required to meet exact
standards which relate to their quality, safety and efficacy. The evaluation of
safety and their maintenance in practice is dependent upon the existence of
adequate methods for quality control of products. The purity of standard is a
must therefore, it can strictly define in such a way as to ensure that
successive batches are consistent in composition, irrespective of whether
they came from the same or different manufactures. Here lies the work of the
analytical chemist.
Definition:
Pharmaceutical analysis is branch of pharmaceutical chemistry, which is define as a process or a sequence of processes to identify and quantify a
substance or drugs the components of a pharmaceutical solution or mixture or
the determination of the structural of chemical compounds used in the
formulation of pharmaceutical products1. Pharmaceutical Analysis:
Modern methods of pharmaceutical analysis are extremely sensitive,
providing precise and detailed information from small samples of materials. In
general they are readily amenable to automation and also this method is very
rapid, due to this reasons they are now in widespread use in the product
development in the control of manufacturing formulations, as a check on
stability during storage and in monitoring the use of drugs and medicine2, 3. Role of analytical chemistry in pharmaceutical analysis4, 5:
Analytical chemistry may be defined as the science and art of
determining the composition of materials in terms of the elements of
composition contained. Its prime importance is to gain about the qualitative
INTRODUCTION
Dept. of Pharmaceutical Analysis
Arulmigu Kalasalingam College of Pharmacy Page 2
i.e., to find out what a substance is composed of and how much. In relation of
this context pharmaceutical analysis plays an important role in the quality
assurance and quality control of drug samples as well as pharmaceutical
formulations. In this connection it should be emphasized that the pharmacists
should be aware and capable of developing new methods for the purpose of
keeping the pharmaceutical industries and quality control laboratories in
viable position. The best way to characterize the quality of the drug is to
determine its purity. There are two possible approaches to reach this goal.
1. Determination of Active Pharmaceutical Ingredient (API).
2. Determination of its impurities with a highly accurate and precise
specific method.
Drugs and pharmaceuticals are chemicals or like substances, which
are of organic, inorganic or other origin. Whatever may be the origin, we use
some property of the medicinal agent to measure them qualitatively or
qualitatively. Pharmaceutical analytical techniques, which are being used, can
be categorized as follows.
Analytical Techniques:
There are three types analytical techniques are used as follows 6:
1. Spectroscopic analysis.
2. Electrochemical analysis.
3. Chromatographic technique.
SPECTROSCOPY:
Measurement based on light and other forms of electromagnetic
radiation are widely used to thought analytical chemistry. The interactions of
radiation and matter are the subject of the science called spectrometry.
Spectroscopic analytical methods are based on the measurement the amount
INTRODUCTION
Spectrophotometric Methods:
The light absorption (or) emission characteristic of drugs is measured
such as UV-Visible, IR, NMR, ESR, fluorescence and mass spectroscopy.
UV-Visible - Changes in electronic energy levels within the molecule.
Infrared - Changes in the vibrational and rotational movements of the Molecule.
Microwave - Electron spin resonance or electron paramagnetic resonance induces changes in the magnetic
properties of unpaired electron.
Radiofrequency - Nuclear magnetic resonance; induces changes in the magnetic properties of certain atomic nuclei, notably
that of hydrogen and the C13 isotope of carbon 8.
Quantitative spectrophotometric assay of medical substance by using UV-Visible spectroscopy:
The assay of an absorbing substance may be quickly carried out by
preparing a solution in a transparent solvent and measuring its absorption at a
suitable wavelength of maximum absorption where small errors in setting the
wavelength scale have little effect on the measurement absorbance of
approximately 0.9, around which the accuracy and precision of measurement
are optimal. The concentration of the absorbing substance is then calculated
from the measured absorbance using one of these principal procedures 9.
1. Use of standard absorptivity value.
2. Use of calibration graph.
3. Single or double point standardization.
4. Assay of substances multicomponent samples.
INTRODUCTION
Dept. of Pharmaceutical Analysis
Arulmigu Kalasalingam College of Pharmacy Page 4
6. Assay using absorbance corrected for interference.
7. Assay of after solvent extraction of the sample.
8. Simultaneous equations method.
9. Absorbance ratio method.
10. Geometric correction method 9. CHROMATOGRAPHY:
Chromatography may be defined as a method of separating mixture of
components into individual components though equilibrium distribution
between two phases. Especially, the technique of chromatography is based
on the difference in the rate at which the components of the mixture move
thorough a porous medium under the influence of some solvent or gas. The
chromatographic method of separation, in general, it involves the following
steps (i.e) adsorption or retention of substance or substance on the stationary
phase. Separated substance by a continuous flow of mobile phase, the
method is being called elution. High Performance Liquid Chromatography (HPLC):
The technique is based on the same mode of separation as that
classical column chromatography that is adsorption, partition, ion exchange
and gel permeation, but it differs from column chromatography in that the
mobile phase is pumped through the packed column under high pressure.
High performance liquid chromatography is a very sensitive analytical
technique most widely used for quantitative and qualitative analysis of
pharmaceuticals. The principle advantage of HPLC compared to classical
column chromatography is improved resolution of the separated substance,
faster separation times and the increased accuracy, precision, and sensitivity.
High-performance liquid chromatography sometimes referred to as
high-pressure liquid chromatography, which is a chromatographic technique used
to separate a mixture of compounds in analytical chemistry with the purpose
of identifying, quantifying and purifying the individual components of the
INTRODUCTION
Principle involved in HPLC:
The principle of separation in normal phase mode and reverse phase
mode is adsorption. The component which has more affinity towards the
adsorbent travels slower. The component which has less affinity towards the
stationary phase travels faster. Since no two components have the same
affinity towards the stationary phase, the components are separated.
Instrumentation:
Solvents must be degassed to eliminate formation of bubbles. The
pumps provide a steady high pressure with no pulsating, and can be
programmed to vary the composition of the solvent during the course of the
separation. Detectors rely on a change in refractive index, UV-VIS absorption,
or fluorescence after excitation with a suitable wavelength. The different types
of HPLC columns are described in a separate document.
A column (or other support for TLC, see below) holds the stationary
phase and the mobile phase carries the sample through it. Sample
components that partition strongly into the stationary phase spend a greater
amount of time in the column and are separated from components that stay
predominantly in the mobile phase and pass through the column faster.
INTRODUCTION
Dept. of Pharmaceutical Analysis
Arulmigu Kalasalingam College of Pharmacy Page 6
Detector:
Optical.
Equipped with a flow cell.
Focus light beam at the center for maximum energy transmission.
Cell ensures that the separated bands do not wide11, 12. ELECTROCHEMICAL ANALYSIS:
In electrochemical analysis one or more electrically related parameters
e.g.:-voltage, current, or charge are measured and related to the state of the
system generating or carrying the charge. In addition these methods can be
divided into those relating as in gram to system equilibrium. The combination
of electro-analytical methods with chromatography is a powerful tool for both
qualitative and quantitative work. It is measured based on the electrochemical
property of drugs and classified as potentiometry, conductometry,
polarography and amperometry.
Physical methods:
The physical characteristics of drugs are measured such as DSC, DTA, TGA and TMA.
Radio-active methods:
In this method, radiation intensity from a radioactive substance or an
induced radioactive substance arising from exposure of the sample to a
neutron source is measured using scintillation counters. e.g.,
radioimmunoassay
Titrimetric methods:
It is based on the reaction between titrant and titrate and the end point
detected by the addition of a suitable indicator reagent. It is classified in to
several types based on the reaction which is non aqueous, redox,
INTRODUCTION
X-ray methods:
In this, x-ray is used to identify certain emission peaks, which are characteristics of elements contained in the target. The wavelength of the
peak can be related to the atomic numbers of the elements producing them.
Other techniques such as combination of two or more methods where
separation and identification is possible by using coupled instruments such as
GC-MS and LC-MS.
DEFINITION OF VALIDATION:
As per USP, validation of an analytical procedure is the process by
which it is established, by laboratory studies, that the performance
characteristics of the procedure meet the requirements for the intended
analytical applications 13.
Validation process:
The real goal of the validation process is to challenge the method and
determine the limits or allowed deriability for the condition needed to the
method.
1. Specificity
2. Linearity
3. Range
4. Accuracy
5. Precision
INTRODUCTION
Dept. of Pharmaceutical Analysis
Arulmigu Kalasalingam College of Pharmacy Page 8
7. Quantification limit
8. Robustness
9. System suitability testing
Methodology:
The real goal of the validation process is to challenge the method and
determine the limits or allowed deriability for the condition needed to the
method.
Types of analytical procedure to be validated:
Identification test.
Quantitative test for impurities contents.
Limit test for the control of impurities.
Quantitative test of the active molecule in samples of drug substance
or drug product.
Analytical procedure:
It refers to the way of performing the analysis.
1. Specificity:
An investigation of specificity should be conducted during the validation
of identification test, determination of impurities and assay.
a. Identification:
To ensure the identity of an analyte.
b. Purity test:
To ensure that all the procedure performed allow an accurate
statement of the control of impurity of an analyte.
c. Assay (content of potency):
To provide an exact result which allow an accurate statement on
INTRODUCTION
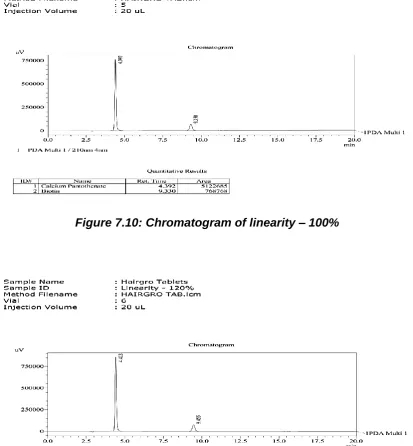
2. Linearity:
The linearity of an analytical procedure is of ability (within a given
range) to obtain test result while are directly proportional to the concentration
of analyte in the dam pole for establishment of linearity. A minimum of 5
concentrations is recommended other approaches would justified.
3. Range:
The range of analytical procedure is the introduce between the upper
and lower concentration of an analyte in the sample. The specific range is
normally derived from linearity studies and depending on the intended
application procedure. The following minimum specified ranges should be
considered.
For assay of drug substance: Normally from so to use of the test
concentration.
For content uniformity: - 70-80% of the concentration.
For dissolution release product 20% other one hour upto 40% after 24
hour for the validating range would be 0-100% of the label claim.
4. Accuracy:
Accuracy on the method was determined by relative and absolute
recovery experiments. a. Drug substances:
Application of an analytical procedure to analyte of known purity of
reference material.
Comparison of request with those of second well characterized
procedure, the accuracy of which is stated.
b. Drug product:
Application of an analytical procedure to analyte of known purity of
INTRODUCTION
Dept. of Pharmaceutical Analysis
Arulmigu Kalasalingam College of Pharmacy Page 10
c. Impurities:
Accuracy should be assessed on sample splinked with known
amount of impurities. Compare there to independent procedure.
d. Recommended data:
Accuracy should be assessed using a minimum of a determination
over a minimum of 3 concentration levels covering a specified range.
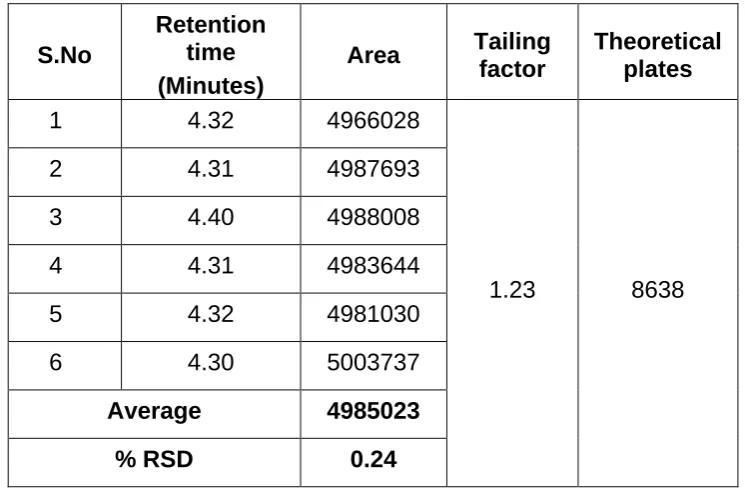
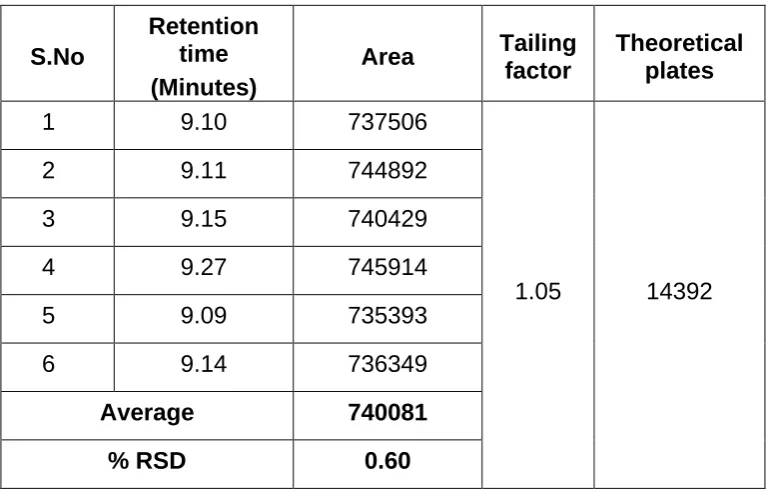
5. Precision:
Validation of test for assay and quantitative determination of impurities
includes an included an investigation of precision.
a. Repeatability:
A minimum of a determination covering the specified range for
procedure (or) A minimum of 6 determination at 100% of the test.
b. Intermediate precision:
The applicant should establish the affects of random events on the
precision of analytical procedure.
c. Reproducibility:
Reproducibility is assessed by means of an inter laboratory test
this should be considered in case of standardization of analytical procedure
for instance for inclusion, and procedure in I.P.
Standard deviation, relative standard deviation and confidence interval
should be reported for each type of precision investigation.
6. Detection limit:
The detection limit of an individual analytical procedure is the lowest
amount of analyte is a sample which can be detected but not necessary
quantified as an exact value approaches other than those listed below may be
INTRODUCTION
Based on visual evaluation.
Based on signal to raise.
Based on the standard deviation on the response and slope.
Based on the standard deviation of the blank.
Based on the calibration curve.
Recommended data.
Detection levels and determination method detection limit should be
presented.
The detection limit (LOD) may be expressed as:
LOD = 3.3σ/S
Where, = The standard deviation of the response.
S = The slope of the calibration curve (of an analyte).
7. Quantification limit:
The quantitative limit of an individual analytical procedure is the lowest
amount of an analyte in the sample which can be quantitative determined with
suitable precision and accuracy. The quantification limit is a parameter of
quantitative assay of law levels of compound in sample material and it is used
particularly for the determination of impurity.
Quantification Limit (LOQ) may be expressed as:
LOQ = 10/S
Where, = The standard deviation of the response.
S = The slope of the calibration curve (of an analyte).
8. Robustness:
The robustness of the method was determined by analyzing the
standard solution six times followed by a sample in duplicate with varying
INTRODUCTION
Dept. of Pharmaceutical Analysis
Arulmigu Kalasalingam College of Pharmacy Page 12
Examples of typical variation are:
Stability of analytical solution.
Extraction time.
In case of liquid chromatography examples of typical variation are.
Influence of variation of pH in mobile phase.
Influence of variation of pH in mobile phase components.
Different column.
Temperature.
Flow rate.
9. System suitability testing:
System suitability testing is an integral part of many analytical
procedures. The tests are based on the concept that the equipment,
electronics, analytical operations, and samples to be analyzed constitute an
integral system that can be evaluated as such. System suitability test
parameters to be established for a particular procedure depend on the type of
procedure being validated.
The parameters that are affected by the changes in chromatographic
conditions are,
Retention (KA)
Resolution (Rs)
Capacity factor (k’)
Selectivity ()
Column efficiency (N) and
CHAPTER 2:
LITERATURE REVIEW
Dept. of Pharmaceutical Analysis
Arulmigu Kalasalingam College of Pharmacy Page 13
LITERATURE REVIEW
Havlikova L et al14., 2006 carried out research about HPLC
determination of calcium pantothenate and two preservatives in topical cream
and reported as simultaneous determination of calcium pantothenate and two
preservatives methylparaben and propylparaben present in topical cream.
Different analytical columns with various stationary phases were tested.
During method development, Supelco Discovery C18 column
(125 mm × 4.0 mm, 5 μm) and Zorbax SB-CN column (150 mm × 4.6 mm, 5 μm) were tested. Both were not convenient for analytical separation
because of the co-elution of calcium pantothenate with dead volume, and
problems with the peak-shape of all components. Good separation was achieved using Zorbax TSM (250 mm × 4.6 mm, 5 μm) and Hypersil ODS column (250 mm × 4.6 mm, 5 μm), the latter was finally used for the analysis.
The analysis time was 12 min, at flow rate 0.7 ml min−1. Chromatography was performed using binary mobile phase composed of methanol and phosphoric
acid, pH 2.5, 65:35 (v/v). UV detection was accomplished at 214 nm. The
method was validated according to ICH guideline recommendations. The
method is suitable for practical routine analysis of commercially produced
topical pharmaceutical preparations.
Thomas J Franks et al15., 2006 developed “A Reverse Phase HPLC
Assay for the Determination of Calcium Pantothenate Utilizing Column Switching” and summarized as a reverse phase HPLC assay utilizing column
switching has been developed and validated for the determination of calcium
pantothenate (CP) in several multivitamin tablet formulations. The reverse
phase system utilizes a DuPont Zorbax C-8 analytical column, an
automatically switched and back flushed Brownlee RP-18 guard column for
the elimination of a highly retained excipient peak, 88:12 0.25M phosphate
buffer: CH3OH mobile phase, and 214 nm detection. Sample preparation and
the switched column chromatography cycle each require approximately 15 minutes. A spiked recovery study showed linearity over the 50–150% of
theory concentration range. Average recovery was 99.7%. Assay precision
studies yielded sample RSD's ranging from 0.8 to 2.3%. Results obtained by
LITERATURE REVIEW
Huangmin et al16., 2009 carried out research in “Measurement of
Water-Soluble B Vitamins in Infant Formula by Liquid
Chromatography/Tandem Mass Spectrometry.” A method has been
developed for the simultaneous measurement of multiple B vitamins (i.e., B1,
B2, B3, B5, and B6) in infant formulas by LC-MS/MS. The vitamins were
extracted with acidic solvent, followed by protein precipitation at a pH range of
4.5 to 5.5, and filtered. This simplified procedure eliminates many of the
potential sources of laboratory error and facilitates rapid and efficient analysis.
As is common in most cases, isotope internal standards were added to
account for variations in sample preparation, as well as changes in MS
measurement. In this method, isotope-labeled internal standards of B1, B3, B5,
and B6 were used. The factors affecting analytical performance were
investigated and optimized. In addition, the stability of these vitamins in the
extraction solution was investigated. An acidic condition (5M HCl) was applied
to successfully stabilize B1, which had shown a decrease in signal when other
solvents were used. The quantitative extraction and good stability allowed
isotope standards to be added to the filtered sample solution, instead of to the
extraction solvent. The addition of the isotope to the small portion of the
filtered sample solution significantly reduces cost. A comprehensive
evaluation of the analysis of the standard reference material and good spike
recovery of the vitamins demonstrates the accuracy of the method. The
results for commercially available infant formula samples were also compared
with those obtained using the current microbiological method.
Karuppiah SP et al17., 2015 worked in “Phytochemical evaluation of
hydroxy citric acid, catechins and calcium pantothenate present in herbal formulation” and concluded as the analytical method for the estimation of
phytochemical active ingredients present in Garginia combogia extract with
calcium pantothenate for herbal formulations are evaluate for its assay
content and dissolution release. This herbal formulation with slim formula
consists of several active ingredients such as hydroxy citric acid, catechins
and calcium pantothenate. The HPLC method for the estimation of active
LITERATURE REVIEW
Dept. of Pharmaceutical Analysis
Arulmigu Kalasalingam College of Pharmacy Page 15
Ulrich Holler et al18., 2005, carried out research in ”Quantification of
biotin in feed, food, tablets, and premixes using HPLC–MS/MS and
summarized as two sensitive and specific methods for quantification of biotin in feed, food, tablets, and premixes based on HPLC–MS/MS have been
developed and validated. Depending on sample matrix and biotin content
different extraction procedures and HPLC conditions were applied. Key steps
in sample preparation were an alkaline extraction or a hydrolysis with
sulphuric acid followed by enzymatic digest with papain. For many samples
with low biotin content the latter combination of extraction steps was shown to
be necessary for an optimal release of biotin from the matrix. The first time
synthesis of deuterated biotin for use as internal standard allowed the
compensation of losses during sample work-up and ion suppression during HPLC–MS/MS analysis. The new methods are faster than the commonly used
microbiological assay using Lactobacillus plantarum. Additionally, they have a
higher specificity as results for biotin are based on determination of a
chemically defined compound, and not of a biological activity. Quantification is applicable to samples with a biotin content >100 μg/kg. Results obtained with
the new methods have been compared with those of the microbiological
assay, and were in good agreement.
AnthonyE.Ekpe et al19.,1997, developed method for “Liquid
chromatographic determination of biotin in multivitamin-multimineral tablets”A
reproducible reverse phase high pressure liquid chromatography (RP-HPLC)
method for the determination of biotin in multivitamin-multimineral tablets has
been developed and validated. This method involves reverse phase
separation of the component monitored by absorbance at 200 nm wavelength.
The method has excellent precision and accuracy with S.D. 0.83 and 2.9%, respectively. The established linearity range was 0.5–2 μg ml−1 (r2>0.9999).
The recovery of biotin from spiked placebo was >97% over the linear range.
The extraction procedure is simple and the HPLC conditions separate biotin
from its degradation products and excipients. The method has been
successfully used in determining biotin content in 4 brands of commercially
LITERATURE REVIEW
Chikakoyomota et al20., 2016, carried out research in”Determination of
biotin following derivatization with 2-nitrophenylhydrazine by
high-performance liquid chromatography with on-line UV detection and electrospray-ionization mass spectrometry” Currently, biotin is typically
determined in Japan using a microbiological method. Such microbiological
assays are sensitive, but they are not always highly specific and are also rather tedious and time-consuming. In the present study, RP-HPLC and LC–
MS methods for the determination of biotin have been developed by
derivatizing the carboxyl group with nitrophenylhydrazine hydrochloride.
2-Nitrophenylhydrazine is used for the derivatization of carboxylic acids, and these derivatives are known to be applicable to LC–MS detection. Biotins in
tablets were extracted by the addition of water and ultrasonic agitation. In
order to clean up the sample solution, the filtrate was applied to an ODS
cartridge and eluted with methanol. The conditions for preparing the
2-nitrophenylhydrazide derivatives were modified from a previous report for fatty acids. Good recovery rates of over 70% were obtained for the addition of 5– 125 μg of biotin per formulation. The detection limit in HPLC at 400 nm was
0.6 ng per injection, with good linearity being obtained over the concentration range 0.001–0.2 μg per injection. Further, derivatives were determined by LC–MS with electrospray ionization, where the spectra indicated the
molecular ions [M + H] +. The detection limit was 0.025 ng per injection in the
selected ion monitoring analysis, and linearity was observed in the range of 0.6–6 ng per injection. The proposed method could be used to specifically
determine the presence of biotin in relatively clean samples.
Hua-BinLi et al21., 2001, performed research in ”Simultaneous
determination of nine water-soluble vitamins in pharmaceutical preparations by high-performance liquid chromatography with diode array detection” and
concluded as a simple and rapid method for the simultaneous determination
of nine water-soluble vitamins was developed by high performance liquid
chromatography with diode array detection. The water-soluble vitamins were analyzed by HPLC on a μ-Bondapak C18 column (300×3.9 mm, 10 μm) with
methanol-0.1 mol/L KH2PO4 buffer (pH 7.0) as mobile phase (1.5 mL/min) in
LITERATURE REVIEW
Dept. of Pharmaceutical Analysis
Arulmigu Kalasalingam College of Pharmacy Page 17
8.0–15.0 min, 40:60 (v/v). All nine water-soluble vitamins were separated in a
single HPLC run within less than 15 min. The linearity of the calibration
graphs was compound-dependent with correlation coefficients of 0.9986 to
0.9999 (n = 6). The detection limits ranged from 0.02 μg/mL to 0.5 μg/mL. The
method was successfully applied to the determination of vitamins in
pharmaceutical preparations. The recoveries were from 95% to 102% and the
relative standard deviations were in the range of 0.8% to 4.2%.
Yoon young huh et al22., 2011, carried out research in ”Development of
Analytical Method of Biotin in Complex Drugs and Dietary Supplements Using HPLC-UV” and concluded as to improve the quality control, and protect
consumers by developing prevalently used and efficient analytical tools to
determine and quantify target compounds. Because the Korean Pharmacopeia
(KP) presents microbiological assays for biotin, which is laborious and
time-consuming, this study is focused on applying HPLC-UV to detect and quantify
biotin in complex drugs and dietary supplements like multi-vitamin. Biotin in
complex drugs was extracted from methanol and analyzed using mobile phase
with 10 M potassium phosphate (monobasic, pH=3.0) in distilled water and
acetonitrile. Gradient condition was used to successfully detect and quantify biotin
within 20 minutes. Validation result for linearity was significant that average r2 was
0.999 (n=3) and its relative standard deviation (RSD) was 0.0578% which was
less than 2%. Using this method, quantification of biotin in complex drugs was
completed successfully and recovery tests were finished that recovery percentage
greater than 95% with relative standard deviation less than 2%.
Timmons et al23., 1987 performed research in “Reverse phase liquid
chromatographic assay for calcium pantothenate in multivitamin preparations and raw materials.” A reverse phase liquid chromatographic (LC) method has
been developed for the assay of calcium pantothenate in commercial
multivitamin tablet formulations and raw materials. The assay was validated
according to the Pharmaceutical Manufacturers Association Quality Control
HPLC Committee guidelines. The chromatographic system includes a C-18
column and a mobile phase consisting of 0.25M sodium phosphate buffer, pH
2.5, and acetonitrile (97 + 3 v/v). The column effluent is monitored by UV
LITERATURE REVIEW
followed by filtration. The method is stability-indicating with a detection limit of
approximately 50 ng/mL of the calcium pantothenate in the samples. The
system is linear from at least 0.02 to 0.10 mg/mL. The mean recovery of
spiked placebos ranged from 98.7 to 99.8%. The within-day precision of the
assay on finished products (N = 6) ranged from 0.3 to 2.0% CV. A system
suitability criterion for resolution is based on the separation between calcium
pantothenate and 2 closely eluting compounds, saccharin and a saccharin
degradation product, 2-sulfamoylbenzoic acid.
Ramniwas Dudhwal et al24., 2011 carried out research in
“Simultaneous Estimation of Ascorbic Acid and Calcium Pantothenate in Multivitamin and Multimineral Tablets by Reverse-Phase HPLC” and
concluded as simultaneous estimation of Ascorbic acid (AA) & Calcium
pantothenate (CP) in a pharmaceutical Multivitamin & Multimineral unit
dosage form was achieved on a reverse phase C18 column (5µm; 250x4.6
mm) with an isocratic mobile phase elution order at a flow rate of 1.0 mL/min.
The mobile phase was buffer [0.1 %v/v solution of triethylamine in milli-Q
water with pH 3.00 ± 0.05 (adjusted with ortho-phosphoric acid)] and
methanol in the ratio of 80:20. Detection was performed with UV detector at
210nm. The method was validated with respect to linearity, precision,
accuracy, and specificity according to ICH guidelines. The responses were
linear in concentration range of 20-60 µg/mL for AA and 2.5-7.5 µg/mL for CP.
The values of slope and correlation coefficient were found to be 15202 &
1.000 for AA; and 7583 & 1.000 for CP respectively. The %RSD value
for repeatability and intermediate precision studies were 2.9 & 0.8 for AA; and
3.3 & 2.8 for CP respectively. The %recovery of the vitamins ranged between
98.0 to 99.7 for AA and 98.1 to 98.7 for CP.
Thomas J Hudson et al25., 1984, worked in the area of ”Determination
of pantothenic acid in multivitamin pharmaceutical preparations by reverse-phase high-performance liquid chromatography” concluded as a
high-performance liquid chromatographic procedure was developed for the
analysis of calcium pantothenate in nutritional supplements. The method
involves a simple extraction using phosphate buffer and sonication.
LITERATURE REVIEW
Dept. of Pharmaceutical Analysis
Arulmigu Kalasalingam College of Pharmacy Page 19
gel column in the reverse-phase mode. A UV detector set at 210 nm was
used to monitor the effluent. Quantitative recoveries were obtained, and
precision of the method is discussed. The method is applicable to multivitamin
tablets, calcium pantothenate raw material, and yeast grown in the presence
of high levels of calcium pantothenate. The results of the method are
compared with results obtained from the USP microbiological method of
analysis. It was concluded that the procedure is rapid, accurate, easily
automated, and practical for routine quality control use.
Kai-On Chu et al26., 1998, carried out research in the area of ”Analysis
of Commercial Multi-vitamin Preparation by HPLC with Diode Array Detector”
and reported as a simple and efficient HPLC analysis method has been
developed to simultaneously analyze complicated multi-vitamin preparations,
including vitamin B complexes, vitamin C, orotic acid, methionine, calcium
pantothenate, nicotinamide, biotin, folic acid and rutin, without using
expensive ion pairing reagent. Diode array detector and adjustment of the
mobile phase to pH 5.6 are required in the study. This method has been
validated with good linearity, reproducibility, recovery and accuracy for
analysis of commercial multi-vitamin products.
Zerzanova A et al27., 2007, carried out research in ”Using of HPLC
coupled with coulometric detector for the determination of biotin in pharmaceuticals” and concluded as the method for the determination of biotin by high performance liquid chromatography (HPLC) coupled with coulometric
detector. Chromatographic and detection conditions were tested. A LiChrospher 60RP-select B column (250 mm × 4 mm; 5 μm) and the mobile
phase containing 0.24 mol/L aqueous solution of acetic acid and acetonitrile in
the ratio 85:15 (v/v) were found as the most suitable. The flow rate was 1 mL/min and the injected volume of the sample was 20 μL. The
hydrodynamic voltammogram of biotin was measured and according to obtained data the detection parameters were set – channel I 600 mV, channel II 900 mV, sensitivity 1 μA. The developed method has been validated. The calibration curve is linear in the range 15–3600 ng/mL, correlation coefficient
is 0.9998, limits of detection and quantification are 5 and 15 ng/mL,
LITERATURE REVIEW
on average. The developed method has been successfully applied for
determination of biotin in pharmaceutical preparations.
Staggs C G et al28., 2004, carried out research in ”Determination of the
biotin content of select foods using accurate and sensitive HPLC/avidin binding” and reported as accuracy in estimating dietary biotin is limited both
by data gaps in food composition tables and by inaccuracies in published
data. The present study applied sensitive and specific analytical techniques to
determine values for biotin content in a select group of foods. Total biotin
content of 87 foods was determined using acid hydrolysis and the
HPLC/avidin-binding assay. These values are consistent with published
values in that meat, fish, poultry, egg, dairy, and some vegetables are
relatively rich sources of biotin. However, these biotin values disagreed
substantially with published values for many foods. Assay values varied
between 247 times greater than published values for a given food to as much
as 36% less than the published biotin value. Among 51 foods assayed for
which published values were available, only seven agreed within analytical
variability (±20%). We conclude that published values for biotin content of
foods are likely to be inaccurate.
Pei chen et al29., 2010 carried out research in “A LC/UV/Vis method for
determination of cyanocobalamin (VB12) in multivitamin dietary supplements
with on-line sample clean-up” and concluded that the HPLC- UV/Vis method
using a two-column strategy with a switching valve for on-line sample
clean-up was developed by using two columns (i.e) Agilent zorbax C8 (150mm×
4.6mm, 5µm particle size) reverse phase column and a waters symmetry C18
(150mm× 4.6mm, 5µm particle size) reverse phase column. Chromatographic
separation was achieved using a programmed gradient mobile phase
consisting of (A) 0.1% formic acid in acetronitrile. Because of the low levels of
vitamin-B12 in the sample, large injection volumes, and thus much interfering
material, must be used to exceed the limit of quantification (LOQ) by UV
detection. A switching valve was used to divert most of these early eluting
interfering materials to waste, effecting online sample cleanup without
excessive sample preparation steps. The recovery of CN-Cbl in the method
LITERATURE REVIEW
Dept. of Pharmaceutical Analysis
Arulmigu Kalasalingam College of Pharmacy Page 21
successfully applied to the analysis of the NIST SRM 3280 multivitamin/
multimineral dietary supplement tablet. The method is specific, precise and
accurate for the intended use. Compared to off-line sample clean-up
procedures, it offers the advantage of being easier, more economical and less
time consuming.
Gabriela Klaczkow et al30., 2001, developed method for “Elaboration of
HPLC method for Biotin determination in multiple vitamin drugs and comparison with microbiological method” and reported the optimal analytical
conditions for the biotin determination by HPLC method with detection at the
wavelength 200 nm in multiple vitamin drugs. Statistical parameters of the
HPLC method and the microbiological method of the biotin determination
were compared whose RSD values were 0.31%-1.88%and 2.02%-6.63%
respectively.
Tsui-Min Wang et al31., 2003, performed research in “Liquid
chromatographic method for determination of calcium pantothenate preparations and related stability studies” and reported that the samples were
analyzed in C18 column with the mobile phase of acetonitrile and potassium
dihydrogen phosphate solution pH adjusted to 2.5 with phosphoric acid at the
flow rate of 1.0 mL/min and UV absorbance detection at 204 nm. Ampicilin
was used as a internal standard. The retention time of calcium pantothenate
and ampicilin were 5.3 and 6.5 min, respectively. An equation was presented
for linear relationship between peak height ratios of calcium pantothenate to
ampicilin and the calcium pantothenate concentration over a range of 10-50
µg/ml (r = 0.9999). Standard addition recoveries were greater than 98.96%
with twelve commercial products. The RSD were lies between 0.1 and 0.9% in
inter-day assays, 0.1 and 0.7% in intra-day assays. The result obtained from
the HPLC assay method which we developed and the microbiological assay
of USP was paired at 95% confidence level. There was no significant
difference between these two methods. The proposed HPLC method was a
suitable substitute for microbiological method for quantitative assays of
LITERATURE REVIEW
Marina Franco et al32., 2011, carried out research in “Application of
CZE method in routine analysis for determination of B-complex vitamins in pharmaceutical and veterinary preparations” and concluded that vitamins of
interest are thiamine hydrochloride (B1), thiamine monophosphate chloride
(B1a), ribofavine (B2), riboflavin-5’ monophosphate (B2a), nicotinamide (B3), d-
pantothenic acid calcium salt (B5), pyridoxine hydrochloride (B6), folic acid (B9)
and 4-amino benzoic acid (B10). These analytes were separated optimizing
the experimental condition in 20mM tetra borate buffer pH = 9.2 as a BGE, on
Beckman P/ACE system MDQ instrument, using uncoated fused silica
capillary. The effective capillary length was of 49.5 cm, I.D. = 50µm, the
applied voltage 20kV and the temperature 25ºc. Detection was performed by
diode array detector at 214 nm for all vitamins except B5 (190nm) and B2a
(260 nm). Separation time was about 9 min. After experimental conditions
optimization, the proposed method was validated. Precision of migration time
and corrected peak area, linearity range, LOD and LOQ, accuracy (recovery),
robustness and ruggedness were evaluated for each analyte demonstrating
the good reliability of the method. Analysis of the pharmaceutical real samples
CHAPTER 3:
RESEARCH
OBJECTIVE &
PLAN OF
RESEARCH OBJECTIVE
RESEARCH OBJECTIVE
The drug analysis plays an important role in the development of drugs,
their manufacture and the therapeutic use. Pharmaceutical industries rely
upon quantitative chemical analysis to ensure that the raw materials used and
final product obtained meets the required specification. The number of drugs
and drug formulations introduced in to the markets has been increased at an
alarming rate. These drugs or formulation may be either in the new entities in
the market or partial structure modification of the existing drugs or novels
dosage forms or multi component dosage forms.
The drug selected for the present study is biotin and calcium
pantothenate in tablet dosage form containing vitamins and
multi-minerals. A review of literature reveals that only few chromatographic and
spectrophotometric methods have been reported for the estimation of biotin
and calcium pantothenate separately but not in simultaneous method. So my
prime aim is to develop a simple, rapid, efficient, accurate, reproducible, less
time consuming and reliable new validated chromatographic method of
analysis for biotin and calcium pantothenate in pharmaceutical dosage form.
The objective of the research is as follows:
Development of rapid, sensitive and accurate reverse phase HPLC method for the simultaneous estimation of biotin and calcium
pantothenate.
To estimate biotin and calcium pantothenate simultaneously from tablet dosage form by developed method and validation of
PLAN OF RESEARCH WORK
Dept. of Pharmaceutical Analysis
Arulmigu Kalasalingam College of Pharmacy Page 24
PLAN OF RESEARCH WORK
1. To collect through knowledge in practical RP-HPLC method
development by using various search engines like ACS, Elsevier, Bentham, etc…
2. To proceed a step by step procedure for method development to be
implemented and initial chromatographic condition for assay of biotin
and calcium pantothenate in tablet dosage form is to be estimated.
3. To optimize the chromatographic conditions and trials the method.
4. To validated a method for analytical quantization of assay in biotin and
calcium pantothenate in tablets dosage form.
5. To give a general ICH guidelines for the validation of methods aim for
the quantization of biotin and calcium pantothenate in tablets dosage
form.
6. To make document from the obtained results with improved accuracy
DRUG PROFILE
Dept. of Pharmaceutical Analysis
Arulmigu Kalasalingam College of Pharmacy Page 25
DRUG PROFILE
Biotin:Biotin is a water-soluble B-vitamin, also called vitamin B7 and formerly
known as vitamin H or coenzyme R. Biotin is necessary for cell growth, the
production of fatty acids, and the metabolism of fats and amino acids. Biotin
assists in various metabolic reactions involving the transfer of carbon dioxide.
It may also be helpful in maintaining a steady blood sugar level. Biotin is often
recommended as a dietary supplement for strengthening hair and nails,
though scientific data supporting this outcome are weak. Nevertheless, biotin
is found in many cosmetics and health products for the hair and skin.
Synonym : Vitamin B7; Vitamin H; Coenzyme R; Biopeiderm
Empirical
Formula
: C10H16N2O3S
Molecular weight : 244.31 g·mol−1
Appearance : White crystalline needles
Melting Point : 232 to 233 °C (450 to 451 °F; 505 to 506 K)
Solubility in
water
: 22 mg/100ml
Structure :
5-(2-Oxohexahydro-1H-thieno[3,4-d]imidazol-4-yl) pentanoic acid
S N
H NH
O
O
DRUG PROFILE
Calcium Pantothenate:
Pantothenic acid, also called vitamin B5 (B vitamin), is a
water-soluble vitamin. Pantothenic acid is an essential nutrient. Animals require
pantothenic acid to synthesize coenzyme-A (CoA), as well as to synthesize
and metabolize proteins, carbohydrates and fats. The anion is called
pantothenate. Pantothenic acid in the form of CoA is also required for
acylation and acetylation, which, for example, are involved in signal
transduction and enzyme activation and deactivation, respectively. Since
pantothenic acid participates in a wide array of key biological roles, it is
essential to all forms of life. As such, deficiencies in pantothenic acid may
have numerous wide-ranging effects. Calcium pantothenate is often used in
dietary supplements because, as a salt, it is more stable than pantothenic
acid. Supplementation may improve oxygen utilization efficiency and reduce
lactic acid accumulation in athletes.
Molecular formula : C9H17NO5
Molecular weight : 476.536 g/mol
Appearance : Yellow oil ; Colorless crystals (Ca2+ salt)
Melting point : 183.83 °C (362.89 °F; 456.98 K)
Solubility : Very soluble in C6H6, ether;Ca2+ salt: Slightly soluble
in alcohol, CHCl3.
Solubility in Water : Very soluble2.11 g/mL (Ca2+ salt)
Related Compound : Panthenol
Structure :
Calcium salt of 3-[(2,4-dihydroxy-3,3-dimethylbutanoyl)amino]propanoic acid
O
H H3C CH3
O
H O
NH
O
OH Ca
CHAPTER 5:
MATERIALS &
MATERIALS AND EQUIPMENTS
MATERIALS AND EQUIPMENTS
Background:The RP-HPLC method for the estimation of biotin and calcium
pantothenate in solid dosage form has been validated in Fourrts (India)
Laboratories Pvt. Ltd. Analytical method validation for the estimation of biotin
and calcium pantothenate in solid dosage form by RP-HPLC has been
conducted as per the protocol, to ensure that the performance characteristics
of the method meet the requirements for its intended application.
Required instrument and reagent: Materials:
The following table list materials were used in this study.
S.No Name Grade Supplier
Lot No/
B.No Purity Expiry
1 KH2PO4 AR
Rankem, RFCL
Ltd, Mumbai. J037C16 100.0% Feb’20
2 KH2PO4 AR
Finar Chemical
Ltd, Sanand. 21070305J12 99.5% Oct’17
3 Methanol HPLC Fischer
Chemicals. 1333170916 99.9% Oct’18
4 Methanol HPLC Finar Chemical
Ltd, Sanand. 168071027AP 99.8% Jun’18
5 H3PO4 AR
Rankem, RFCL
Ltd, Mumbai. G025J15 88.0% Sep’18
6 Ammonia AR Fischer
MATERIALS AND EQUIPMENTS
Dept. of Pharmaceutical Analysis
Arulmigu Kalasalingam College of Pharmacy Page 28
Working standard:
The following table list standards were used in this study.
S.No Name Grade Lot No/ B.No Purity Expiry
1 Calcium pantothenate BP WS038/09 97.75 23/10/2017
2 Biotin BP WS103/07 99.35 09/02/2018
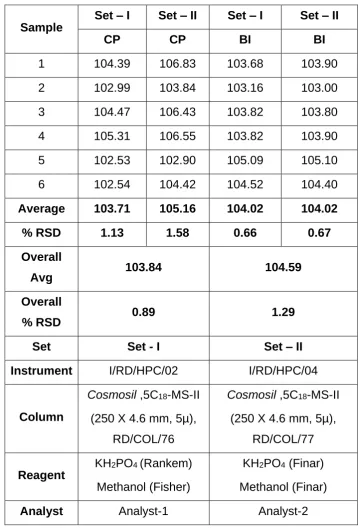
Instrumentation:
The following table list instruments were used in this study.
S.No Name of the Instrument Ref. Number Make Model
1 Electronic balance I/RD/OEB/EB/01
Adventurer
OHAUS
AR2140
2 HPLC I/RD/HPC/02 Shimadzu Prominence
3 HPLC I/RD/HPC/04 Shimadzu LC-2010C HT
Column details:
The following table list column that was used in this study.
Column Ref.
Number I.D. Number Make Specification
1 RD/COL/76 K63402 Nacalai
Tesque,Inc.
Cosmosil ,5C18-MS-II
(250 X 4.6 mm, 5µ)
2 RD/COL/77 K65386 Nacalai
Tesque,Inc.
Cosmosil ,5C18-MS-II
CHAPTER 6:
EXPERIMENTAL WORKS
Dept. of Pharmaceutical Analysis
Arulmigu Kalasalingam College of Pharmacy Page 29
EXPERIMENTAL WORKS – (RP- HPLC)
Method development1. Selection of wavelength:
Biotin and calcium pantothenate working standards were dissolved in
suitable diluent. And the solution were scanned between 200 to 400 nm using
uv-visible spectrophotometer then these were subjected to chromatograph
containing PDA detector to determine the accurate and optimized wavelength.
After reviewing the uv-visible Spectrum, a wavelength of 210 nm was selected as the optimum wavelength for this method.
2. Selection of Mobile phase:
A mobile phase of water: methanol in the ratio of 1:1 was run through
the HPLC column. But the elution of drug in this mobile phase was poor. So,
mobile phase was changed to mono basic potassium dihydrogen
orthophosphate buffer and methanol in the ratio of 1:1 with pH of 4, again the
elution was poor. So, the concentration of same mobile phase was changed
to 60: 40 (buffer: methanol) and adjusts the pH 2.20 ± 0.05 with 10%
orthophosphoric acid and it was used.
3. Buffer preparation:
Dissolve 4.1 g of mono basic potassium dihydrogen ortho phosphate
in 1000 ml of water. Adjust the pH to 2.20 0.05 with 10 % orthophosphoric acid. Filter through 0.45 μ membrane filter.
4. Mobile phase preparation:
Measure 600ml of buffer and 400ml of methanol to form the
concentration ratio of 60:40, mix well and degas it.
5. Standard solution (Calcium pantothenate):
Weigh accurately about 100.0 mg of calcium pantothenate working
standard into a clean 100 ml volumetric flask. Dissolve in 25 ml of water and
0.2 ml of ammonia solution. Sonicate for 5 minute, and make up the volume
EXPERIMENTAL WORKS
6. Standard solution (Biotin):
Weigh accurately about 10.0 mg of biotin working standard into a clean
100 ml volumetric flask. Dissolve in 25 ml of water and 0.2 ml of ammonia
solution. Sonicate for 5 minute, and make up the volume with the water
(Concentration: 0.10 mg/ml of biotin).
7. Standard Solution (Calcium pantothenate+ biotin):
Weigh accurately about 100.0 mg of calcium pantothenate working
standard and 10 mg of biotin working standard into a clean 100 ml volumetric
flask. Dissolve in 25 ml of water and 0.2 ml of ammonia solution. Sonicate for
5 minute, and make up the volume with the water (Concentration: 1.0 mg/ml
of calcium pantothenate and 0.10 mg/ml of biotin).
Chromatographic conditions:
Column : Cosmosil, C18, 250 X 4.6 mm, 5 μm or equivalent
Flow rate : 1.0 ml / min
Detection wavelength : 210 nm
Injection volume : 20 L Oven temperature : 30°C
Mobile phase : Buffer: methanol (60: 40)
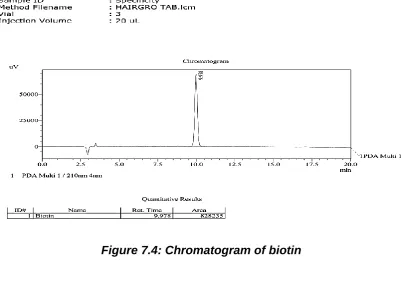
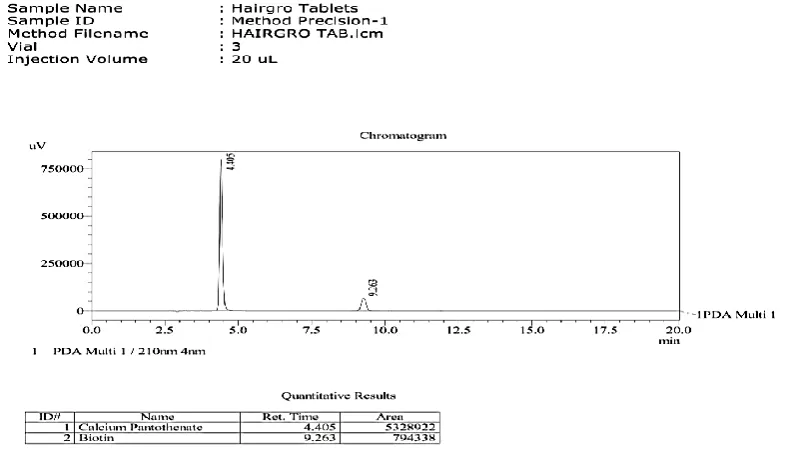
Report:
EXPERIMENTAL WORKS
Dept. of Pharmaceutical Analysis
Arulmigu Kalasalingam College of Pharmacy Page 31
For improving the elution of biotin and calcium pantothenate in combination:
The peaks of biotin and calcium pantothenate were not separated in the combined form. In order to separate peaks either change in ratio of mobile
phase or addition of peak modifier or ion pairing agent has to be used. Here
changing the buffer concentration should be used to its ability to shift peak in
the ratio of 70:30 (buffer: methanol) and thus giving good resolution.
Buffer preparation:
Dissolve 4.1 g of mono basic potassium dihydrogen ortho phosphate in
1000 ml of water. Adjust the pH to 2.20 0.05 with 10 % orthophosphoric acid. Filter through 0.45 μ membrane filter.
Mobile phase preparation:
Measure 700ml of buffer and 300ml of methanol to form the
concentration ratio of 70:30, mix well and degas it.
Standard solution (Calcium pantothenate):
Weigh accurately about 100.0 mg of calcium pantothenate working
standard into a clean 100 ml volumetric flask. Dissolve in 25 ml of water and
0.2 ml of ammonia solution. Sonicate for 5 minute, and make up the volume
with the water (Concentration: 1.0 mg/ml of calcium pantothenate).
Standard solution (Biotin):
Weigh accurately about 10.0 mg of biotin working standard into a clean
100 ml volumetric flask. Dissolve in 25 ml of water and 0.2 ml of ammonia
solution. Sonicate for 5 minute, and make up the volume with the water
(Concentration: 0.10 mg/ml of biotin).
Standard solution (Calcium pantothenate+ biotin):
Weigh accurately about 100.0 mg of calcium pantothenate working
standard and 10 mg of Biotin working standard into a clean 100 ml volumetric
flask. Dissolve in 25 ml of water and 0.2 ml of ammonia solution. Sonicate for
5 minute, and make up the volume with the water (Concentration: 1.0 mg/ml
EXPERIMENTAL WORKS
Chromatographic conditions:
Column : Cosmosil, C18, 250 X 4.6 mm, 5 μm or equivalent
Flow rate : 1.0 ml / min
Detection wavelength : 210 nm
Injection volume : 20 L Oven temperature : 30°C
Mobile phase : Buffer: methanol (70: 30)
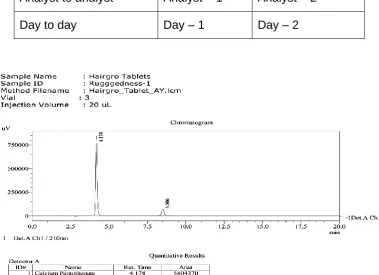
Report:
Elution of both biotin and calcium pantothenate was found to be
extremely good when change in concentration of mobile phase was used.
Selection of phase:
On the basis of RP-HPLC mode and number of carbon atom present in molecule C18 bonded stationary phase was tried. Cosmosil, C18, 250 X 4.6
mm, 5 μm or equivalent, for this stationary phase was selected as it gives
good result in case of system suitability parameter i.e. resolution, USP
tangent, USP tailing.
Selection of other parameter:
Other parameter like mobile phase, flow rate, column, temperature and wavelength of detector can be selected on the basis of chemical properties of
components present in the sample, sensitivity and system suitability
EXPERIMENTAL WORKS
Dept. of Pharmaceutical Analysis
Arulmigu Kalasalingam College of Pharmacy Page 33
OPTIMIZED METHOD Buffer preparation:
Dissolve 4.1 g of mono basic potassium dihydrogen ortho phosphate in
1000 ml of water. Adjust the pH to 2.20 0.05 with 10 % orthophosphoric acid. Filter through 0.45μ membrane filter.
Mobile phase preparation:
Measure 700ml of buffer and 300ml of methanol to form the
concentration ratio of 70:30, mix well and degas it.
Standard solution (Calcium pantothenate):
Weigh accurately about 100.0 mg of calcium pantothenate working
standard into a clean 100 ml volumetric flask. Dissolve in 25 ml of water and
0.2 ml of ammonia solution. Sonicate for 5 minute, and make up the volume
with the water (Concentration: 1.0 mg/ml of calcium pantothenate).
Standard solution (Biotin):
Weigh accurately about 10.0 mg of biotin working standard into a clean
100 ml volumetric flask. Dissolve in 25 ml of water and 0.2 ml of ammonia
solution. Sonicate for 5 minute, and make up the volume with the water
(Concentration: 0.10 mg/ml of biotin).
Standard solution (Calcium pantothenate+ biotin):
Weigh accurately about 100.0 mg of calcium pantothenate working
standard and 10 mg of biotin working standard into a clean 100 ml volumetric
flask. Dissolve in 25 ml of water and 0.2 ml of ammonia solution. Sonicate for
5 minute, and make up the volume with the water (Concentration: 1.0 mg/ml
EXPERIMENTAL WORKS
Chromatographic conditions:
Column : Cosmosil, C18, 250 X 4.6 mm, 5 μm or equivalent
Flow rate : 1.0 ml / min
Detection wavelength : 210 nm
Injection volume : 20 L Oven temperature : 30°C
Mobile phase : Buffer: methanol (70: 30)
Calculation:
% Assay of calcium pantothenate:
Area of sample X Std wt (mg) X 100 X Purity of std. X Avg wt. of tablet (mg) X 100 = ---
Area of std X 100 X Sample wt (mg) X 100 X 100
= --- % of calcium pantothenate
% Assay of biotin:
Area of sample X Std wt (mg) X 100 X Purity of std. X Avg wt. of tablet (mg) X 100 = --- Area of std X 100 X Sample wt (mg) X 100 X 10
= ---% of biotin
Parameters used for assay validation:
The validation of the assay procedure was carried out using the following