Int. J. Electrochem. Sci., 14 (2019) 4520 – 4531, doi: 10.20964/2019.05.22
International Journal of
ELECTROCHEMICAL
SCIENCE
www.electrochemsci.org
Application of Taguchi Grey Analysis to Optimization of
Mechanical Properties of ZrWN/buffer Multilayer Coatings
Yong-Chang Zhao1, Ding-Yeng Chen2, Ding-Chiang Hu3, Jian-Rong Li4,*,Chun-Yao Hsu3,*
1 School of Engineering Technology, Jiangsu Institute of Commerce, Jiangsu, China
2 Department of Mechanical Engineering, Hwa Hsia University of Technology, New Taipei City,
Taiwan
3 Department of Mechanical Engineering, Lunghwa University of Science and Technology, Taoyuan
33306, Taiwan
4 College of Electric and IT, Yangzhou Polytechnic Institute, Jiangsu, 225127, China *E-mail: [email protected] (J.-R Li), [email protected] (C.-Y. Hsu)
Received: 22 December 2018 / Accepted: 19 February 2019 / Published: 10 April 2019
Zirconium tungsten nitride (ZrWN) films are deposited onto SUS 304 stainless steel and glass, with and without a tungsten (W) and tungsten nitride (WN) buffer layer, by means of direct current (DC) reactive magnetron sputtering. This study determines the optimal parameter settings for the multilayer (ZrWN/buffer) deposition process using the Taguchi method for the design of a robust experiment and grey relational analysis. An orthogonal array, the signal-to-noise ratio and an analysis of variance are used to determine the effect of the deposition parameters. The main deposition parameters for the buffer layer, such as the W DC power, the substrate bias, the N2/(N2+Ar) flow rate, the substrate temperature,
are optimized, with reference to the structure, morphological and mechanical properties of the multilayer (ZrWN/buffer) coating. The results show that the buffer layer improves the performance of ZrWN films. The N2/(N2+Ar) flow rate and the W DC power have the most significant effect on the mechanical
performance. A Taguchi grey analysis shows that the coefficient of friction is reduced from 0.55 to 0.52, the corrosion potential increases from –0.18 to –0.16 V and the Vickers hardness increases from 13.44 to 17.65 GPa. The multilayer coatings exhibit no cracking or peeling-off, are homogeneous and highly dense and have a smooth surface and a very compact structure. They adhere well to the substrate and the indentation samples are classified as HF1.
Keywords: buffer layer; sputtering; Taguchi grey; mechanical properties.
1. INTRODUCTION
tools [2]. PVD is a well-established industrial technique for the deposition of hard coatings that involves sputtering. This treatment significantly increases the lifetime and the service quality of steel substrates. It allows control of the film’s density, microstructure and the mechanical properties [3]. Qi et al. [4] studied CrNx hard films that were deposited by reactive magnetron sputtering using various values for
the sputtering power. Single-phase CrNx hard coatings exhibit superior hardness and high resistance to
plastic deformation and cracking, which is attributed to their nano-composite structure. Dubey et al. [5] reported the effect of the nitrogen partial pressure on the structural and mechanical properties and the composition of ZrWN coatings that are deposited using DC/RF reactive magnetron sputtering. The coated film is homogeneous, very compact and adheres excellently to the substrate surface.
A conventional experimental approach requires a large number of trials. The Taguchi method combines experimental design theory and a quality loss function and uses orthogonal arrays that allow practical testing with the minimum number of runs [6]. The Taguchi method uses design and analysis experiments to produce low cost products of improved quality and has been used extensively in manufacturing to improve quality and design [7]. Chen et al. [8] reported CrAlSiN films that were deposited on tungsten carbide tools to improve the cutting performance for MAR-M247 super-alloy using Taguchi based experiments. The optimal conditions for the deposition of CrAlSiN films give respective values for the hardness, the Young's modulus and the coefficient of friction of 31.26 GPa, 258.58 GPa and 0.50. Hsieh et al. [9] used a Taguchi grey method to determine the parameters for the deposition of CrWN films. This approach greatly simplifies the optimization procedure for multiple performance characteristics and the effectiveness of this method is verified by experiments.
This study determines the effect of a metallic tungsten (W) and tungsten nitride (WN) buffer layer on the properties of ZrWN films. In order to optimize the design of the process to deposit the buffer layer, a Taguchi experimental design with an L9 (34) orthogonal array, with four columns and nine rows,
is used. A statistical analysis of the signal-to-noise ratio (S/N) is performed and an analysis of variance (ANOVA) is used to determine the characteristics of the deposition parameters. The effect of the coating process on the structure, surface morphology, coefficient of friction, corrosion potential and Vickers hardness for the ZrWN/buffer multilayer are reported.
2. EXPERIMENTAL PROCEDURE
ZrWN hard films and a buffer layer (W and WN) were deposited onto SUS 304 stainless steel and glass substrates using a DC magnetron co-sputtering system with a base pressure of 4.5×10⁻⁶ torr. A mixture of high-purity (99.95%) Ar plasma and N2 reactive gases was used and pure Zr and W metal
targets (99.95% purity, with a diameter of 76 mm). The substrate was rotated at a constant speed (30 rpm), the distance between the substrate and the target was 70 mm and the working pressure was 4.2×10–
3 torr. Before deposition, the target was pre-sputtered for 15 min, in order to remove any contamination.
The substrates were ultrasonically cleansed in acetone, rinsed in deionized water and dried in nitrogen. The effect of four parameters, each at three levels, is determined: the W DC power (150, 200, 250 Watt), the substrate bias (0, –80, –160 V), the N2/(N2+Ar) flow rate ratio (0, 15, 30%) and the
was first used by Deng [10] and is useful when there is poor, uncertain or incomplete information. Taguchi grey analysis is used to determine the optimal process parameters for the coating of the buffer layer using multiple characteristics [11].
ZrWN films
[image:3.596.82.513.303.512.2]metallic tungsten (W) and tungsten nitride (WN) as a buffer layer SUS 304 stainless steel and glass as a substrate
Figure 1. The order of the multilayer coating for the deposition of buffer layers using various parameters and the Taguchi method.
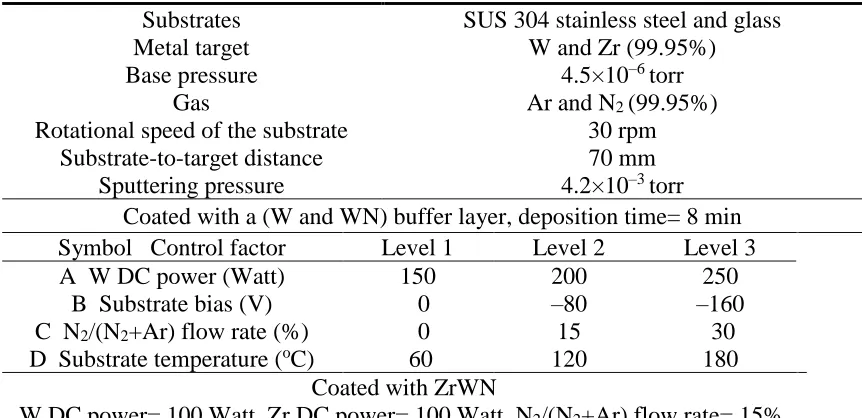
Table 1. Settings for the factors and levels for the (W and WN) buffer layer and ZrWN hard films.
Substrates SUS 304 stainless steel and glass
Metal target W and Zr (99.95%)
Base pressure 4.5×10⁻⁶ torr
Gas Ar and N2 (99.95%)
Rotational speed of the substrate 30 rpm
Substrate-to-target distance 70 mm
Sputtering pressure 4.2×10⁻³ torr
Coated with a (W and WN) buffer layer, deposition time= 8 min Symbol Control factor Level 1 Level 2 Level 3
A W DC power (Watt) 150 200 250
B Substrate bias (V) 0 –80 –160
C N2/(N2+Ar) flow rate (%) 0 15 30
D Substrate temperature (oC) 60 120 180
Coated with ZrWN
W DC power= 100 Watt, Zr DC power= 100 Watt, N2/(N2+Ar) flow rate= 15%,
Substrate bias= - 80 V, Substrate temperature=100oC, Deposition time=16 min
The coefficient of friction and the wear behavior of the film coating were measured using a ball-on-disk tribometer (CSM Instruments, Switzerland). The tests were conducted in an ambient atmosphere without lubricant, along a circular track that was 10 mm in diameter, using a 6.0 mm diameter Al2O3
are typically used to measure the adhesion of coatings. To ensure the reproducibility of the results, all tests were performed twice and average values are given.
The film’s thickness was measured using a surface profilometer (α-step, ET-4000A). The morphology was determined using a field emission scanning electron microscope (SEM, JEOL JSM-6500F). The chemical composition of the films was measured using an Energy dispersive spectrometer (EDS). The crystal structure of the film was determined using X-ray diffraction (Rigaku-2000 X-ray Generator), with Cu Kα radiation (40 kV and 30 mA, λ= 0.1541 nm) and a grazing incidence angle of
1o.
2.1. Analysis of the S/N ratio
The Taguchi method was used for the experiment, in order to enhance the quality of the system at minimal cost. In this study, the corrosion potential and the Vickers hardness are a higher-the-better (HB) category of performance characteristics for the Taguchi method and the coefficient of friction is a lower-the-better (LB) characteristic. The S/N ratios for HB and LB are calculated as [14]:
HB (maximize):
− =
= n i yin N S 1 2 1 1 log 10
/ (1)
LB (minimize):
− =
= n i i y n N S 1 2 1 log 10/ (2)
where n is the number of observations and y is the measured data: the S/N ratio for the HB or LB characteristic (unit: dB).
2.2. Analysis of variance (ANOVA)
An ANOVA is used to analyze the experimental data, in order to determine which coating parameters significantly affect the performance characteristics.
(3)
(4)
(5)
where ST is the sum of squares due to the total variation, Sm is the sum of squares due to the means, SA is the sum of squares due to a parameter A (A = W DC power, substrate bias, N2/(N2+Ar) flow
rate ratio or substrate temperature), SE is the sum of squares due to error, ηi is the η value for each experiment (i = 1, 2,…,9) and ηAi is the sum of the ith level for parameter A (i = 1, 2, 3). N is the repeating number for each level of parameter A, fA is the degree of freedom for parameter A and VA is the variance
for parameter A.
m i T
i
m S S
S =
=
2−2 , 9 ) (
− = −= m E T A
Ai
A S S S S
N S , 2 E A Ao A A A V V F f S
2.3 Grey relational analysis
Grey relational analysis is used to determine the complicated inter-relationships between multiple performance characteristics. The grey relational coefficient is given by [10]:
(6)
where is the normalized value of the kth performance in the ith experiment and is a distinguishing coefficient: . The value of is adjusted according to the actual requirements of the system. In this study, the deposition process parameters are equally weighted so the value of ζ is 0.5.
The grey relational grade is a weighting-sum of the grey relational coefficient. It is defined as [10]:
(7)
where is the number of performance characteristics. The calculated grey relational grade ranges from 0 to 1 and equals 1 if these sequences are identically coincident. The optimum level for the process parameters is the level that has the highest grey relational grade [15].
3. RESULTS AND DISCUSSION
3.1. The effect of the deposition parameters for the buffer layer on the properties of ZrWN films
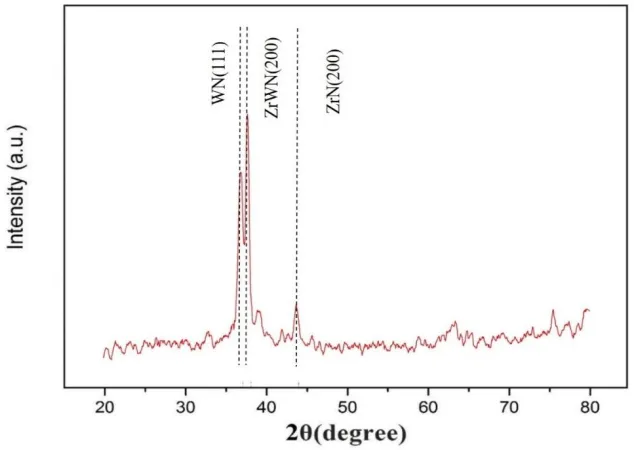
The thickness of the buffer layer (W and WN) ranges from 86 to 125 nm. Fig. 2 shows the XRD patterns for W (left) and WN (right) buffer layers. The diffraction peaks at 2θ∼37.5o, 42o and 76.5o respectively correspond to W structure (111), (200), and (311). The peaks at 2θ∼37.5o, 43.5o, 62.5o and 75o respectively correspond to WN structure (111), (200), (220) and (311). This result is in agreement with the results of the study by Maille et al. [16], for which the peaks that were observed for monolithic W and WN films exhibit a simple face center cubic (FCC) structure. Fig. 3 shows the XRD diffraction patterns for a multilayer ZrWN/WN coating. The film exhibits a single FCC phase for which the crystallographic orientation of the grains is (111) and (200). A similar result was obtained in a study by Dubey et al. [17], which noted that the lowest strain energy plane is (111) and the lowest surface energy plane is (200). This results in competitive grain growth (evolutionary selection rule).
( ) ( )
(
)
( ) ( )
( ) ( )
( ) ( )
( ) ( )
k x k x k x k x k x k x k x k x k x k x r i k i i i k i i k i io − + −
− + − = 0 0 0 0 max max max max min min , ) (k
xi
0, 1 (
)
(
( ) ( )
)
= = n k ii r r k x k
Figure 2. XRD patterns for W (left) and WN (right) buffer layers.
Figure 3. XRD diffraction patterns for the multilayer ZrWN/WN coating.
[image:6.596.112.491.66.218.2] [image:6.596.149.466.279.504.2]
Table 2. The experimental results and S/N ratios for the coefficient of friction, the corrosion potential and the Vickers hardness value for multiple-layer ZrWN/W (Nos. 1, 6 and 8) and ZrWN/WN (Nos. 2, 3, 4, 5, 7 and 9) coatings (Experiments were run twice).
No. Factors
Coefficient of
friction S/N (dB)
Corrosion potential
(Volts) S/N
(dB)
Vickers hardness (GPa) S/N (dB)
A B C D F1 F2 Ave. C1 C2 Ave. V1 V2 Ave.
1 1 1 1 1 0.74 0.72 0.73 2.73 -0.21 -0.23 -0.22 13.14 11.50 11.81 11.66 21.33 2 1 2 2 2 0.71 0.69 0.70 3.10 -0.11 -0.09 -0.10 19.96 12.04 13.77 12.91 22.22 3 1 3 3 3 0.74 0.72 0.73 2.73 -0.18 -0.20 -0.19 14.41 13.59 13.13 13.36 22.52 4 2 1 2 3 0.70 0.73 0.72 2.91 -0.15 -0.17 -0.16 15.90 13.36 13.51 13.42 22.56 5 2 2 3 1 0.75 0.70 0.73 2.79 -0.17 -0.21 -0.19 14.38 14.09 14.90 14.50 23.22 6 2 3 1 2 0.63 0.71 0.67 3.46 -0.21 -0.19 -0.20 13.97 13.00 12.08 12.54 21.97 7 3 1 3 2 0.66 0.61 0.64 3.94 -0.19 -0.21 -0.20 13.97 15.50 14.16 14.83 23.42 8 3 2 1 3 0.63 0.63 0.63 4.01 -0.20 -0.21 -0.21 13.76 13.96 13.56 13.76 22.77 9 3 3 2 1 0.55 0.50 0.53 5.59 -0.18 -0.20 -0.19 14.65 13.44 14.41 13.93 22.88
ZrWN 0.78 0.76 0.77 -0.25 -0.27 -0.26 10.21 9.55 9.88 SUS 304
Uncoated 1.18 1.24 1.21 -0.35 -0.31 -0.33 2.20 2.22 2.21
Note: A= W DC power (Watt), B= Substrate bias (-V), C= N2/(N2+Ar) flow rate (%), D=
Substrate temperature (oC)
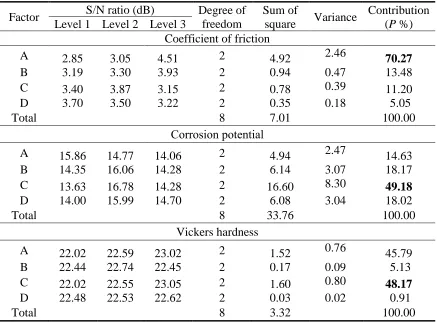
Table 3. The ANOVA results for the coefficient of friction, the corrosion potential and the Vickers hardness, corresponding to Table 2.
Factor S/N ratio (dB) Degree of freedom
Sum of
square Variance
Contribution (P %) Level 1 Level 2 Level 3
Coefficient of friction
A 2.85 3.05 4.51 2 4.92 2.46 70.27
B 3.19 3.30 3.93 2 0.94 0.47 13.48
C 3.40 3.87 3.15 2 0.78 0.39 11.20
D 3.70 3.50 3.22 2 0.35 0.18 5.05
Total 8 7.01 100.00
Corrosion potential
A 15.86 14.77 14.06 2 4.94 2.47 14.63
B 14.35 16.06 14.28 2 6.14 3.07 18.17
C 13.63 16.78 14.28 2 16.60 8.30 49.18
D 14.00 15.99 14.70 2 6.08 3.04 18.02
Total 8 33.76 100.00
Vickers hardness
A 22.02 22.59 23.02 2 1.52 0.76 45.79
B 22.44 22.74 22.45 2 0.17 0.09 5.13
C 22.02 22.55 23.05 2 1.60 0.80 48.17
D 22.48 22.53 22.62 2 0.03 0.02 0.91
[image:7.596.81.518.448.770.2]
The ANOVA results for the coefficient of friction, the corrosion potential and the Vickers hardness are listed in Table 3, which corresponds to Table 2. The contribution ratio for each parameter is shown in Table 3. It is seen that the W DC power (buffer layer deposition parameter) has the greatest effect on the coefficient of friction, accounting for a contribution ratio of almost 70.27%. The coefficient of friction is reduced when the W DC power is increased. The N2/(N2+Ar) flow rate (buffer layer
deposition parameters) has the most significant effect on the corrosion potential, with a contribution of 49.18%, followed by the substrate bias, with a contribution of 18.17%. The N2/(N2+Ar) flow rate has
the greatest effect on the Vickers hardness, with a 48.17% contribution, followed by the W DC power, with a contribution of 45.79%.
3.2 Optimal parameters for the deposition of the buffer layer
An analysis of multiple performance characteristics was used to optimize the deposition parameters with respect to the coefficient of friction, the corrosion potential and the Vickers hardness [18].
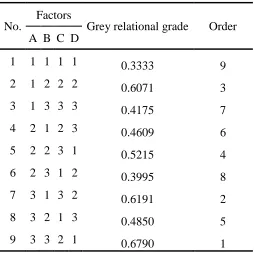
Using Eqs. (6) and (7), the complex multiple performance characteristics are converted into a single grey relational grade. The grey relational grade for each experiment and its order in the optimization process is shown in Table 4. A higher grey relational grade means that the corresponding experimental result is closer to the ideal normalized value. The grey relational grade has a larger-the-better characteristic. Parameter set No. 9 (A3B3C2D1) has the highest grey relational grade so it has the
best multiple performance characteristics of all the experiments. Table 5 lists the results for the ANOVA for the grey relational grade for the multiple layers. It is seen that the N2/(N2+Ar) flow rate and the W
[image:8.596.172.426.515.768.2]DC power have respective contributions to the multiple performance characteristics of 46.77% and 34.12%.
Table 4. The grey relational grade and its order in the optimization process.
No.
Factors
Grey relational grade Order A B C D
1 1 1 1 1 0.3333 9
2 1 2 2 2 0.6071 3
3 1 3 3 3 0.4175 7
4 2 1 2 3 0.4609 6
5 2 2 3 1 0.5215 4
6 2 3 1 2 0.3995 8
7 3 1 3 2 0.6191 2
8 3 2 1 3 0.4850 5
Table 5. Results for the ANOVA for the grey relational grade for multiple-layer ZrWN/W and ZrWN/WN coatings.
Factor S/N ratio (dB) Degree of freedom
Sum of
square Variance
Contribution (P %) Level 1 Level 2 Level 3
Grey relational
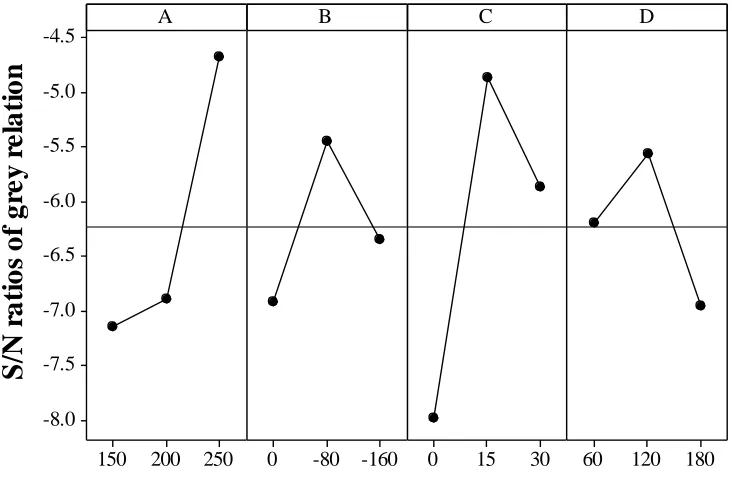
A -7.15 -6.89 -4.67 2 11.15 5.58 34.12
B -6.92 -5.44 -6.35 2 3.34 1.67 10.22
C -7.99 -4.86 -5.87 2 15.29 7.65 46.77
D -6.20 -5.56 -6.95 2 12.91 1.46 8.90
Total 8 32.69 100.00
Fig. 4 shows the plot for the grey relational grade for each deposition parameter at different levels. The optimum conditions for the deposition of the buffer layer that give good multiple performance characteristics for ZrWN that is grown on WN/substrates are achieved using the combination, A3B2C2D2, which is a W DC power of 250 Watts, a substrate bias of –80 V, a N2/(N2+Ar)
flow rate of 15% and a substrate temperature of 120oC.
Figure 4. The S/N graph for the grey relational grade.
3.3. Confirmation tests
The optimal levels for the WN buffer layer deposition parameters were used for the confirmation tests, in order to verify the improvement in the performance characteristics. The results for the confirmation experiment are compared with the results for the orthogonal array and the grey theory
S
/N
r
a
ti
o
s
o
f
g
re
y
r
e
la
ti
o
n
250 200 150 -4.5
-5.0
-5.5
-6.0
-6.5
-7.0
-7.5
-8.0
-160 -80
0 0 15 30 60 120 180
[image:9.596.80.517.111.238.2] [image:9.596.115.481.374.616.2]
prediction for the operating parameters. Table 6 lists the experimental results for multiple performance characteristics for ZrWN/WN/substrates. A comparison of the parameters for the grey theory prediction (A3B3C2D1) and the parameters for the orthogonal array (A3B3C3D1) shows that the coefficient of friction
[image:10.596.92.505.229.351.2]is reduced from 0.53 to 0.52, the corrosion potential increases from –0.18 to –0.16 V and the Vickers hardness increases from 13.93 to 17.65 GPa.
Table 6. The results for the confirmation experiment for multiple performance characteristics, using the deposition parameters from the orthogonal array and the optimal predicted deposition parameters.
Orthogonal array
Grey theory prediction design
Improvement rate (%) A3B3C2D1 A3B2C2D2
for ZrWN / WN coated on SUS 304
Coefficient of friction 0.53 0.52 1.89
Corrosion potential (V) –0.19 –0.16 15.79
Vickers hardness (GPa) 13.93 17.65 26.70
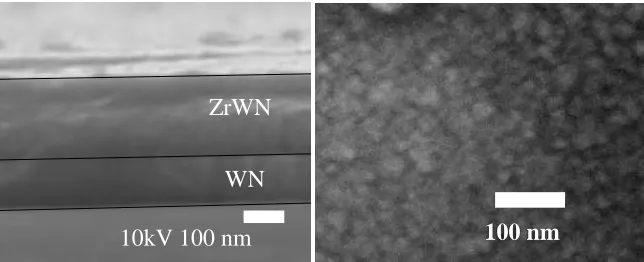
Fig. 5 shows the SEM images for the cross-sectional and surface morphology for multilayer ZrWN/WN coatings. No cracking or peel-off is observed after deposition and the coatings exhibit a homogeneous, highly dense and smooth surface and a very compact structure, so they adhere very well to the substrate. A Rockwell C indentation test (maximum applied force 150 kg) was used to determine the adhesive strength of the coatings. The adhesion measurement techniques of Chang et al. [19] were used. These classify indentations into six classes (HF1–HF6), which qualitatively define the adhesion of films to substrates. Fig. 6 shows the contours of the indentations for the coated specimens. The indentation is clear and smooth, except for some radial cracks that initiate from the center of the indentation. The multilayer (ZrWN/buffer) coatings that are produced by this study adhere well to the substrate and the indentation samples are classified as HF1.
Figure 5. SEM images of the cross-sectional (left) and surface morphology (right) for multilayer ZrWN/WN coatings.
ZrWN
WN
[image:10.596.138.460.572.703.2]
Figure 6. Fracture morphology for samples that are coated with a film, estimated by means of Rockwell-C hardness tester.
4. CONCLUSIONS
This study initiates an experiment to improve the coefficient of friction, the corrosion potential, the Vickers hardness and the structure of multilayer (ZrWN/buffer) films. The ANOVA results for the performance characteristics of the multilayer (ZrWN/buffer) coatings show that the N2/(N2+Ar) flow
rate has a significant effect. In the confirmation runs, Taguchi grey analysis shows that the coefficient of friction is improved by 1.89%, the corrosion potential by 15.79% and the Vickers hardness by 26.70%. The multilayer coatings exhibit no cracking or peel-off and have a homogeneous, highly dense and smooth surface and a very compact structure. The films are classified as HF1, which indicates good adhesive strength. This technique greatly simplifies the optimization procedure for multiple performance characteristics and the effectiveness of this method is verified by experiment.
DISCLOSURE STATEMENT
No potential conflict of interest was reported by the authors.
ACKNOWLEDGMENTS
The authors gratefully acknowledge the support of the Ministry of Science and Technology of the Republic of China, through Grant nos. MOST 105-2221-E-262-005.
References
1. P. L. Sun, C. Y. Su, T. P. Liou, C. H. Hsu and C. K. Lin, J. Alloy. Compd., 509 (2011) 3197. 2. H. A. Chaliyawala, G. Gupta, P. Kumar, G. Srinivas, Siju and H. C. Barshilia, Surf. Coat. Technol.,
276 (2015) 431.
3. W. Yang, J. Xiong, Z. Guo, H. Du, T. Yang, J. Tang and B. Wen, Ceram. Int., 43 (2017) 1911. 4. Z. Qi, Z. Wu, D. Zhang, B. Wei, J. Wang and Z. Wang, Vacuum, 145 (2017) 136.
5. P. Dubey, V. Arya, S. Srivastava, D. Singh and R. Chandra, Surf. Coat. Technol., 236 (2013) 182. 6. K. S. Chang, J. Y. Kao, C. H. Huang, C. Y. Hsu and P. D. Hong, Ceram. Int., 44 (2018) 9519. 7. Z. Asadi and R. Norouzbeigi, Ceram. Int., 43 (2017) 11318.
9. T. H. Hsieh, Y. J. Zhu, Z. H. Yu, C. Y. Tang, C. H. Hsu and C. Y. Hsu, J. Nanosci. Nanotechnol., 17 (2017) 5031.
10. J. L. Deng, Introduction to grey system, J. Grey Syst., 1 (1) (1989).
11. G. C. Chen, C. C. Hu, C. H. Wang, T. W. Lu and C. Y. Hsu, Int. J. Refract. Met. Hard Mat., 37 (2013) 82.
12. A.S.T.M. G99-95 ASTM International, Annual Book of Standards (2000).
13. W. H. Lee, C.H. Huang, Y. T. Sun, H. Chang and C. Y. Hsu, Int. J. Electrochem. Sci., 13 (2018) 2044.
14. Z. Asadi and R. Norouzbeigi, Ceram. Int., 43 (2017) 11318.
15. T. H. Hsieh, C. H. Hsu, C. Y. Wu, J. Y. Kao and C. Y. Hsu, Curr. Appl. Phys., 18 (2018) 512. 16. L. Maille, P. Aubert, C. Sant and P. Garnier, Surf. Coat. Technol., 180 –181 (2004) 483.
17. P. Dubey, V. Arya, S.K. Srivastava, D. Singh and R. Chandra, Surf. Coat. Technol. 245 (2014) 34. 18. K. T. Chen, J. Y. Kao, C. Y. Hsu and P. D. Hong, Ceram. Int., 45 (2019) 327.
19. C. H. Chang, C. B. Yang, C. C. Sung and C. Y. Hsu, Thin Solid Films, 668 (2018) 63.