Abstract— In this paper, a method based on wavelet coefficients in low-pass bands is proposed for the image classification with adaptive processing of data structures to organize a large image database. After an image is decomposed by wavelet, its features can be characterized by the distribution of histograms of wavelet coefficients. The coefficients are respectively projected onto x and y directions. For different images, the distribution of histograms of wavelet coefficients in low-pass bands is substantially different. However, the one in high-pass bands is not as different, which makes the performance of classification not reliable. This paper presents a method for image classification based on wavelet coefficients in low-pass bands only. Images are arranged into a tree structure. The nodes can then be represented by the distribution of histograms of these wavelet coefficients. 2940 images derived from seven categories are used for image classification. Based on the wavelet coefficients in low-pass bands, the improvement of classification rate on the training data set is up to 11%, and the improvement of classification rate on the testing data set reaches 20%. Experimental results show that our proposed approach for image classification is more effective and reliable.
I. INTRODUCTION
he various applications of image processing on image content representation has drawn much attention in the past decade. A set of keywords is used to represent image contents in most of the systems. However, keyword-based taxonomy reduces the system complexity while increasing the requirements of users' knowledge. On the other hand, much research has been conducted on representing image contents with visual features. Most of the applications represent images using low level visual features, such as color, texture, shape and spatial layout in a very high dimensional feature space, either globally or locally. However, the most popular distance metrics, for example, Euclidean distance, cannot guarantee that the contents are similar even their visual features are very close in the high dimensional feature space.
Feature-based representation of images using wavelet potentially offers an attractive solution to this problem. It involves a number of features extracted from raw images based on wavelet [1]. The features of images, such as edges of
an object, can be projected by the wavelet coefficients in low-pass and high-pass sub-bands [2]. The statistic of wavelet coefficients in low-pass bands is obviously different for different images. However, in high-pass bands, there is no big difference as shown later in this paper. This will make the classification unreliable.
Weibao Zou is with the Centre for Computing & Data Simulation, Shenzhen Institute of Advanced Technology, Chinese Academy of Sciences, Floor 3, Block A, Nanshan Medical Instruments Industry Park, 3rd Gongye Road, Shekou, Shenzhen, China (email: [email protected]).
Yan Li is with the Department of Mathematics and Computing, The University of Southern Queensland, QLD 4350, Australia (e-mail: [email protected]).
This study conducts a systematic investigation into the improvement of image classification using wavelet coefficients in low-pass bands only with structure-based neural network to organize a large image database.
The region-based representation of image contents is a potentially attractive solution to the problem of image processing and scene classification. Features and their spatial relationship among them play more important roles in characterizing image contents, because they convey more semantic meanings. Therefore, the image content can be better described by a tree-structure representation [3] [4].
Adaptive processing of data structures using neural networks is of paramount importance for structural pattern recognition and classification [5]. The main motivation of this adaptive processing is that neural networks are able to classify static information or temporal sequences and to perform automatic inferring or learning [6-8]. Sperduti and Starita have proposed supervised neural networks for classification of data structures [9]. This approach is based on using generalized recursive neurons and the Backpropagation Through Structure (BPTS) algorithm [5] [9] to encode data structures recursively that a copy of the same neural network is used to encode every node of the tree structure. Cho et al. improved the BPTS algorithm by optimizing the free learning parameters of the neural network in the node representation by using least-squares-based optimization methods in a layer-by-layer fashion, which not only makes convergence speed fast, but the long-term dependency problem is also overcome [3]. In this study, the improved BPTS algorithm is used. By organizing wavelet coefficients into a tree representation, image contents can be represented more comprehensively at various levels of details, which will be beneficial for image classification [2].
This section is followed by an introduction of the decomposition of an image by wavelet. The representation of an image and its feature sets for neural network are then described. The data sets for classification are given in Section V and the results of performance are reported and analyzed in Section VI. The conclusions are drawn in the final section.
Image Classification Using Wavelet Coefficients in
Low-pass Bands
Weibao Zou, Member, IEEE, and Yan Li, Member, IEEE
II. DECOMPOSITION OF AN IMAGE WITH WAVELET
[image:2.612.364.531.232.530.2]In order to extract the features of an image, as an application of the wavelet decomposition performed by a computer, a discrete wavelet transform is applied and is summarized in Fig. 1. The pyramid structure is also shown in Fig. 1 and its block chart shown in Fig. 2. From Fig. 2, it is noted that the original image (or previously low-pass results at level
j
) can be decomposed into a low-pass band ( ) and a high-pass band ( ) through filters at level1 + j L 1 + j
H j+1.
Through a low-pass filter and a high-pass filter, the low-pass band ( ) is again decomposed into a low-pass band ( ) and a high-pass band ( ). The high-pass band ( 1) is decomposed into a low-pass band ( 1) and a high-pass band ( ) through filters. Sub-bands , and
1 represent the characteristics of the image in the horizon,
vertical, and diagonal views, respectively. The local details of an image, such as edges of objects, are preserved in high-pass bands. The basic energy of the image is preserved in . We will refer to the four sub-bands created at each level of the decomposition as (Low/Low), (Low/High),
(High/Low), and (High/High).
1
+
j
L LLj+1
1
+
j
LH Hj+
+ j HL 1 + j
HH LHj+1 HLj+1
+ j HH 1 + j LL 1 + j
LL LHj+1
1
+
j
[image:2.612.101.254.382.517.2]HL HHj+1
Fig. 1. The pyramid structure of decomposing an image
Original image or previous low-pass results, at level j
L Decimate columns by 2 H Decimate columns by 2 1 + j H 1 + j L Decimate rows by 2 Decimate rows by 2 Decimate rows by 2 Decimate rows by 2 1 + j LL 1 + j LH 1 + j HL 1 + j HH at level j+1
[image:2.612.57.299.548.675.2]represents the convolution of the input image by the filter
Fig. 2. Block chart of wavelet decomposition of an image
III. REPRESENTATIONS OF A DECOMPOSED IMAGE
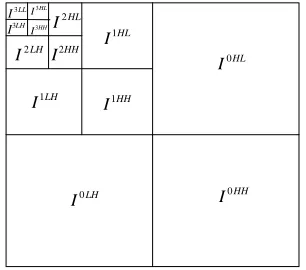
An image decomposed by wavelet can be represented by a
tree structure shown in Fig. 3. It is seen from Fig. 3(b) that, at level one ( ), the original image (the top image) is decomposed into four bands. The leftmost hand side in the line of 1 is the low-pass band ( ), and the three right ones are the high-pass bands ( 1, and ). At level two ( 2), the previous low-pass band is decomposed into four bands again. The leftmost hand side in the line of L2 is the
low-pass band ( ), and the other three ones are the high-pass bands (LH2, and ). Obviously, it can be
found that the basic energy and the edges of the object can be observed in low-pass bands and high-pass bands at each level, respectively. The same happens in Fig. 3(c).
1 L
L LL1
LH HL1 HH1
L
2 LL
2
HL HH2
(a) A pyramid structural representation;
LH
I0 I0HH
HL I0 HL I1 HH I1 HH I2 HL I2 HL I3 LH I1 LH I2 HH I3 LH I3 LL I3 1 L 2 L
(b) A tree representation of a decomposed image containing a boy
1
L
2
L
(c) A tree representation of a decomposed image containing grass
IV. DESCRIPTION OF FEATURE SETS WITH HISTOGRAMS OF
WAVELET COEFFICIENTS
The feature sets used as attributes for neural networks consist of wavelet coefficients. It is observed that wavelet coefficients corresponding to the edges of an object are greater than a certain value. Therefore, a threshold can be set. The wavelet coefficients which are greater than the threshold are selected into a feature set. These coefficients are projected onto the x-axis and y-axis, respectively. The edges of the object can be described by the distribution of the projections of wavelet coefficients, which are statistic by histograms with 8 bins in the x direction and 8 bins in the y direction. For example, for the high frequency bands, their features are represented by the histograms in x-axis and y-axis after wavelet coefficients are projected. A similar approach is applied to the low frequency bands. Actually, such histograms can effectively represent the outline of objects. However, for the original image, its histograms are the projections of the grey values of pixels. The tree representation of an image described by histograms of projections of wavelet coefficients is illustrated in Fig. 4.
(a) Histogram corresponding to Fig.3 (b)
[image:3.612.349.530.217.544.2](b) Histogram corresponding to Fig.3 (c)
Fig. 4. Histograms of projections of wavelet coefficients arranged in tree structures
Figs. 4(a) and (b) are the histograms corresponding to Figs. 3(b) and 3(c), respectively. Features described by wavelet coefficients can greatly improve the image classification [2]. However, from Figs. 4(a) and 4(b), it is clear that the histograms of projections of wavelet coefficients in high-pass bands are not very different. This will not benefit the performance of the classification. On the contrary, the histograms in low-pass bands are obviously different.
Therefore, it naturally leads to an idea that only the histograms of projections of wavelet coefficients in low-pass bands be used for classification could make the results more reliable.
V. DATA SETS
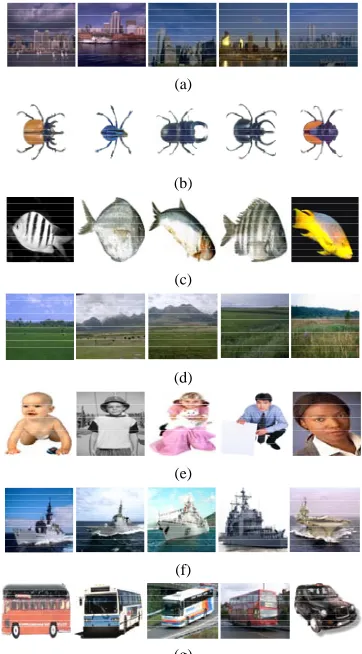
In order to prove the efficiency of the proposed method, a series of images are taken. There are seven categories of original images, namely, building, beetle, fish, grass, people, warship and vehicle, used in the experiments. In each category of images, there are ten independent images and five of them are shown in Fig. 5.
(a)
(b)
(c)
(d)
(e)
(f)
(g)
Fig. 5. Images for experiments: (a) Building; (b) Beetle; (c) Fish; (d) Grass; (e) People; (f) Warship; (g) Vehicle.
[image:3.612.95.262.324.590.2]for testing.
There are two groups of experiments for comparison. Different features are adopted in each group. In the first group, the wavelet coefficients in low-pass and high-pass bands are used together as feature sets. In the second group, the wavelet coefficients in low-pass bands only are used as features. The wavelet coefficients in high-pass bands are set to zeroes. The neural network adopted is based on structure improved by Cho et al. and the details can be referred to [3].
TABLEI
IMAGE DATABASES FOR EXPERIMENTS Category
of image
The number of original image in each
category
The number of derived images
from an independent
image
The number of images in each category after
image translation
Building 10 40 400
Beetle 10 40 400
Fish 10 40 400
Grass 10 40 400
People 10 40 400
Warship 10 40 400
Vehicle 10 40 400
Total
number 70 280 2800
VI. RESULTS AND ANALYSIS A. Results of the Performance
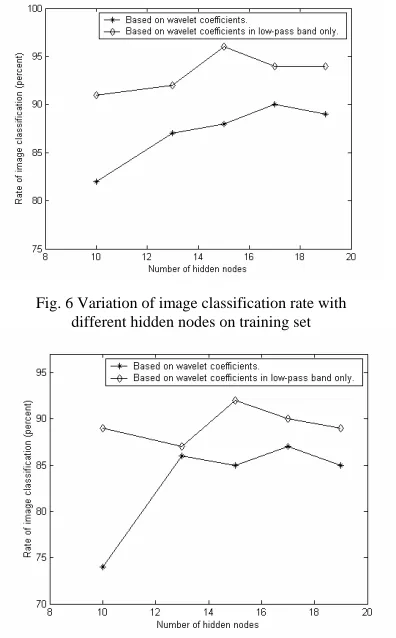
The results of the classification are reported in this section. A vector of 16 inputs defined by histograms derived by the proposed method is the attributes of all the nodes in the tree. In this investigation, a single hidden-layer of the neural network is sufficient for the neural classifier, which has 16 input nodes and 7 output nodes. Since the number of hidden nodes affects the result, a series of different numbers of the hidden nodes are tested in the experiments in order to get the best result. The classification rates on training set and testing set are shown in Tables II and III. A graphical presentation of Table II is shown in Fig. 6 and Table III in Fig. 7.
TABLEII
CLASSIFICATION RESULTS WITH DIFFERENT HIDDEN NODES ON TRAINING SET
Number of hidden nodes
Classification rate on training set with wavelet coefficients (%)
Classification rate on training set with wavelet coefficients in low pass-band only (%)
Improve d rate
(%)
10 82 91 10.98
13 87 92 5.75
15 88 96 9.09
17 90 94 4.44
19 89 94 5.62
B. Analysis of the Results
From Table II and Fig. 6, it is observed that the classification rate on training set with wavelet coefficients in low-pass bands only is up to 96% while the rate with all
wavelet coefficients is 90%. Obviously, the former is better than the latter and the rate is greatly improved. It is also noticed that when the number of hidden nodes is 15, the classification rate by wavelet coefficients in low-pass band only is the best.
TABLEIII
CLASSIFICATION RESULTS WITH DIFFERENT HIDDEN NODES ON TESTING SET Number of
hidden nodes
Classification rate on testing set with
wavelet coefficients (%)
Classification rate on testing set with wavelet coefficients in low-pass
band only (%)
Improv ed rate (%)
10 74 89 20.27
13 86 87 1.16
15 85 92 8.24
17 87 90 3.45
19 85 89 4.71
[image:4.612.62.292.184.342.2]With the trained neural network, the testing is carried out with another set of images not included in our training set. From Table III and Fig. 7, it is seen that the classification rate with wavelet coefficients in low-pass bands only is up to 92%. For 17 hidden nodes, its classification rate is the second best. With all wavelet coefficients, the rate is 87%. For 15 hidden nodes, the latter classification rate is the best. Obviously, based on the proposed method, the neural network is strong enough for classifying many categories of images and the classification rate is greatly improved.
Fig. 6 Variation of image classification rate with different hidden nodes on training set
[image:4.612.340.538.392.711.2] [image:4.612.50.303.556.660.2]VII. CONCLUSION
A method based on wavelet coefficients in low-pass bands only is proposed for the image classification with adaptive processing of data structures to organize a large image database in this paper. We describe the classification features including features extracted with wavelet, histogram of projections of wavelet coefficients and tree structural image representation. We use 16 bins of histograms as the input attributes for a neural network. There are 1470 images used for training the neural network. Based on the proposed method, the classification rate on training set is improved by 11%. Using such a trained neural network, with another 1470 images, the testing is carried out and its classification rate is improved by 20%. From the results, it is found that:
(1) the classification rate can be greatly improved using wavelet coefficients in low-pass bands only;
(2) the effects of the number of hidden nodes on the classification rate is significant but non-linear. When the number of hidden nodes is 15, optimal results can be achieved. There is a trade-off between the classification rate and the computational complexity, of course.
The above conclusions are based on the experiments with structured-based neural network.
ACKNOWLEDGMENT
The work described in this paper was partly supported by a grant from the Research Grants Council of the Hong Kong Special Administrative Region, China (Project no. PolyU 5229/03E).
REFERENCES
[1] A. Cohen and R. D. Ryan: Wavelets and Multiscale Signal Processing. Chapman & Hall Press, 1995.
[2] W. Zou, K. C. Lo and Z. Chi, “Structured-based Neural Network Classification of Images Using Wavelet Coefficients,” Proceedings of Third International Symposium on Neural Networks (ISNN), Lecture Notes in Computer Science 3972: Advances in Neural Networks-ISNN2006, Chengdu, China, May 28-June 2, 2006, part II, pp. 331-336, Springer-Verlag.
[3] S. Y. Cho, Z. R. Chi, W. C. Siu and A. C. Tsio, “An improved algorithm for learning long-term dependency problems in adaptive processing of data structures,” IEEE Trans. On Neural Network, vol. 14, pp 781-793, July, 2003.
[4] S. Y. Cho and Z. R. Chi, “Genetic evolution processing of data structures for image classification,” IEEE Trans. On Knowledge and Data Engineering, vol. 17, pp. 216-231, Feb. 2005.
[5] C. L. Giles and M. Gori, Adaptive Processing of Sequences and Data Structures, Springer, Berlin New York, 1998.
[6] A. C. Tsoi: Adaptive Processing of Data Structures: An Expository Overview and Comments. Technical report, Faculty of Informatics, University of Wollongong, Australia, 1998.
[7] A. C. Tsoi, M. Hangenbucnher, “Adaptive Processing of Data Structures,” Keynote Speech, Proceedings of Third International Conference on Computational Intelligence and Multimedia Applications (ICCIMA '99), 1999, 2-2 (summary).
[8] P. Frasconi, M. Gori and A. Sperduti, “A General Framework for Adaptive Processing of Data Structures,” IEEE Trans. on Neural Networks vol. 9, pp 768-785, 1998.
[9] A. Sperduti and A. Starita, “Supervised Neural Networks for Classification of Structures,” IEEE Trans. on Neural Networks, vol. 8(3), pp. 714-735, 1997.
[10] C. Goller and A. Kuchler, “Learning Task-dependent distributed representations by Back-propagation Through Structure,” Proc. IEEE Int. Conf. Nerual Networks, 1996, pp. 347-352.
[11] S. Cho, Z. Chi, Z. Wang and W. Siu, “An Efficient Learning Algorithm for Adaptive Processing of Data Structure,” Neural Processing Letters
vol. 17, pp. 175-190, 2003.
[12] F. Costa, P. Frasconi, V. Lombardo and G. Soda, “Towards Incremental Parsing of Natural Language Using Recursive Neural Networks”,