UNIVERSITY OF SOUTHERN QUEENSLAND, AUSTRALIA
ANALYSIS AND CLASSIFICATION OF EEG SIGNALS
A Dissertation Submitted by
Siuly
For the Award of
Doctor of Philosophy
i
Electroencephalography (EEG) is one of the most clinically and scientifically exploited signals recorded from humans. Hence, its measurement plays a prominent role in brain studies. In particular, the examination of EEG signals has been recognized as the most preponderant approach to the problem of extracting knowledge of the brain dynamics. EEG recordings are particularly important in the
diagnosis of epilepsy and in brain computer interface (BCI). In BCI systems, EEG
signals help to restore sensory and motor functions in patients who have severe motor disabilities. Analysing EEG signals is very important both for supporting the diagnosis of brain diseases and for contributing to a better understanding of cognitive process.
Although EEG signals provide a great deal of information about the brain, research in classification and evaluation of these signals is limited. Even today the EEG is often examined manually by experts. Therefore, there is an ever-increasing need for developing automatic classification techniques to evaluate and diagnose neurological disorders. Classification techniques can help to differentiate EEG segments and to decide whether a person is healthy. A big challenge is for BCI systems to correctly and efficiently identify different EEG signals of different motor imagery (MI) tasks using appropriate classification algorithms to assist motor disabled patients in communication.
In this dissertation, we aim to develop methods for the analysis and classification of epileptic EEG signals and also for the identification of different categories of MI tasks based EEG signals in BCI’s development.
ii
neurological disorders, mental or physiological problems.
In BCI systems, if the MI tasks are reliably distinguished through identifying typical patterns in EEG data, motor disabled people could communicate with a device by composing sequences of these mental states. In this dissertation, for the identification of MI tasks in BCI applications, we developed three methods:
(1) Cross-correlation based logistic regression (CC-LR). (2) Modified CC-LR with diverse feature sets.
(3) Cross-correlation based least square support vector machine (CC-LS-SVM). The experimental results have demonstrated the effectiveness of the methods for the identification of MI tasks. These techniques can assist clinical diagnoses and rehabilitation tasks.
Finally we investigated two issues for the MI classification: (1) Which algorithm performed better.
(2) Which EEG data is more suitable for getting information about MI tasks. Is it the motor area data or the all-channels data?
iii
I hereby declare that the work presented in this dissertation is my own and is, to the best of my knowledge and belief, original except as acknowledged in the text. This dissertation has not previously been submitted either in whole or in part for a degree at this or any other university.
Signed (Siuly)
Date:
Signed Date:
(Principal Supervisor) (Associate Professor Yan Li)
Signed Date:
(Associate Supervisor)
iv
First of all, I would like to thank almighty Allah, for His guidance and strength. I would like to express my sincere gratitude and appreciation to my supervisor, Associate Professor Yan Li, for her continuous inspiration, support, guidance, encouragement, advice, patience, and individual feedback throughout the course of my PhD study. She was an approachable supervisor who motivated me to achieve my goals. I feel very grateful and blessed to have worked under her supervision. I would not imagine carrying out this research without her constant support and help. I would also like to express my sincere gratitude and appreciation to my associate supervisor Associate Professor Peng (Paul) Wen, for his continuous encouragement, support, valuable advice, and suggestions.
I gratefully acknowledge the University of Southern Queensland (USQ) for offering me the 2009 USQ Postgraduate Research Scholarship to perform this research successfully, without which, this work would not have been possible.
I would also like to thank Professor Mark Sutherland, Director of Centre for Systems Biology (CSBi) for granting me half-tuition fees support, and supporting me to attend conferences.
I would also like to thank to all of the staff in the Department of Mathematics and Computing for their co-operation. I would also like to express my gratitude and appreciation to my postgraduate colleagues in our research group for their discussions, comments and advice, especially during our group seminars. I would also like to thank all of my friends for their encouragement and supports.
v
Abstract i
Certification of Dissertation iii
Acknowledgements iv
Contents v
List of Figures x
List of Tables xiv
Publications Based on This Dissertation xviii
1 Introduction 1
1.1 Overview and Motivation of the Study 2
1.2 Problem Statements 3
1.3 Contributions of the Dissertation 4
1.4 Structure of the Dissertation 8
2 Overview of EEG signal classification and its background knowledge
10
2.1 Background knowledge related to EEG signals 10
2.1.1 Human Brain 11
2.1.1.1 Brain structures and their functions 11 2.1.1.2 Human brains’ neurophysiology 12
2.1.2 Electroencephalography (EEG) 15
2.1.2.1 Nature or rhythms of the EEG signals 18 2.1.3 Epilepsy, epileptic seizures and their effects on EEG
signals
20
2.1.4 Concept of Brain Computer Interfaces (BCIs) 21
2.1.4.1 Architecture of BCI systems 22
2.1.4.2 Application of BCI systems 24
2.2 Overview of EEG signal classification 25
2.2.1 Concept of classification 25
vi
2.2.2.2 Unsupervised classification 28
2.2.3 Structure of classification 29
2.2.4 Common used methods of the EEG signal classification 30 2.2.4.1 Methods used in the epileptic EEG
classification
30
2.2.4.2 Methods used in the MI based EEG classification in BCI systems
32
2.3 Summary 35
3 Two-stage Random Sampling with Least Square Support Machine 37
3.1 Introduction 37
3.2 Related Work 39
3.3 Methodology 41
3.3.1 Random sample and sub-sample selection using SRS technique
42
3.3.2 Feature extraction from different sub-samples 43 3.3.3 Least square support vector machine (LS-SVM) for
classification
44
3.3.4 Performance evaluation 46
3.4 Experimental Data 47
3.4.1 EEG epileptic data 47
3.4.2 Mental imagery tasks EEG data 49
3.4.3 Two-class synthetic data 50
3.5 Experimental Results and Discussions 50
3.5.1 Results for the EEG epileptic dataset 50 3.5.2 Results for the mental imagery tasks EEG dataset 55 3.5.3 Results for the two-class synthetic data 57
3.6 Conclusions 59
4 Clustering Technique based Least Square Support Vector Machine
61
vii
4.2 Proposed Methodology 64
4.2.1 Clustering technique (CT) for feature extraction 64 4.2.1.1 Stage 1: Determination of clusters 65 4.2.1.2 Stage 2: Determination of sub-clusters 65 4.2.1.3 Stage 3: Statistical feature extraction 66
4.3 Experimental Data 66
4.4 Implementation of the proposed CT-LS-SVM algorithm 67
4.5 Experimental Results and Discussions 70
4.5.1 Classification results for the mental imagery tasks EEG data
71
4.5.2 Classification results for the EEG epileptic data 75 4.5.3 Classification results for the motor imagery EEG data 79
4.6 Conclusions 82
5 Cross-correlation based Logistic Regression Method for Classification of MI Tasks
84
5.1 Introduction 84
5.2 Theoretical Background 87
5.2.1 Cross-correlation technique 87
5.2.2 Logistic regression model 88
5.3 Proposed Methodology 90
5.3.1 Feature extraction using cross-correlation (CC) technique 90 5.3.2 MI tasks signal classification by logistic regression (LR) 92
5.3.3 Performance evaluation methods 92
5.3.3.1 k-fold cross validation method 92
5.3.3.2 Classification accuracy 93
5.3.3.3 Confusion matrix 93
5.3.4 Experimental Data 93
5.4 Results and Discussions 94
5.4.1 Classification results for dataset IVa 94 5.4.2 Classification results for dataset IVb 100
viii
6 Modified CC-LR Algorithm with Diverse Feature Sets 104
6.1 Background 104
6.2 Methodology 106
6.3 Experimental Evaluation and Discussions 109
6.3.1 Implementation of the CC technique for the feature extraction
109
6.3.2 MI classification results testing different features 114
6.3.3 A comparative study 120
6.4 Conclusions and Recommendations 122
7 LS-SVM with Tuning Hyper Parameters: Improving Prospective Performance in the MI task Recognition
123
7.1 Introduction 124
7.2 Review of the existing classification techniques 126
7.3 Proposed Method 128
7.3.1 Reference signal selection 129
7.3.2 Computation of a cross-correlation sequence 130
7.3.3 Statistical feature extraction 133
7.3.4 Classification 133
7.4 Performance Evaluation 135
7.5 Experiments and Results 136
7.5.1 Tuning the hyper parameters of the LS-SVM classifier 137 7.5.2 Variable selections in the logistic regression and kernel
logistic regression classifiers
140
7.5.3 Performances on both datasets 141
7.5.4 Performance comparisons with the existing techniques 148
7.6 Conclusions 149
8 An Investigation Study 152
8.1 Background 152
8.2 Review of the existing research 154
ix
8.4.1 Results for dataset IVa 159
8.4.2 Results for dataset IVb 165
8.5 Conclusions and Contributions 166
9 Conclusions and Future Work 168
9.1 Summary and Conclusions of the Dissertation 168
9.2 Future work 174
References 176
x
No Title Page
Figure 2.1 Anatomical areas of the brain 12
Figure 2.2 A simple structure of neuron 13
Figure 2.3 A single cortical pyramidal cell showing the current flow that contributes to the surface EEG during a net excitatory input
14
Figure 2.4 First recording of EEG signals made by Hans Berger 16 Figure 2.5 The international 10-20 electrode placement system 17 Figure 2.6 Example of different types of normal EEG rhythms 19 Figure 2.7 A general architecture of a BCI system 23 Figure 2.8 Mutually exclusive training and testing set 28 Figure 2.9 Process of signal classification in the biomedical
engineering
29
Figure 3.1 Block diagram of the SRS-LS-SVM method for EEG signal classification
41
Figure 3.2 Random samples and sub-sample selection diagram using SRS technique
42
Figure 3.3 Example of five different sets of EEG signals taken from different subjects
48
Figure 3.4 Exemplary EEG signals for left hand movements (class 1), right hand movements (class 2) and word generation (class 3) taken from Subject 1
49
Figure 3.5 Exemplary mean feature points obtained by the SRS from healthy subjects with eyes open (Set A)
51
Figure 3.6 Exemplary mean feature points obtained by the SRS from epileptic patients during seizure-free intervals within the hippocampal formation of the opposite hemisphere of the brain (Set C)
51
xi
Figure 3.8 ROC curve for healthy subjects with eye open (Set A) and epileptic patients during seizure activity (Set E) in the EEG epileptic data
55
Figure 3.9 Exemplary mean feature points obtained by the SRS from left hand movements (class 1) of Subject 1
56
Figure 4.1 Block diagram of the proposed methodology for EEG signal classification
64
Figure 4.2 Clustering technique diagram for obtaining different clusters, sub-clusters and statistical features
65
Figure 4.3 Comparison of execution time between the CT-LS-SVM and SRS-LS-SVM methods for the mental imagery tasks EEG data
74
Figure 4.4 Comparison of execution time between the CT-LS-SVM and SRS-LS-SVM methods for the EEG epileptic data
77
Figure 4.5 Comparison of execution time between the CT-LS-SVM and SRS-LS-SVM methods for the motor imagery EEG data
80
Figure 5.1 Example of a typical cross-correlogram 88 Figure 5.2 The typical signals of the RH and the RF MI tasks for
each subject of dataset IVa
95
Figure 5.3 The typical cross-correlograms for the RH and the RF MI signals of each subject in dataset IVa
96
Figure 5.4 Classification plots for the 1-fold of subject 1 in dataset IVa
98
Figure 5.5 Performance comparisons of four other existing methods of the literature with the proposed CC-LR method
100
Figure 5.6 The typical signals and cross-correlograms for the RF and the LH MI signals of dataset IVb
101
Figure 5.7 Classification plot for the 1-fold of dataset IVb 102 Figure 6.1 Schematic diagram for the classification of the MI based
EEG signal in BCIs
106
xii
Figure 6.3 The typical cross-correlograms for the RH and the RF MI signals of S1 of dataset IVa
111
Figure 6.4 The typical cross-correlograms for the RH and the RF MI signals of S2 of dataset IVa
111
Figure 6.5 The typical cross-correlograms for the RH and the RF MI signals of S3 of dataset IVa
112
Figure 6.6 The typical cross-correlograms for the RH and the RF MI signals of S4 of dataset IVa
112
Figure 6.7 The typical cross-correlograms for the RH and the RF MI signals of S5 of dataset IVa
113
Figure 6.8 The typical cross-correlograms for the RF and the LH MI signals of dataset IVb
114
Figure 6.9 Correct classification rate for the two features set, the four features set and the six features set in each of the three folds for: (a) S1 (b) S2 (c) S3 (d) S4 (e) S5 in dataset IVa. Error bars indicate standard deviation
117-119
Figure 6.10 Correct classification rate for the two features set, the four features set and the six features set for each of the three folds in dataset IVb. Error bars indicate standard deviation
120
Figure 7.1 Fundamental structure of brain computer interface (BCI) 124
Figure 7.2 Block diagram of the proposed CC-LS-SVM technique for the
MI EEG signal classification in BCIs development
129
Figure 7.3 Typical reference signals: (A) Dataset IVa and (B) Dataset
IVb
129
Figure 7.4 Typical right hand and right foot MI signals and their
respective cross-correlograms for subject aa indataset IVa
131
Figure 7.5 Typical right foot and left hand MI signals and their respective
cross-correlograms for dataset IVb
132
Figure 7.6 Partitioning design of the obtained feature vectors for the
10-fold cross-validation method
136
Figure7.7 (A) Process of the two-step grid search for optimizing the
parameters γ (gamma) and σ2(sig2) of the LS-SVM
xiii
Figure 7.7 (B) Process of the two-step grid search for optimizing the
parameters γ (gamma) and σ2(sig2) of the LS-SVM
classifier in the 1-fold of dataset IVb
139
Figure 7.8 Comparisons of the individual classification accuracies among
the logistic regression, kernel logistic regression and the
LS-SVM for each of the 10-folds: (a) subject aa (b) subject al (c)
subject av (d) subject aw (e) subject ay in dataset IVa
142-143
Figure 7.9 Comparisons of the individual classification accuracies among
the logistic regression, kernel logistic regression and the
LS-SVM for each of the 10-folds in dataset IVb
144
Figure 8.1 Locations of electrodes for datasets IVa and IVb in BCI
Competition III. 118 electrodes are shown labelled according
to the extended international 10/20 system
157
Figure 8.2 Comparison of the performance between the motor area EEG
and the all-channels EEG data for the CC-LS-SVM algorithm.
The vertical lines show the standard errors of the test
accuracies
161
Figure 8.3 Comparison of the performance between the motor area EEG
and the all-channels EEG data for the CC-LR algorithm. The
vertical lines show the standard error of the test accuracies
162
Figure 8.4 Comparison of the performance between the motor area EEG
and the all-channels EEG data for the CC-KLR algorithm. The
vertical lines show the standard error of the test accuracies
163
Figure 8.5 The comparison of the performance for the LS-SVM,
CC-LR and CC-KCC-LR algorithms between the motor area data and
the all-channels data. The vertical lines show the standard
errors of the test accuracies
xiv
No Title Page
Table 3.1 Experimental results and the area values under ROC curve for two-class pairs of the EEG signals for the EEG epileptic database
53
Table 3.2 Comparison of performance of our proposed method with two most recently reported methods for Set A and Set E of the EEG epileptic database
54
Table 3.3 Number of recorded values in four sessions from the mental imagery tasks EEG data (Data set V for BCI competition III)
56
Table 3.4 Experimental results for different pairs of two-class EEG signals for the mental imagery tasks EEG data (Data set V for BCI competition III)
57
Table 3.5 The original two-class synthetic data from Ripley (1996) and the extracted feature vectors by the SRS technique
58
Table 3.6 Confusion matrix for Ripley data (1996) 58 Table 3.7 Experimental results for the Ripley data (1996) 59 Table 4.1 The number of recorded values in four sessions from the
mental imagery tasks EEG data
68
Table 4.2 The number of clusters and sub-clusters and time period for each cluster and sub-cluster of a class for a subject for the mental imagery tasks EEG data
68
Table 4.3 The number of clusters and sub-clusters and time period for each cluster and sub-cluster of a class for a subject for the motor imagery EEG data
69
Table 4.4 Performance comparison of the proposed CT-LS-SVM versus the SRS LS-SVM for different pairs of two-class EEG signals from the mental imagery tasks EEG data
72
xv imagery tasks EEG data
Table 4.6 Performance comparison of different methods with the proposed CT-LS-SVM algorithm for the mental imagery tasks EEG data
74
Table 4.7 Performance comparison of the proposed CT-LS-SVM versus the SRS-LS-SVM method for different pairs of two-class EEG signals from the EEG epileptic data
76
Table 4.8 Classification accuracy of the proposed CT-LS-SVM method by the 10-fold cross validation for the EEG epileptic data
77
Table 4.9 The obtained performance with our proposed CT-LS-SVM method and other methods from the literature for healthy subjects with eyes open (Set A) and epileptic patients during seizure activity (Set E) of the EEG epileptic data
78
Table 4.10 Performance comparison between the CT-LS-SVM and SRS-LS-SVM for the motor imagery EEG data
79
Table 4.11 Classification accuracy of the CT-LS-SVM method by the 10-fold cross validation for the motor imagery EEG data
80
Table 4.12 Comparison of classification accuracy for the motor imagery EEG data with other EEG signal classification attempts
81
Table 4.13 Summary results of the proposed CT-LS-SVM approach and the SRS-LS-SVM method for the mental imagery tasks EEG data, the EEG epileptic data and the motor imagery EEG data.
82
Table 5.1 The information of original data for BCI Competition III, dataset IVa
95
Table 5.2 The 3-fold cross validation results by the CC-LR method on testing set for dataset IVa of BCI Competition III
97
xvi
Table 5.4 Performance comparison of the CC-LR algorithm with the R-CSP with aggregation and the CT-LS-SVM algorithms for dataset IVa, BCI III
99
Table 5.5 The 3-fold cross validation results by the proposed method on testing set for dataset IVb of BCI Competition III
101
Table 5.6 Confusion matrix for the 1-fold of dataset IVb 102 Table 6.1 Cross-validation results with the modified CC-LR
method on testing set for dataset IVa
116
Table 6.2 Cross validation results by the proposed method on testing set for dataset IVb
119
Table 6.3 Comparison of the classification performance between our proposed algorithm and the most recent reported eight algorithms for dataset IVa in BCI Competition III
121
Table 7.1 Optimal values of the parametersγ and 2
σ of the LS-SVM for dataset IVa
139
Table 7.2 Optimal values of the parametersγ and 2
σ of the LS-SVM for dataset IVb
140
Table7. 3 Classification results by the 10-fold cross-validation method on testing set of dataset IVa
141
Table 7.4 Classification results by the 10-fold cross-validation method on testing set of dataset IVb
144
Table 7.5 Classification results of the three classifiers for the nine features and the six features for the reference signals, Fp1 and C3, in dataset IVa
146
Table 7.6 Classification results of the three classifiers for the nine features and the six features for the reference signals, Fp1 and C3, in dataset IVb
148
Table 7.7 Performance comparisons for dataset IVa 149 Table 8.1 Experimental results of the three algorithms reported in
percentage (mean ± standard deviation) for dataset IVa
160
xvii
Table 8.3 The comparison of our three algorithms with two existing methods for the all-channels data in dataset IVa
164
Table 8.4 Experimental results of the three algorithms reported in terms of the 3-fold cross validation accuracy (mean ± standard deviation) for dataset IVb
xviii
1. Siuly, Li, Y., (2012) ‘Improving the separability of motor imagery EEG signals using a cross correlation-based least square support vector machine for brain computer interface’, IEEE Transactions on Neural Systems and Rehabilitation
Engineering, DOI (identifier) 10.1109/TNSRE.2012.2184838, in press. (ERA A*,
2010)
2. Siuly, Li, Y. and Wen, P. (2011) ‘Clustering technique-based least square support vector machine for EEG signal classification’, Computer Methods and Programs in
Biomedicine, Vol. 104, no. 3, pp. 358-372. (ERA A*, 2010)
3. Siuly, Li, Y. and Wen, P. (2011) ‘Identification of Motor Imagery Tasks through CC-LR Algorithm in Brain Computer Interface’, International Journal of
Bioinformatics Research and Applications for publication, 2011 (in press). (ERA B,
2010)
4. Siuly, Li, Y. and Wen, P. (2011) ‘EEG signal classification based on simple random sampling technique with least square support vector machines’, International
journal of Biomedical Engineering and Technology, Vol. 7, no. 4, pp. 390-409.
(ERA C, 2010)
5. Siuly, Li, Y. and Wen, P. (2010) ‘Analysis and classification of EEG signals using a hybrid clustering technique’, The proceedings of the 2010 IEEE/ICME
International Conference on Complex Medical Engineering (CME2010). pp. 34–39.
6 Siuly, Li, Y. and Wen, P. (2009) ‘Classification of EEG signals using Sampling Techniques and Least Square Support Vector Machines’, The proceedings of Fourth International Conference on Rough Sets and Knowledge Technology (RSKT 2009),
xix
with Cross-Correlation for Motor Imagery Signal Recognition’, The proceedings of the 2011 IEEEIICME International Conference on Complex Medical Engineering
May 22 - 25, Harbin, China, pp. 502-507.
8. Siuly, Li, Y. and Wen, P., (2011) ‘Comparisons between Motor Area EEG and all-Channels EEG for Two Algorithms in Motor Imagery Task Classification’, submitted to the International Journal of Intelligent Systems Technologies and
Applications for publication, February 2012. (ERA B, 2010)
9. Siuly, Li, Y. and Wen, P., (2012) ‘Modified CC-LR algorithm with three diverse feature sets for motor imagery tasks classification in EEG based brain computer interface’, submitted to the Journal of Applied Mathematics and Computation,
1
CHAPTER 1
INTRODUCTION
The human brain is the control centre of the body. It is responsible for perception, cognition, attention, emotion, memory and action (Carlson, 2002a; Purves et al., 2004). When a person is thinking, reading or watching television different parts of the brain are stimulated. This creates electrical signals, which, together with chemical reactions, let the parts of the body communicate. These electrical signals can be monitored through scientific techniques such as electroencephalography (EEG), electrocorticography (ECoG), magnetic resonance imaging (MRI), functional magnetic resonance imaging (fMRI), positron emission tomography (PET) and single photo emission computed tomography (SPECT). The aforementioned scientific techniques help us to gain a better understanding of what role the human brain plays whilst an individual is performing a number of tasks. EEG is the most used technique to capture brain signals due to its excellent temporal resolution, non-invasiveness, usability, and low set-up costs (Blankertz, et al., 2008; Grosse-Wentrup et al. 2009). An EEG can show what state a person is in, whether in sleep, awake, anaesthetized, because the characteristic patterns of the electrical potentials differ for each of these states.
2
computer interface (BCI). We propose two algorithms for the classification of
epileptic EEG signals and three algorithms for the identification of motor imagery (MI) task based EEG signals in BCI developments.
These proposed methods can distinguish different categories of EEG signals and provide valuable information about brain states. Our proposed methods will be useful for neurologists to identify the brain diseases correctly and efficiently using the typical patterns of EEG signals. The outcomes of this study will also help to improve the quality of life of patients with brain disorders.
1.1 Overview and Motivation of the Study
The electroencephalography (EEG) is a recording of electrical activity along the scalp generated by the cerebral cortex nerve cells of the brain (Niedermeyer and Silva, 2005). The waveforms recorded are thought to reflect the activity of the surface of the brain. These signal’s parameters and patterns indicate the health state of the brain. In Chapter 2, a detailed discussion about EEG is provided. EEG is one of the most clinically and scientifically exploited signals recorded from humans. Hence, its quantification plays a prominent role in brain studies. In particular, the assessment of EEG signals has been very popular to recognize the problem of extracting the knowledge of the brain dynamics and thus it has been heavily exploited in the study of the brain phenomena related to motor imagery.
The two main applications of EEG recordings are in epilepsy and brain
computer interface (BCI). Epilepsy is a common chronic neurological disorder
3
events. In recent years, increasing attention has been devoted to the classification of motor imagery (MI) task problems related to BCI applications as MI activities represent an efficient mental strategy to operate a BCI system. A MI task may be seen as a mental rehearsal of a motor act such as movements of hands, feet, fingers and tongue without any overt motor activity (Kayikcioglu and Aydemir, 2010; Thomas et al., 2009). Each MI task is usually treated as a class of data category. A detailed discussion of BCI systems can be found in Chapter 2.
Since EEG signals provide significant contributions in biomedical science, a careful analysis of the EEG records are needed to provide valuable insight and to improve understanding about it. One challenge in the current biomedical research is how to classify time-varying electroencephalographic (EEG) signals as accurately as possible. Several classification methods are reported to identify different neurological diseases and also to recognize diverse mental states of disabled people using the typical patterns of the EEG signals. Currently, the classification of EEG signals in epileptic activities and MI tasks based BCIs are still far from being fully understood. A considerable amount of neuroscience research is still required to achieve this goal. Hence, in this dissertation, we aim to develop methods to classify the brain activities in these two areas.
1.2 Problem Statements
4
task of a communication, it is a big challenge for BCI systems to properly and efficiently recognize the intension’s patterns of the brain using appropriate classification algorithms.
The design of an effective classification system is complex given the high variability of the EEG signals in the presence of different subjects and target events (classes). In recent years, a variety of computerized-analysis methods have been developed to extract the relevant information from EEG recordings and identify different categories of EEG data. From the literature, it’s observed that most of the reported methods had a limited success rate. Some methods took more time to perform the required computation work and others were very complex for practical applications. Some methods used small sample setting (SSS) data points as the representative of a large number of data points of EEG recordings. Generally they were not representative enough for the EEG signal classification. On the other hand, in most of the cases, the reported methods did not select their parameters using a suitable technique, although the parameters significantly affect the classification performance. To our knowledge, the researchers did not investigate which EEG data (motor area EEG data or all-channels EEG data) is better for providing more information about the MI tasks signal classification.
To explore these issues, in this dissertation, two methods were proposed for the epileptic EEG signals classification and these were also implemented on mental imagery tasks EEG data to evaluate performances. A further three algorithms were introduced for the classification of MI tasks EEG signals in the BCIs development. Finally, we investigated which algorithm and which EEG data are able to provide more information during the classification of MI EEG signals.
1.3 Contributions of the Dissertation
5
activities. To investigate the performances of those techniques, we also compare our proposed algorithms with other recently reported algorithms. This manuscript describes the work we carried out in order to address the three objectives:
1: Developing methods for the classification of the epileptic EEG signals which improve the classification rate with less execution time.
2: Introducing methods to identify EEG signals during MI tasks.
3: Investigating which algorithm and which EEG data (motor area data or all- channels data) are better for the MI signal classification.
A brief discussion of these three points is provided below.
1: Developing methods for the classification of the epileptic EEG signals
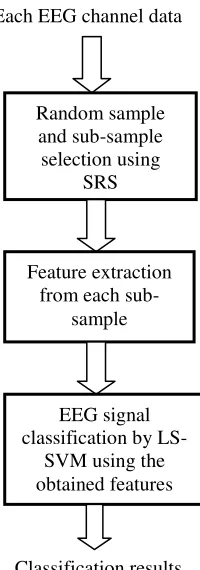
In order to classify the epileptic EEG signals, we developed two new approaches: (1) Simple random sampling technique based least square support vector machine (SRS-LS-SVM).
(2) Clustering technique based least square support vector machine (CT-LS-SVM).
For the experimental evaluation, these two algorithms were implemented on EEG
epileptic data. In order to further evaluate the performance of those two methods, the
SRS-LS-SVM algorithm was employed on mental imagery tasks EEG data and
Ripley data, and the CT-LS-SVM method on mental imagery tasks EEG data and
motor imageryEEG data.
Method 1 (SRS-LS-SVM): In this method, we utilized a two-stage simple random sampling (SRS) procedure to obtain representative features from original EEG data. Then we used these features as the input to the least square support vector machine (LS-SVM) to classify two classes of the EEG signals. In the two-stage SRS technique, the sample and sub-sample sizes were determined using a sample size calculator of the “Creative Research System” considering 99-100% confidence interval and 99% confidence level. The experimental results demonstrate that the proposed approach has significant advantages over many other existing methods.
6
In this research, we evaluated the performance of the CT-LS-SVM against the SRS-LS-SVM on the basis of the accuracy and the execution time. The experimental results showed that the CT-LS-SVM approach performed better than the SRS-LS-SVM method with respect to accuracy, and the CT-LS-SRS-LS-SVM algorithm takes much less time than the SRS-LS-SVM. The classification performances of the CT-LS-SVM method are also higher than the recently reported algorithms. This method helps neurologists and researchers to identify the epileptic EEG signals.
2: Introducing methods to identify EEG signals during MI tasks
In this dissertation, we further developed three algorithms for the classification of MI tasks EEG signals:
(1) Cross-correlation based logistic regression (CC-LR). (2) Modified CC-LR with diverse feature sets.
(3) Cross-correlation based least square support vector machine (CC-LS-SVM).
The proposed methods were tested on two benchmark datasets, IVa and IVb of BCI Competition III, and the performances of each method were evaluated through a k -fold cross-validation procedure.
Method 3 (CC-LR): We developed a CC-LR algorithm combining cross-correlation (CC) technique and logistic regression (LR) classifier. In this algorithm, we used a cross-correlation (CC) technique for the feature exaction, and a logistic regression (LR) classifier for the classification of those MI features. We considered randomly the signal of Fp1 electrode position (in the international 10-20 system) as a reference signal for the CC technique.
7
Method 5 (CC-LS-SVM): To improve the separability of the MI tasks classification, we developed novel algorithm called CC-LS-SVM, tuning hyper parameters of the LS-SVM method. In this approach, we applied a cross-correlogram based feature extraction procedure for the MI tasks signals, and developed a LS-SVM for the classification of the extracted MI features. To verify the effectiveness of the LS-SVM classifier, we replaced the LS-SVM classifier by a logistic regression (LR) classifier and a kernel logistic regression (KLR) classifier, separately, with the same features extracted from the cross-correlation technique. As the parameters of the LS-SVM can significantly affect the classification performance, we used a two-step grid search algorithm for selecting optimal combinations of parameters of the LS-SVM classifier. In order to report the performance for different reference signals, we used two reference signals, Fp1 and C3, and then decided which EEG channel signal is better for reference. We also added a further three features into the existing features to compare performance. This method offers great potential for the development of MI-based BCI analyses which assist clinical diagnoses and rehabilitation tasks.
3: Investigating which algorithm and which EEG data (motor area data or all-channels data) are better for the MI signal classification
In this dissertation, we investigated which algorithm is the best for the MI tasks classification and which EEG data is better for the MI tasks signal classification. We evaluated the performance of the three algorithms; LS-SVM, LR and CC-KLR on two EEG datasets. From the experimental evaluations, we concluded that the CC-LS-SVM is the best algorithm for the classification of the MI tasks EEG signals and the all-channels EEG can provide better information than the motor area EEG for the MI tasks classification.
8
1.4 Structure of the Dissertation
This dissertation consists of nine chapters and each chapter provides important information on our research. The rest of this dissertation is structured as follows:
Chapter 2 provides an overview of EEG signal classification techniques and its background knowledge. Firstly, this chapter briefly introduces the background knowledge and surrounding information of this research on the human brain, the fundamentals of EEG, epilepsy, epileptic seizures and how they affect EEG sits, and the concept of BCI systems. After that, this chapter focuses on the concept of signal classification including its structure and methods.
Chapter 3 introduces a novel method based on a simple random sampling technique and least square support vector machine (SRS-LS-SVM) for the classification of epileptic EEG signals. This classification technique can help to differentiate EEG segments and to decide whether a person is healthy.
Chapter 4 presents a clustering technique based least square support vector machine (CT-LS-SVM) for classifying epileptic EEG signals while reducing the experimental time. In this proposed approach, the clustering technique (CT) is used for feature extraction, and a least square support vector machine (LS-SVM) for the classification purpose. This chapter provides a comparative study between the CT based approach and the SRS based approach with respect to the classification accuracy and execution time.
Chapter 5 focuses on the identification of MI signals for the development of BCI technologies combining cross-correlation (CC) and logistic regression (LR) techniques named by CC-LR. This chapter investigates the performance of the CC technique for a randomly selected reference signal Fp1 and also investigates how more efficient the LR classifier is in classifying the cross-correlated features.
9
chapter reaches a conclusion on which features are suitable for this algorithm to characterize the distribution of EEG signals. This chapter also provides an insight into how to select a reference channel for the CC technique using EEG signals for getting better information about MI.
Chapter 7 introduces another novel algorithm to improve the separability of the MI tasks combining the CC and LS-SVM methods called by CC-LS-SVM. In this algorithm, the hyper parameters of the LS-SVM method are obtained by a two-step grid search process, which can provide more reliable and consistent results. This chapter shows the performance of the LS-SVM classifier against the other two classifiers, logistic regression (LR) and kernel logistic regression (KLR). The effects of two different reference channels, the electrode position Fp1 and C3, are also investigated in this chapter.
Chapter 8 reports on a comparative study between the motor area EEGs and the all-channels EEGs to identify MI tasks EEG signals in BCI applications. This chapter investigates two issues:
(1) Which algorithm is the best for the MI signal classification.
(2) Which EEG data is better for the MI signal classification. Is it the motor area data or the all-channels data.
This chapter considers C3 channel as a reference channel to calculate each cross correlation sequence in the CC technique.
10
CHAPTER 2
OVERVIEW OF EEG SIGNAL CLASSIFICATION AND ITS
BACKGROUND KNOWLEDGE
The goal of this dissertation is to develop methods that are capable of classifying different categories of electroencephalography (EEG) signals to help in the evaluation and treatment of neurological diseases. In order to have a broad understanding of classification, this chapter mainly provides an overview of classification including its concept, structure and commonly used methods of EEG signal classification.
Before providing the overview of the classification, this chapter introduces the general concepts and background knowledge about EEG, epilepsy and BCIs. A brief description of these terminologies is discussed in Section 2.1. Section 2.2 presents a core idea of the classification of EEG signals. This section also reports different methods used in the literature for the classification of EEG signals. Finally, this chapter gives a brief summary of the EEG and the EEG signal classification for this dissertation.
2.1 Background knowledge related to EEG signals
11
2.1.1 Human Brain
The supreme commander of the human body is the brain. it’s the central part of the nervous system which governs the functions of various organs in the body. Firstly, in this section we explain the anatomical structures of the brain and their functions. Then we focus on how, why and where the brain generates electrical activities that can be recorded on the scalp. It provides a clear idea to understand the creation of local current flows within the brain that can be captured by EEGs.
2.1.1.1 Brain structures and their functions
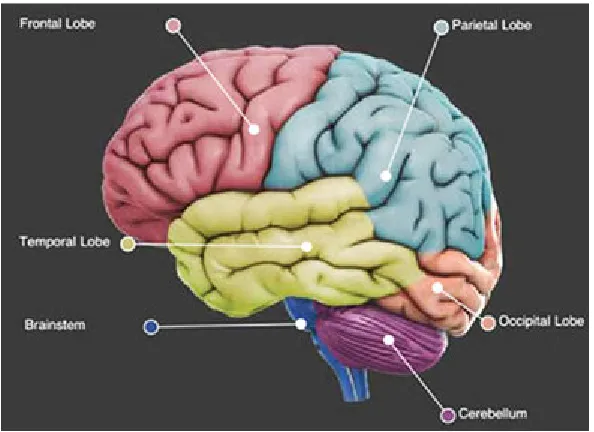
Anatomically the brain can be divided into three major parts; cerebrum, cerebellum and brainstem (Gray, 2002) as illustrated in Figure 2.1. Below is a brief explanation of the three aforementioned parts of the brain.
(1) Cerebrum: The cerebrum is the largest and most important part of the human brain and is generally associated with brain functions related to thoughts, movements,
emotions and motor functions. The outermost layer of the cerebrum is made up of
neural tissues known as the cerebral cortex. The cerebrum consists of two hemispheres, such as right and left hemispheres. Each hemisphere can be divided into four lobes: frontal, parietal, occipital and temporal (Purves et al., 2004). These lobes are responsible for a variety of bodily functions.
• Frontal Lobe is involved with personality, emotions, problem solving, motor development, reasoning, planning, parts of speech and movement.
• Parietal Lobe is responsible for sensation (e.g. pain, touch), sensory comprehension,recognition, perception of stimuli, orientation and movement. • Occipital Lobe is responsible for visual processing.
• Temporal Lobe is involved in dealing with the recognition of auditory stimuli, speech, perception and memory.
12
areas of the brain that is responsible for motor control, sensory perception and
co-ordination. The cerebellum is also associated with voluntary muscle movements, fine
[image:32.595.172.469.152.368.2]motor skills, posture and balance regulation.
Figure 2.1: Anatomical areas of the brain (Gray, 2002).
(3) Brainstem: The brainstem is located at the bottom of the brain and connects the cerebrum to the spinal cord. The brainstem is like a hard drive of a computer and it is the main control panel of the body. It controls vital functions of the body, including breathing, consciousness, movements of the eyes and mouth, and the
relaying of sensory messages (pain, heat, noise etc), heartbeat, blood pressure and
hunger.
2.1.1.2 Human brains’ neurophysiology
The human brain consists of about 100 billion nerve cells called neurons and the electrical charge of the brain is maintained by these neurons. Neurons share the same characteristics and have the same parts as other cells, but the electrochemical aspect lets them transmit electrical signals and pass messages to each other over long distances. Neurons have three basic parts: cell body (soma), axon and dendrites
13
The cell nucleus is the heart of the cell, providing it with instructions on what to do. The axon is a long, slender portion of the neuron that connects the nucleus of its own neuron to the dendrite of another. The dendrite is a short section of the neuron with many receptor sites for neurotransmitters that may be sent by a paired axon. Dendrites can be located on one or both ends of the cell. Through the axon-dendrite link, neurons can communicate between each other. This communication is made possible through the action potential.
[image:33.595.162.487.472.705.2]The action potential is an event where the ion pumps along the outside of an axon rapidly changing the ionic makeup of the axon, allowing an electrical signal to travel quickly through the axon to the next dendrite (Atwood and MacKay, 1989). As a result of this rapid change in ionic charge, a voltage is generated both on the inside and the outside of the cell membrane of the neuron (Carlson, 2002b; Sanei and Chambers, 2007; Purves et al., 2004). These neurons emit a chemical which is sent to another neuron through the synapse, i.e. the gap between the neurons, in order to trigger an activity. The chemicals sent from one neuron to another to trigger it are known as neurotransmitters. The inter-neuron communication system is depicted in Figure 2.2 and Figure 2.3 presents the current flow that contributes to the surface EEG during a net excitatory input.
14
When neurons are activated by means of an electrochemical concentration gradient, local current flows are produced. The electrical activity of neurons can be divided into two subsets; action potentials (AP) and postsynaptic potentials (PSP). If the PSP reaches the threshold conduction level for the postsynaptic neuron, the neuron fires and an AP is initiated (Atwood and MacKay, 1989).
[image:34.595.157.481.418.625.2]The electrical potentials recordable on the scalp surface are generated by low frequency summed inhibitory and excitatory PSP’s from pyramidal neuron cells that create electrical dipoles between the soma and apical dendrites (see Figure 2.3). These PSP’s summate in the cortex and extend to the scalp surface where they are recorded as the EEG. Nerve cell AP’s have a much smaller potential field distribution and are much shorter in duration than PSPs. AP’s therefore do not contribute significantly to either scalp or clinical intracranial EEG recordings. Only large populations of active neurons can generate electrical activity recordable on the scalp (Carlson, 2002b; Sanei and Chambers, 2007; Purves et al., 2004). The voltage, when generated by a single cell, is typically too small to accurately measure with present-day technology.
Figure 2.3: A single cortical pyramidal cell showing the current flow that contributes to the surface EEG during a net excitatory input (Carlson, 2002; Atwood and MacKay,1989).
15
influence on EEG recordings. In the following section, we provide background information of EEG in detail.
2.1.2 Electroencephalography (EEG)
Electroencephalography (EEG) is a measurement of potentials that reflect the electrical activity of the human brain. It is a readily available test that provides evidence of how the brain functions over time. The EEG is widely used by physicians and scientists to study brain functions and to diagnose neurological disorders. The study of the brain electrical activity, through the EEG records, is one of the most important tools for the diagnoses of neurological diseases, such as epilepsy, brain tumour, head injury, sleep disorder, dementia and monitoring depth of anaesthesia during surgery (Hazarika et al., 1997, Adeli et al., 2003) etc. It may also be recommended for the treatment of abnormalities, behavioural disturbances (e.g. Autism), attention disorders, learning problems, language delay etc.
The EEG machine was first introduced to the world by Hans Berger in 1929 (Collura, 1993). Berger, who was a neuropsychiatrist from the University of Jena in Germany, used the German term ‘elektrenkephalogramm’ to describe the graphical representation of the electric currents generated in the brain. He suggested that brain currents changed depending upon the functional status of the brain such as sleep, anesthesia, and epilepsy. This was revolutionary idea that helped create a new branch of medical science called neurophysiology. Figure 2.4 displays the first recording of EEG signals made by Hans Berger. Berger noticed that rhythmic changes (brain waves) varied with the individual’s state of consciousness.
16
[image:36.595.150.528.75.344.2]Hans Berger (1873-1941) Recordings of EEG made by Berger Patient of Berger
Figure 2.4: First recording of EEG signals made by Hans Berger (Berger, 1929).
There are two types of EEG, depending on where the signal is taken in the head:
scalp or intracranial. For the scalp EEG, small electrodes are placed on the scalp
with good mechanical and electrical contact. Special electrodes implanted in the brain during the surgery result in intracranial EEG. On the other hand, the EEG measured directly from the cortical surface using subdural electrodes is called the
electrocorticogram (ECoG). The amplitude of an EEG signal typically ranges from
about 1 to 100 µV in a normal adult, and it is approximately 10 to 20 mV when measured with subdural electrodes such as needle electrodes. Since the architecture of the brain is non-uniform and the cortex is functionally organised, the EEG can vary depending on the location of the recording electrodes.
17
eyes and inon which is the bony prominence at the base skull on the midline at the back of the head. Figure 2.5 presents the electrode position on the brain according to the international 10-20 system. Each location uses a letter to identify the lobe and a number to identify the hemisphere location. The letters F, T, C, P and O stand for Frontal, Temporal, Central, Parietal and Occipital, respectively. A “z” refers to an electrode placed on the midline. Even numbers refer to electrode positions on the right hemisphere, whereas odd numbers refer to those on the left hemisphere. Since an EEG voltage signal represents a difference between the voltages at two electrodes, the display of the EEG for the reading EEG machine may be set up in several ways. The placement of the electrodes is referred to as a montage. The EEG can be monitored with the following montages.
Figure 2.5: The international 10-20 electrode placement system (Jasper, 1958b).
Bipolar montage: One pair of electrodes usually makes up a channel. Each channel (waveform) represents the difference between two adjacent electrodes (Niedermeyer and Lopes Da Silva, 2005; Fisch, 1999). The entire montage consists of a series of these channels. For example, the channel "Fp1-F3" represents the difference in the voltage between the Fp1 electrode and the F3 electrode. The next channel in the montage, "F3-C3," represents the voltage difference between F3 and C3, and so on, through the entire array of electrodes.
18
a different position than the "recording" electrodes. Midline positions are often used because they do not amplify the signal in one hemisphere versus. the other. Another popular reference is "linked ears", which is a physical or mathematical average of electrodes attached to both earlobes and mastoids.
Average reference montage: The outputs of all of the amplifiers are summed and averaged, and this averaged signal is used as the common reference for each channel (Fisch, 1999).
Laplacian montage: Each channel represents the difference between an electrode and a weighted average of the surrounding electrodes (Fisch, 1999). With digital EEG, all signals are typically digitized and stored in a particular (usually referential) montage; since any montage can be constructed mathematically from any others, the EEGs can be viewed by an EEG machine in any display montage that is desired.
The EEG patterns are very important for understanding brain activities by identifying morphological features or examining frequency bands associated with different mental activities or conscious states. The frequency bands can be divided into five categories. In the next section, we discuss the most common patterns of EEG signals in situations where individuals are in a state of alertness, sleeping, suffering from a brain disorder and experienced extreme emotional.
2.1.2.1 Nature or rhythms of the EEG signals
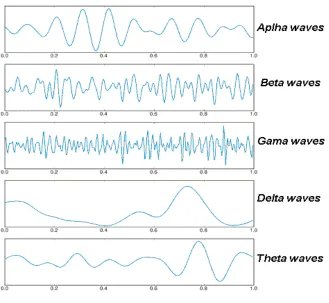
Frequency is one of the most important for assessing abnormalities in clinical EEGs and for understanding functional behaviours in cognitive research. With billions of oscillating communities of neurons as its sources, the human EEG potentials are manifested as aperiodic unpredictable oscillations with intermittent bursts of oscillations which are typically categorized in specific bands such as 0.5-4 Hz (delta,
δ), 4-8 Hz (theta, θ), 8-13 Hz (alpha, α), 13-30 Hz (beta, β) and >30Hz (gamma, γ) (Niedermeyer and Lopes Da Silva, 2005; Fisch, 1999). Figure 2.6 illustrates examples of these EEG rhythms.
19
Theta wave lies between 4 and 8 Hz with an amplitude usually greater than 20 µV. Theta arises from emotional stress, especially frustration or disappointment and unconscious material, creative inspiration and deep meditation.
Alpha contains the frequency range from 8 to 13 Hz, with 30-50m µV amplitude, which appears mainly in the posterior regions of the head (occipital lobe) when the subject has eyes closed or is in a relaxation state. It is usually associated with intense mental activity, stress and tension. Alpha activity recorded from sensorimotor areas is also called mu activity.
[image:39.595.169.498.390.693.2]Beta is in the frequency range of 13 Hz-30 Hz. It is seen in a low amplitude and varying frequencies symmetrically on both sides in the frontal area. When the brain is aroused and actively engaged in mental activities, it generates beta waves. Beta waves are characteristics of a strongly engaged mind. Beta is the brain wave usually associated with active things, active attentions, and focusing on the outside world or solving concrete problems.
20
Gamma waves have the frequency from 30 Hz and up. This rhythm is sometimes defined as having a maximal frequency around 80 Hz or 100 Hz. It is associated with various cognitive and motor functions.
Electrical signals in the EEG that are originated from non-cerebral origin are called artifacts. EEG data is almost always contaminated by such artifacts. The amplitude of artifacts can be largely relative to the size of amplitude of the cortical signals of interest. This is one of the reasons why it takes considerable experience to correctly interpret EEGs clinically.
As one of the main diagnostic applications of EEG is in the case of epilepsy, in this dissertation, two algorithms are developed to classify epileptic EEG signals. To provide an overview about epileptic EEG signals, the following subsection discusses what epilepsy and epileptic seizures are, and what they affect EEG signals.
2.1.3 Epilepsy, epileptic seizures and their effects on EEG signals
Epilepsy is the most prevalent neurological disorder in humans. About 50 million people worldwide have epilepsy (Lima et al., 2009), and nearly two out of every three new cases are discovered in developing countries. More than two million people in the United States have experienced an unprovoked seizure or been diagnosed with epilepsy. Epilepsy is characterized by recurrent seizures (Blume et al., 2001). Seizures are defined as sudden changes in the electrical functioning of the brain, resulting in altered behaviours, such as losing consciousness, jerky movements, temporarily loss of breath and memory loss. These usually happen in the cortex, or outside rim of the brain.
21
of a genetic defect (as in the various types of inherited epilepsy), or from neurones made unstable by metabolic abnormalities such as low blood glucose, or alcohol. Alternatively, the abnormal discharge may come from a localized area of the brain (this is the case in patients with epilepsy caused by head injury or brain tumour). During a seizure, neurons may fire as many as 500 times a second, much faster than normal (1-100µV). In some people, this happens only occasionally; for others, it may happen up to hundreds of times a day.
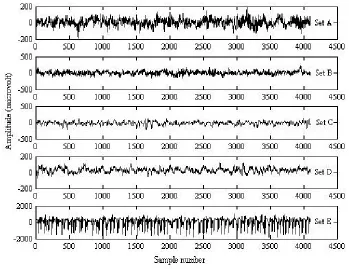
EEG recordings contain valuable information for understanding epilepsy. Epileptic activity can create clear abnormalities on a standard EEG. Epilepsy leaves its signature in the EEG signals. The detection of seizures occurring in the EEGs is an important component in the diagnosis and treatment of epilepsy. Two categories of abnormal activity can be observed in an EEG signal: ictal (during an epileptic seizure) and inter-ictal (between seizures). Often, the onset of a clinical seizure is characterized by a sudden change of frequency in the EEG measurement. It is normally within the alpha wave frequency band with slow reduction in frequency but increase in amplitude during the seizure period. It may or may not be spiky in shape. For assisting the diagnosis and treatment of epilepsy or neurological disease, this dissertation aims to develop methods that can identify the epileptic EEG signals during seizure activity and also during seizure-free time.
Recently, EEG has had many applications in BCI technologies in which a person could communicate with other or control devices directly by means of a brain activity without using the normal channels of peripheral nerves and muscles. In the next section, we describe the concept, structure and applications of BCI systems.
2.1.4 Concept of Brain Computer Interfaces (BCIs)
22
A BCI is a technology that finds a new communicative way of using only the brain to command machines. An electrode cap is placed on the head of a user for measuring EEG signals. To command machines a user imagines a specific task such as movement of limbs, composing of words. These tasks affect the patterns of EEG signals. Computers detect and classify these patterns into different tasks in order to control a computer application (such as cursor movement), or control a machine (e.g. wheelchair).
Unlike all other interfaces, BCIs do not require an actual movement, and hence BCIs may be the only means of communications possible for people who have severe motor disabilities. BCIs can also provide the communication and control for other user groups and goals, such as patients with less severe motor disabilities who wish to control an orthosis or wheelchair (Graiman et al., 2008), and healthy users in situations where conventional means of communication are difficult, impractical or inadequate (Allison et al., 2007). BCIs could also help reduce symptoms resulting from stroke, autism, emotional and attention disorder (Kouijzer et al., 2009). There are two types of BCIs: invasive, which are based on signals recorded from electrodes implanted over the brain cortex (requiring surgery), and non-invasive, based on signals recorded from electrodes placed on the scalp (outside the head) (Wolpaw et al. 2002). In recent research, the non-invasive EEG is the most preferable technique.
2.1.4.1 Architecture of BCI systems
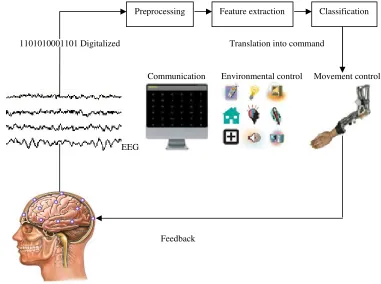
Typically a BCI system requires the following of a closed-up process which generally consists of six steps: brain activity measurement, pre-processing, feature extraction, classification, translation into a command and feedback (Mason and Birch, 2003) shown in Figure 2.7.
1. Brain activity measurement: Measuring brain activity effectively is a critical step for BCI communications. Human intentions modulate the electrical signals which are measured using various types of electrodes and then these signals are digitized. In this thesis, we use EEGs as the measurement of brain activities.
23
3. Feature extraction: The brain patterns used in BCIs are characterized by certain features. Feature extraction aims at describing the signals by a few relevant values called “features” (Bashashati et al. 2007).
1101010001101 Digitalized Translation into command
Communication Environmental control Movement control
EEG
Feedback
[image:43.595.130.511.157.441.2]
Figure 2.7: A general architecture of a BCI system.
4. Classification: The classification step assigns a class to a set of features extracted from the signals. This class corresponds to the type of mental states identified. This step can also be denoted as “feature translation”.
5. Translation into a command/application: Once the mental state is identified, a command is associated to this mental state in order to control a given application such as a computer or a robot.
6. Feedback: Finally, this step provides the user with feedback about the identified mental state. This aims to help the user control his/her brain activities. The overall objective is to increase the users performances.
A BCI can only detect and classify specific patterns of an activity in continuous brain signals that are associated with specific tasks or events. What a BCI user has to do to produce these patterns is determined by the mental strategy a BCI system employs. The mental strategy is the foundation of any brain computer communication. The
24
mental strategy determines what the user has to do in order to produce brain patterns that the BCI can interpret. The most common mental strategies are motor imagery (MI) and selective (focused) attention. Motor imagery (MI) is the imagination of a movement without actually performing the movement. On the other hand, BCIs based on selective attention require external stimuli provided by a BCI system. The stimuli can be auditory or somatosensory. In this research, we work on the MI for the BCI systems.
2.1.4.2 Applications of BCI systems
The range of possible BCI applications is very broad. BCIs have been validated with many applications, including spelling devices/virtual keyboard (e.g. patients in a locked-in state), simple computer games, environmental control, neuroprosthesis (e.g. tetraplegic patients), biofeedback therapy (e.g. reduction of epileptic seizures, enhanced stroke rehabilitation, treatment of attention deficit disorders), navigation in virtual reality, and genetic cursor control applications (Blankertz et al. 2007; Pfurtscheller et al 2006b; Sellers and Donchin, 2006). Most of these applications run on conventional computers that host a BCI system and its application as well. An increasing number of systems allow control of more sophisticated devices, including orthoses, prostheses, robot arms and mobile robots (Graimann et al., 2009; Vellistte et al., 2008).
Communication or control based BCI technologies require typical patterns of brain activity which can be consciously generated or controlled by a subject and ultimately clearly distinguishable by a computer system. The system requires a BCI user to concentrate on a mental task in order to produce a characteristic brain pattern that identifies with the desired control, e.g. the imagination of a hand movement. The performances of different mental tasks generate different EEG responses and hence can be translated into a control codebook for the user. In this thesis, we develop three algorithms to identify different mental tasks (e.g. MI task) for the development of communication based BCI systems.
25
classification concepts, structure, types and methods used for epileptic EEG data and MI tasks EEG data in BCIs.
2.2 Overview of EEG signal Classification
The classification of EEG signals plays an important role in biomedical research. Classifying EEG signals is very important in the diagnosis of brain diseases and for contributing to a better understanding of cognitive processes. An efficient classification technique assists to distinguish EEG segments, and in the decision making on a person’s health. As EEG recordings contain a large amount of data, one key problem is how to represent the recorded EEG signals for further analysis, such as classification. It is, firstly, important to extract useful features from raw EEG signals, and then use the extracted features for classification. The following sections provide detailed outlines for the signal classification in this research area.
2.2.1 Concept of classification
The task of classification occurs throughout daily life, and essentially means decisions being made based on currently available information. Examples of classification tasks include the mechanical procedures used for sorting letters on the basis of machine read postcodes, assigning individuals to credit status on the basis of financial and other personal information, and the preliminary diagnosis of a patient’s disease in order to select immediate treatment while awaiting definitive test results (Brunelli, 2009).
In machine learning and pattern recognition, classification refers to an algorithm procedure for assigning a given piece of input data into one of a given number of categories (Duda et al., 2001; Brunelli, 2009). An example would be assigning an e-mail to a “Spam” or “non-spam” section or giving a diagnosis to a patient based on observed characteristics (gender, blood pressure or presence or absence of certain symptoms, etc.). The piece of input data is formally known as an
instance and the categories are termed classes. The instance is formally described by
26
The goal of the classification is to assign class labels to the features extracted from the observations of a set of data in a specific problem. An algorithm that implements classification, especially in a concrete implementation, is known as a
classifier. The term classifier sometimes also refers to the mathematical function,
implemented by a classification algorithm that maps input data to a category.
Classifiers are able to learn how to identify the class of a feature vector thanks to
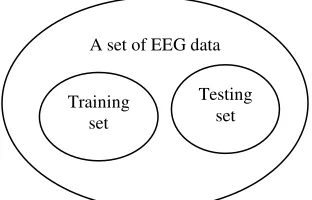
training sets. These sets are composed of feature vectors labelled with their classes of belonging.
This research works on the EEG signal classification. Measuring brain activity through EEG leads to the acquisition of a large amount of data. In order to obtain the best possible performances it is necessary to work with a smaller number of values which describe some relevant properties of the signals. These values are known as “features”. Features are generally aggregated into a vector known as a “feature vector” (Lotte, 2009). Thus, feature extraction can be defined as an operation which transforms one or several signals into a feature vector. The feature vector, which is comprised of the set of all features used to describe a pattern, is a reduced dimensional representation of that pattern. Signal classification means to analyse different characteristic features of a signal, and based on those characteristic features, decide to which grouping or class the signal belongs. The resulting classification decision can be mapped back into the physical world to reveal information about the physical process that created the signal.
2.2.2 Types of classification
There are two main divisions of classification: supervised classification and
unsupervised classification. In supervised classification, observations of a set of data
are associated with class labels. In unsupervised classification, observations are not labelled or assigned to a known class (Jain et al., 2000). Descriptions of aforementioned are provided as below.
2.2.2.1 Supervised classification
Supervisedclassification is preferred in the majority