Microdata Protection Method Through Microaggregation: A
Median Based Approach
Md Enamul Kabir and Hua Wang Department of Mathematics and Computing
University of Southern Queensland Toowoomba, QLD 4350, Australia Emails: {kabir, wang}@usq.edu.au
ABSTRACT
ADM causes least information loss and can be used as a measure of information loss for a microaggregated microdata set.
Keywords: Privacy; Microaggregation; Microdata protection; k-anonymity; Disclosure control;
1. INTRODUCTION
In recent years, the phenomenal advance technological developments in information technology enable government agencies and corporations to accumulate an enormous amount of personal data for analytical purposes. These agencies and organizations often need to release individual records (microdata) for research and other public benefit purposes. This propagation has to be in accordance with laws and regulations to avoid the propagation of confidential information. In other words, microdata should be published in such a way that preserves the privacy of the individuals. To protect personal data from individual identification, SDC is often applied before the data are released for analysis (Domingo-Ferrer & Torra, 2005, Willenborg & Waal, 2001). The purpose of microdata SDC is to alter the original microdata in such a way that the statistical analysis from the original data and the modified data are similar and the disclosure risk of identification is low. As SDC requires to suppress or alter the original data, the quality of data and the analysis results can be damaged. Hence, SDC methods must find a balance between data utility and personal confidentiality.
Mukherjee, 2003). The basic idea of microaggregation is to partition a dataset into mutually exclusive groups (called clusters) of at least k records prior to publication, and then publish the centroid over each group instead of individual records. The resulting anonymized dataset satisfies k-anonymity (Sweeny, 2002), requiring each record in a dataset to be identical to at least (k-1) other records in the same dataset. As releasing microdata about individuals poses a privacy threat due to the privacy-related attributes, called quasi-identifiers, both k-anonymity and microaggregation only consider the quasi-identifiers. Microaggregation is traditionally restricted to numeric attributes in order to calculate the centroid of records, but also been extended to handle categorical and ordinal attributes (Domingo-Ferrer & Torra, 2002 & 2005, Torra, 2004). In this paper we proposed a microaggregated method that also applicable for the numeric attributes.
2. MOTIVATION
3. RELATED WORK
This work is related to several topics in the area of microaggregation in SDC. Usually, in microaggregation methods mean is used as a centriod and different authors’ proposed different methods in order to minimize the information loss.
k- anonymity (Samarati, 2001 & Sweeny, 2002) provides sufficient protection of
2006) and the Two Fixed Reference Points method (Chang et al., 2007). Most recently, Lin et al. (2010) proposed a density-based microaggregation method that forms records by the descending order of their densities, and then fine-tunes these groups in reverse order. All the works stated above proposed different microaggregation methods to form the groups, where within groups the records are homogeneous but between groups the records are heterogeneous and sum of squares of errors (SSE) are used the measure the information loss. As median is used as a measure of location to represent each group, in this paper we proposed sum of absolute deviations from median (ADM) to measure the information loss that is always less than the SSE. That means by using ADM as a measure of information loss always produce less information loss than the SSE. Thus the proposed median based microaggregation method has the following features:
• It divides the whole microdata set into a number of mutually exclusive and exhaustive groups prior to publication and then publishes the median over each group instead of individual records.
• It guarantees that the modification has no effect and the modified data and the original data are similar by using statistical test.
• As microaggregated data causes information loss, it uses sum of absolute deviations from median (ADM) as a measure of distortion that is always less than the so called distortion measure sum of squares of errors (SSE).
Important properties of the proposed and metric are discussed in Section 6. Finally, concluding remarks are included in Section 7.
4. THE PROPOSED APPROACH
Microdata protection through microaggregation has been intensively studied in recent years. Many techniques and methods have been proposed to deal with this problem. In this section we first describe some basic concept of microaggregation and the proposed approach of microaggregation.
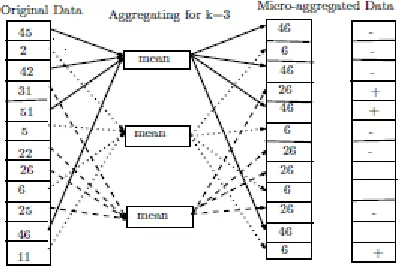
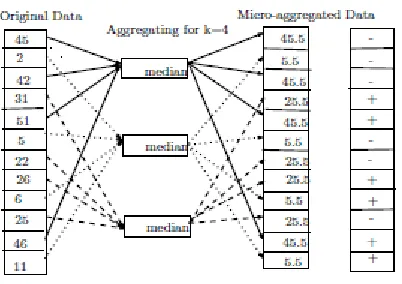
[image:7.595.198.400.462.599.2]When we microaggregate data we should keep in mind in two goals, data utility and preserving privacy of individuals. For preserving the data utility we should introduce as little noise as possible into the data and for preserving privacy data should be sufficiently modified in such a way that it is difficult for an adversary to re identify the corresponding individuals.
FIGURE 2 Example of Microaggregation using median
Figure 1 and Figure 2 show examples of microaggregated data where in Figure 1, the centroid is replaced by mean and in Figure 2; the centroid is replace by median. Both the figures show that after aggregating the chosen elements, it is impossible to distinguish them, so that the probability of linking any respondent is inversely proportional to the number of aggregated elements.
corresponding group mean and in Figure 2 these values are replaced by their corresponding group median. We would now like to test whether the original data and the micrioaggregated data are similar. Set up a null hypothesis H0: the
microaggregation method has no effect and the alternative hypothesis is Ha: the
microaggregation method has an effect. Take the difference of microaggregated data from original data, give a ‘+’ sign if the difference is positive and give a ‘-’ sign if the difference is negative. We omit pairs for which there is no difference and count the number of positive differences (X).
If we use median as centroid value then total pairs is, n = 12 (as no tie) and the number of positive sign is, X = 6. This is exactly what we would expect if there is no difference. Thus we can’t reject H0, no evidence to support the hypothesis that the
microaggregation method has an effect. That means the modification has no effect and both the microaggregated data and the modified data are similar. So, it can be concluded that by using median as centroid value, always give guarantee of producing similar original and modified data. This is true for any dataset as median is the middle most observations in a set of values.
On the contrary, if we use mean as centroid value then total pairs is, n = 12-3 = 9 (as three tie) and the number of positive sign is, X = 3. This is not exactly what we would expect if there is no difference. That means we can’t say anything unless getting p-value as the acceptance or rejection of H0 depends on p-value. So there is no
can be concluded that by using mean as centroid value, does not give any guarantee of producing similar original and modified data for any dataset.
As discussed, microaggregation method using median provides sufficient evidence that the modified data are similar to the original data, in this paper we propose to use median as the centroid point of each group. So before publish, microdata should be partitioned into some groups such that within groups the records are more close to each other and between groups the records are more distant to each other, and then publish the median over each group instead of individual records.
5. PROPOSED DISTORTION METRIC
Consider a microdata set T with p numeric attributes and n records, where each record is represented as a vector in a p-dimensional space. For a given positive integerk≤n, a microaggregation method partitions T into g groups where each group contains at least k records (to satisfy k-anonymity), and then replaces the records in each group with the median of the group. Let ni denote the number of records in the ith group,
and xij,1≤ j≤ni, denote the jth record in the ith group. Then, ni ≥k for i = 1 to g,
and
∑
=
= g
i
i n
n
1
. The centroid of the ith group, denoted by mi, is calculated as the
are more close to each other. To measure whether the records in each group are close to each other, in this paper we use sum of absolute deviations from median (ADM) of each group and is defined as
∑ ∑∑
= = = − = g i p l n j il ilj i m x ADM1 1 1
| ) (
| (1)
where, xilj is the jth record of lth attribute in the ith group and mil is the median of lth
attribute in ith group. As we replace each record by their corresponding group median, the distortion is measured by the difference between individual record and its median. The lower the distance, median is close to its original value and higher the distance median is far from its true value. We are only measuring the distance as it is not interest to us whether the distance is positive or negative. Thus we take the absolute difference and the ADM is used to measure the information loss due to using median based microaggregation method. On the other hand, ADM could also be used to measure the homogeneity of the groups. The lower the ADM, the records of the group are more homogeneous to each other. Previously, the most common measure of information loss proposed by Domingo-Ferrer and Mateo-Sanz (2002) is the Sum of Squares of Errors (SSE) and is defined by
∑ ∑∑
= = = − = g i p l n j il ilj i m x ADM1 1 1
2
)
( (2)
where p is the total number of numerical attributes in the dataset and x is the mean il
of lth variable in the ith group. It should be noted that the sum of deviations from their
mean of a set of observations is always zero, i.e.
∑
− =i
i x
x ) 0
( and so sum of
squares of deviations from mean was used to measure the similarity of each group. As
in this paper we are taking sum of deviations from median, i.e.
∑
−i
i m
x )
( , it always
absolute value of theses deviations. Thus, given a homogeneity measure such as ADM and a security parameter k, which determines the minimum cardinality of the groups, the microaggregation problem can be enumerated as follows:
Definition: Given a dataset T of n elements and a positive integer k, find a
partitioning G = {G1, G2, … , Gg} of T such that ADM is minimized subject to the
constraint that |Gi |≥k for any Gi ∈ G.
Once we get the homogeneous groups, the median value over each group is computed and replaces each of the original group values. Thus we get a microaggregated microdata set and could be publish for general public use. It confirms that the microaggregated dataset is similar to the original data and preserves the privacy of individuals as well as increase the data utility.
6. ANALYSIS OF THE APPROACH
As discussed, in this paper we proposed a median based microaggregation method and proposed a distortion metric ADM to measure the homogeneity of the records in a group. In this section we will discuss some of the properties of the proposed approach and the metric.
Theorem 1 Suppose an attribute in a dataset consists of some groups and each group
consists records of at least k. Let the records of each group is replaced by the median of the corresponding group. Then the attribute consists of the original records and the
attribute consists of the modified records (medians) have the same distribution.
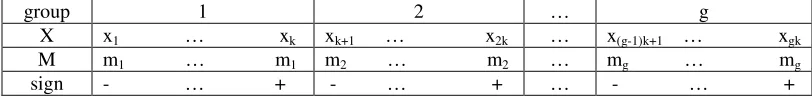
group 1 2 … g
X x1 … xk xk+1 … x2k … x(g-1)k+1 … xgk
M m1 … m1 m2 … m2 … mg … mg
[image:12.595.98.504.684.733.2]sign - … + - … + … - … +
Proof Suppose an attribute in a dataset consists of n records that are exactly divisible
by k. So the attribute consists of k n
g = groups and each group consists of k records.
Suppose the attribute consists of the values, x1, …, xk, xk+1, … x2k, …, x(g-1)k+1, …, xgk,
where the first group consists of first k-values, the second group consists of second k values, ..., and the last group consists of last k-values as shown in Figure 3. Also let mi(i = 1, …, g) be the median of the ith group respectively, where mi is the middle
most observation of the ith group, when the values in ith group are arranged in order of magnitude. Thus the corresponding microaggregated values of the original values of the attribute are m1, …, m1, m2, …, m2, …, mg, … mg, where first k-values consists in
the first group, second k- values consists in the second group and so on, if median is replace as the centroid. Thus we get match pair data and let (Xi, Mi) be n pairs of
observations. We wish to test,
H0 : X and M follow the same distribution,
Ha : The two distributions differ in location.
Let Di = Xi -Mi. Under H0, both X and M comes from the same distributions, so
P(Di is positive) = P(Di is negative) =
2 1
.
Let W be the total number of positive differences (Di’s). If Xi and Mi follow the same
distribution then W follows Binomial distribution with parameters n and 2 1
.
the total number of positive sign is , k
g n−
if n is odd and , 2 n
if n is even. That means
the number of positive signs and the number of negative signs would be the same whatever k is even or odd. This is exactly what we would expect if there is no difference. Thus we can not reject H0, showing that original values and the modified
values of the attribute follows the same distribution and thus they are similar. Similarly this can be shown if n is not exactly divisible by k. This is true for each and every attribute in a microdata set. Thus if a microdata set is partition in to some groups and each record of a particular group is replaced by the corresponding median, then the microaggregated microdata set and the original dataset have the same distribution. We will now show that the homogeneity measure ADM proposed in this paper is always less than the so called homogeneity measure SSE. Before that we would like to discuss the following theorem.
Theorem 2 Sum of absolute deviations of a set of observations from their median is
always less than the deviations from mean.
Proof Let x1, x2, …, xn be a set of n observations. Let us assume that n is an even
number and so n = 2p , where p is an integer. Thus median (m) lies between xp to xp+1.
Also let x is the arithmetic mean which lies between xk to xk+1. Here we would like to
show that
∑
∑
= = − ≤ − n i n i ii m x x
x 1 1 | | | |
Let us first take the absolute deviations from mean, say D1
) ( ... ) ( )
( 1 2
1 x x x x x xk
D = − + − + + −
+(xp+1 −x)+(xp+2 −x)+...+(xn −x) (3)
and the absolute deviations from median, say D2
) ( ... ) ( )
( 1 2
2 m x m x m xk
D = − + − + + −
+(m−xk+1)+(m−xk+2)+...+(m−xp)
+(xp+1 −m)+(xp+2 −m)+...+(xn −m) (4)
Therefore, ) ... ( 2 ) )( ( ) )( ( )
( 1 2
2
1 D x m k x m p k x m n p xk xk xp
D − = − − + − − − − + + + + + +
=2(xk+1+xk+2 +...+xp −x(p−k))
=2[(xk+1 −x)+(xk+2 −x)+...+(xp −x)] (5)
which is a positive quantity, so sum of absolute deviations from median is always less than the deviations from mean. In other words,
∑
∑
= = − ≤ − n i i n ii m x x
x 1 1 | | | |
without any loss of generality, we can say that
∑
∑
= = − ≤ − n i i n ii m x x
x 1 2 1 ) ( | |
This is true for every group in an attribute, for every attribute and for every dataset consisting of several numeric attributes. So,
∑∑ ∑
∑ ∑∑
= = = = = = − ≤ − g i il ilj p l n j g i il ilj p l n j x x m x i i 1 2 1 11 1 1
) ( | ) ( | SSE ADM≤ ⇒ (6)
7. CONCLUSION
Microaggregation is an effective method of protecting privacy in microdata. This work presents a new microaggregation method for numerical attributes. The new method consists of clustering individual records in microdata in a number of disjoint groups prior publication and then publish the median over each group instead of individual records. We showed by using statistical test that the microaggregated data and the original data have the same distribution. As it produces the similar dataset, the statistical results also produce the similar results as in the original dataset. In addition, in this paper we proposed a distortion metric to measure the homogeneity of the records in a group. The metric, called ADM can be used to measure the amount of information loss due to microaggregation. We showed that ADM always produce less information loss than the previous information loss metric. This method of microaggregation can be extremely useful for researchers, experts and the associated people to analysis data accurately and efficiently as it protects the privacy of individuals as well as produces the similar original data set.
REFERENCES
Bezdek, J.C. (1981) Pattern recognition with fuzzy objective function algorithms. Norwell, MA: Academic Publishers.
Domingo-Ferrer, J., & Mateo-Sanz, J. (2002). Practical data-oriented microaggregation for statistical disclosure control. IEEE Transactions on Knowledge and Data Engineering, 14(1), 189-201.
Domingo-Ferrer, J., & Torra, V. (2002). Extending microaggregation procedures using defuzzification methods for categorical variables. In Proceedings of the 1st international IEEE symposium on intelligent systems, 44-49, Verna, September 2002.
Domingo-Ferrer, J., & Torra, V. (2002). Towards fuzzy c-means based microaggregation. In P. Grzegorzewski, O. Hryniewicz & M.A. Gil (Eds.), Advances in soft computing (pp. 289-294). Heidelberg: Physica-Verlag.
Domingo-Ferrer, J., & Torra, V. (2003). Fuzzy microaggregation for microdata protection. Journal of Advanced Computational Intelligence and Intelligent Informatics, 7(2), 153-159.
Domingo-Ferrer, J., & Torra, V. (2005). Ordinal, continuous and heterogeneous kanonymity through microaggregation. Data Mining and Knowledge Discovery, 11(2), 195-212.
Domingo-Ferrer, J., Seb, F., & Solanas, A. (2008). A polynomial time approximation to optimal multivariate microaggregation. Computer and Mathematics with Applications, 55(4), 714-732.
Han, J.M., Cen, T.T., Yu, H.Q., & Yu, J. (2008). A multivariate immune clonal selection microaggregation algorithm. In Proceedings of the IEEE international conference on granular computing, pp. 252-256, Hangzhou, February 2008.
Hansen, S., & Mukherjee, S. (2003). A polynomial algorithm for optimal univariate microaggregation. IEEE Transactions on Knowledge and Data Engineering, 15(4), 1043-1044.
Laszlo, M., & Mukherjee, S. (2005). Minimum spanning tree partitioning algorithm for microaggregation. IEEE Transactions on Knowledge and Data Engineering, 17(7), 902-911.
Oganian, A., & Domingo-Ferrer, J. (2001). On the complexity of optimal microaggregation for statistical disclosure control. Statistical Journal of the United Nations Economic Commission for Europe, 18, 345-354.
Solanas, A., Martinez-Balleste, A., & Domingo-Ferrer, J. (2006). V-MDAV: A multivariate microaggregation with variable group size. In Proceedings of the 17th COMPSTAT Symposium of the IASC, Rome, August 2006.
[16] Samarati, P. (2001). Protecting respondent’s privacy in microdata release. IEEE Transactions on Knowledge and Data Engineering, 13(6), 1010–1027.
Sweeney, L. (2002). k-Anonymity: A model for protecting privacy. International Journal on Uncertainty, Fuzziness and Knowledge-based Systems, 10(5), 557-570.
Torra, V. (2004). Microaggregation for categorical variables: A median based approach. In J. Domingo-Ferrer & V. Torra (Eds.), LNCS (pp. 162-174), Heidelberg: Springer.
Ward, J.H.J. (1963). Hierarchical grouping to optimize an objective function. Journal of the American Statistical Association, 58(301), 236-244.
Willenborg, L., & Waal, T.D. (2001). Elements of statistical disclosure control. Lecture notes in statistics, 155.
Zahn, C.T. (1971). Graph-theoretical methods for detecting and describing gestalt clusters. IEEE Transactions on Computers, C-20 (1), 68-86.