making: A sensemaking perspective
.
White Rose Research Online URL for this paper:
http://eprints.whiterose.ac.uk/81683/
Book Section:
Lau, LMS, Yang-Turner, F and Karacapilidis, N (2014) Requirements for big data analytics
supporting decision making: A sensemaking perspective. In: Karacapilidis, N, (ed.)
Mastering data-intensive collaboration and decision making. Springer Science & Business
Media , 49 - 70. ISBN 3319026127
https://doi.org/10.1007/978-3-319-02612-1_3
[email protected] https://eprints.whiterose.ac.uk/ Reuse
Unless indicated otherwise, fulltext items are protected by copyright with all rights reserved. The copyright exception in section 29 of the Copyright, Designs and Patents Act 1988 allows the making of a single copy solely for the purpose of non-commercial research or private study within the limits of fair dealing. The publisher or other rights-holder may allow further reproduction and re-use of this version - refer to the White Rose Research Online record for this item. Where records identify the publisher as the copyright holder, users can verify any specific terms of use on the publisher’s website.
Takedown
If you consider content in White Rose Research Online to be in breach of UK law, please notify us by
Requirements for Big Data Analytics
Supporting Decision Making:
A Sensemaking Perspective
Lydia Lau, Fan Yang-Turner and Nikos Karacapilidis
Abstract Big data analytics requires technologies to efficiently process large quantities of data. Moreover, especially in decision making, it not only requires individual intellectual capabilities in the analytical activities but also collective knowledge. Very often, people with diverse expert knowledge need to work together towards a meaningful interpretation of the associated results for new insight. Thus, a big data analysis infrastructure must both support technical innovation and effectively accommodate input from multiple human experts. In this chapter, we aim to advance our understanding on the synergy between human and machine intelligence in tackling big data analysis. Sensemaking models for big data analysis were explored and used to inform the development of a generic conceptual architecture as a means to frame the requirements of such an analysis and to position the role of both technology and human in this synergetic rela-tionship. Two contrasting real-world use case studies were undertaken to test the applicability of the proposed architecture for the development of a supporting platform for big data analysis. Reflection on this outcome has further advanced our understanding on the complexity and the potential of individual and collaborative sensemaking models for big data analytics.
Keywords Requirement elicitation
Model-driven
Sensemaking conceptual architecture
L. Lau (&)
F. Yang-Turner
School of Computing, University of Leeds, Leeds LS2 9JT, UK e-mail: [email protected]
F. Yang-Turner
e-mail: [email protected]
N. Karacapilidis
University of Patras and Computer Technology Institute & Press ‘‘Diophantus’’, 26504 Rio Patras, Greece
e-mail: [email protected]
N. Karacapilidis (ed.),Mastering Data-Intensive Collaboration and Decision Making, Studies in Big Data 5, DOI: 10.1007/978-3-319-02612-1_3,
Springer International Publishing Switzerland 2014
3.1 Introduction
The ‘‘big data’’ phenomenon is now present in every sector and function of the global economy [29]. Contemporary collaboration settings are often associated with huge, ever-increasing amount of multiple types of data, which vary in terms of relevance, subjectivity and importance. Extracted knowledge may range from individual opinions to broadly accepted practices. Today’s businesses face chal-lenges not only in data management but in big data analysis, which requires new approaches to obtain insights from highly detailed, contextualised, and rich contents. In such settings, collaborative sensemaking very often take place, orchestrated or otherwise, prior to actions or decision making [34]. However, our understanding on how these tools may interact with users to foster and exploit a synergy between human and machine intelligence quite often lags behind the technologies.
The term ‘‘data analytics’’ is often used to cover any data-driven decision making. A major investment in big data, properly directed, can result not only in major scientific advances, but also lay the foundation for the next generation of advances in science, medicine, and business [1]. To help decision making, data analysts choose informative metrics that can be computed from available data with the necessary algorithms or tools, and report the results in a way the decision makers can comprehend and act upon. Big data analytics is a workflow that distils terabytes of low-value data (e.g., every tweet) down to, in some cases, a single bit of high-value data (e.g., should Company X acquire Company Y?) [5].
Technologies such as data mining, machine learning and semantic web are being exploited to build infrastructures and advanced algorithms or services for big data analytics. Most of the services and algorithms are built in a technology-driven manner with little input from users to drive the development of the solutions. This may be due to: (1) users usually have few ideas about how the emerging tech-nologies can support them; (2) problems described by users are quite general, such as ‘‘information overload’’, ‘‘data silos everywhere’’ or ‘‘lack of holistic view’’, and (3) goals set by users are often unclear, such as ‘‘find something valuable’’, ‘‘get an impression’’, or ‘‘obtain deep understandings’’. It is challenging to follow traditional approach of gathering user requirements to lead solution development using emerging technologies [16].
Another approach could be a technology-driven one, i.e., how to make the technology improve user’s work practice. However, given a diverse set of business analytics situation and the fact that more and more analytics algorithms are developed, it is challenging to leverage the strengths and limitations of Big Data technologies and apply them in different domains [15].
This chapter sets out to bridge the gap between user-driven and technology-driven approaches for requirements analysis in big data problems and addresses the following research questions:
• Question 1:How to derive requirements in big data analytics which are drawn
• Question 2: Can we extract commonalities and differences across diverse
application domains to advance our understanding of requirements for big data analytics?
• Question 3: Can a conceptual architecture be useful for bringing user and
technology perspectives together to develop specific big data analytics platform?
Led by the above questions, we took a socio-technical approach on requirement modelling and adapted individual and collaborative sensemaking frameworks to guide our investigation on requirements of big data analytics. This study is part of the Dicode EU research project (http://dicode-project.eu), which aims at facili-tating and augmenting collaboration and decision making in data-intensive and cognitively-complex settings. In particular, emphasis is given to the deepening of our insights about the proper exploitation of big data, as well as to collaboration and sensemaking support issues [9].
Our contribution is to operationalise sensemaking models to help understand the distribution of human and machine intelligence in the use of a big data ana-lytics platform. The resulting conceptual architecture provides a framework which enables the main components to evolve systematically through a dialogue between users and technology suppliers.
The chapter proceeds as follows. InSect. 3.2, we discuss sensemaking for big data analytics. InSect. 3.3, we present our three-step methodology for requirement elicitation. InSects. 3.4,3.5and3.6, we describe the details of these three steps in the context of Dicode’s use cases. InSect. 3.7, we conclude the chapter and discuss on the implications of this study to support big data analytics.
3.2 Sensemaking for Big Data Analytics
Big data analytics, as an emerging area, has gained attention by both IT industry and academic research communities. From an infrastructure point of view, the top three commercial database suppliers—Oracle, IBM, and Microsoft—have all adopted Hadoop framework as their big data analytic platform [7]. Industry analysis pointed out that there are challenges not just in volume, but also in variety (the heterogeneity of data types, representation, and semantic interpretation) and velocity (both the rate at which data arrive and the time in which it must be acted upon) [6]. A community white paper developed by leading researchers across the United States argued that the challenges with big data include not just the obvious issues of scale, but also heterogeneity, timeliness, privacy and human collabora-tion [1]. This is a complex issue, and the gap between the number of companies which can make use of big data for transformational advantage and those that cannot is widening [9].
information and knowledge. To analyse the data, an analyst may need to figure out questions suitable for the particular context, aiming to obtain new insight. In fact, we currently have a major bottleneck in the number of people empowered to ask questions of the data and analyse them [16]. As Barton and Court [2] aptly explained, a clear strategy for how to use big data analytics for competitive advantage requires a pragmatic approach to balance technical theories and prac-ticalities. They suggested that business leaders can address short-term big data needs by working with their chief information officers to prioritize requirements. In our study, we took a sensemaking perspective to understand the cognitive complexity of big data analytics, both individually and collaboratively. We then investigated the common activities of two use cases guided by the sensemaking frameworks to inform the design of a generic conceptual architecture for sense-making. This architecture will illustrate the important components and their relationship at an abstract level for a quick overview of possible big data analytics solutions.
3.2.1 Individual Sensemaking
Sensemaking is an iterative cognitive process that the human performs in order to build up a representation of an information space that is useful to achieve his/her goal [25]. Sensemaking has been used in various fields such as organizational science [30], education and learning sciences [27], communications [4], human-computer interaction (HCI) [25], and information systems [26]. In communica-tions, HCI and information science, sensemaking is broadly concerned with how a person understands and reacts to a particular situation in a given context. Cognitive models that describe the human sensemaking process can be helpful to point at what operations users in collaborative spaces may perform and what support they may need. One particular notional model developed by Pirolli and Card [22], which describes the sensemaking loop for intelligence analysis, helps us to identify particular sensemaking operations that a distributed data mining approach can support in a collaborative environment. The model distinguishes between two cognitive loops of intelligent analysis:
• The foraging loop, which involves operations such as seeking, searching,
fil-tering, reading, and extracting information; and
• The sensemaking loop, which involves operations such as searching for
evi-dence, searching for support, and re-evaluation, which aim to develop a mental model from the schema that best fits the evidence.
relevant to the needs. In the sensemaking loop, on the other hand, the user tries to induce potential high-level schemas, or themes, from the identified topics. This is done by inducing the relations between the topics and evaluating the accuracy of those schemas. For example, if the user relates a collection of identified topics that include the terms {facebook, twitter, tweets, blogs, wordpress, wiki} to each other, she may be able to induce a high-level theme, which is {social media}, since the combination of the preceding topics is highly relevant to that theme.
Many forms of intelligence analysis are so-called sensemaking tasks [22]. Such tasks consist of information gathering, representation of the information in a schema that aids analysis, the development of insight through the manipulation of this representation, and the creation of some knowledge product or direct action based on the insight. The basis of an analyst’s skill is to quickly organise the flood of incoming information and present his/her analysis in reports. The process of
creating a representation of a collection of information that allows the analyst to perceive structure, form and content within a given collection is defined as sensemaking.
Different sensemaking models have revealed various characteristics of the analytical processes of intelligence analysts. Dervin illustrated that sensemaking occurs when a person embedded in a particular context and moving through time-space, experiences a gap in reality. Russell et al. [25] studied cost structure of sensemaking and modelled sensemaking as cyclic processes of searching for external representations and encoding information into these representations to reduce the cost of tasks to be performed. Klein et al. [13] defines sensemaking as a motivated, continuous effort to understand connections (which can be among people, places, and events) in order to anticipate their trajectories and act effectively.
3.2.2 Collaborative Sensemaking
Sensemaking extends beyond individuals making sense of their own information spaces. It is increasingly common for a group of people needing to work together to understand complex issues, combining information from multiple data sources and bringing together different experience and expertise towards a shared understanding.
proposed a conceptual model of collaborative sensemaking, which distinguishes between shared representation and shared understanding. They also argued that collaborators could develop a shared understanding by examining, manipulating and negotiating external representations. Paul and Reddy [20] have discussed a framework of collaborative sensemaking during Collaborative Information Seek-ing (CIS) activities and the design implications for supportSeek-ing sensemakSeek-ing in collaborative information retrieval tools.
3.3 A Model-Driven Requirement Elicitation Methodology
To answer the three research questions as discussed in the introduction, the fol-lowing steps were taken in the big data analytics requirements methodology for Dicode across the use cases.
3.3.1 Context of Investigation and Use Cases
The Dicode project aimed at facilitating and augmenting collaboration and deci-sion making in data-intensive and cognitively-complex settings. To do so, whenever appropriate, it built on prominent high-performance computing para-digms and large data processing technologies to meaningfully search, analyse and aggregate data existing in diverse, extremely large, and rapidly evolving sources. At the same time, particular emphasis was given to the deepening of our insights about the proper exploitation of big data, as well as to collaboration and sense making support issues. Building on current advancements, the solution provided by the Dicode project brings together the reasoning capabilities of both the machine and the humans. It can be viewed as an innovative ‘‘workbench’’ incorporating and orchestrating a set of interoperable services that reduce the data-intensiveness and complexity overload at critical decision points to a manageable level, thus permitting stakeholders to be more productive and effective in their work practices.
Two Dicode’s use cases with different collaboration and decision making set-tings are used as illustration of our methodology in this chapter, each associated with diverse types of data and data sources.
• Clinico-Genomic Research (CGR): this case concerns biomedical researchers
who collaborate to explore scientific findings using very large datasets (a full description of this case appears inChap. 8).
• Social Opinion Monitoring(SOM): this case concerns social media marketing
3.3.2 Overview of the Methodology
The methodology deployed in the context of Dicode for requirement elicitation consists of the following three steps:
3.3.2.1 Step 1: Requirement Elicitation from Scenarios
A scenario-driven approach was used to capture from the stakeholders their views on current practice in selected data intensive and cognitively complex processes, and the initial vision on what could be improved from both users and technolo-gists. A Dicode specific requirement elicitation strategy was designed and deployed to tackle the seemingly diverse use cases [31]. Common characteristics were extracted to identify common interests for technological innovation. This step mobilised ideas from both users and technologists.
3.3.2.2 Step 2: Application of Sensemaking Models
In addition to data collection from the ground, theoretical models for sensemaking were identified for a deeper understanding of sensemaking behaviour in each of the use cases. We considered an individual sensemaking model which provides a detailed view of data-driven analysis when trying to make sense of large volume of data. We supplemented it by a collaborative sensemaking model which presents the triggers of collaboration and characteristics of building shared understanding. The models provide a common framework for comparison in order to identify the commonalities and differences in sensemaking activities within different context. This step provided focus for users and technologists in positioning the benefits of proposed technical solutions and when these could be used.
3.3.2.3 Step 3: Conceptual Architecture for Big Data Analytics
Finally, a conceptual architecture was developed as a high level specification of how the various tools might work together for each of the use cases in a big data analytics platform. In designing the architecture, we followed the IS design research process proposed by Peffers and his colleagues [21] and aimed to create useful artefacts that solve relevant design problems in organizations [8,18]. Usage scenarios were produced to walk through how the platform may be used. This step provided a high level blue print which could be used as a communication tool between the users and the technologists on requirements.
underpinning sensemaking frameworks we adopted to guide our study: an intel-ligent analysis framework that presents how an individual analyst makes sense of large volume of data; and a framework of collaborative sensemaking during Collaborative Information Seeking (CIS) activities. We then introduce our generic conceptual architecture in Sect. 3.6 and its instantiations in two different appli-cation domains.
3.4 Requirement Elicitation from Scenarios
As the first step, we mobilised the tacit knowledge of use case partners by involving them in describing typical scenarios of current work practice in their areas. Data collection in this phase were directed at the facts about users and communities involved, data sources and data formats used as well as collaboration and decision making activities. Scenarios with sample data were provided on a wiki for all partners to read and discuss. These facts were essential to be under-stood as a benchmark so that Dicode could work on augmentation and facilitation to improve the current work practice.
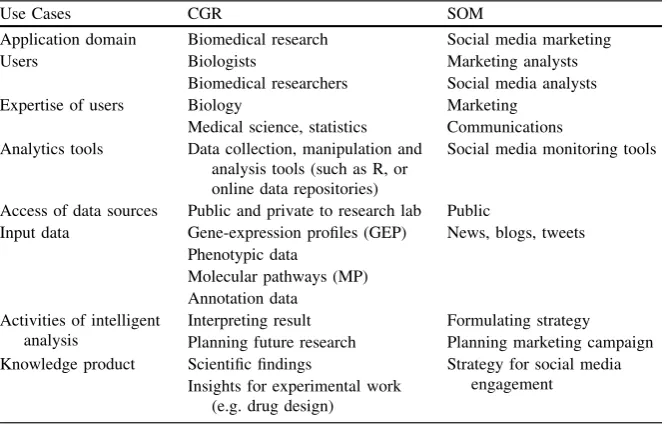
A summary of two Dicode use cases (Table3.1) shows that they had common issues related to a newly forming area for research, namely big data analytics.
Fundamentally, big data analytics is a workflow that distils terabytes of low-value data (e.g., every tweet) down to, in some cases, a single bit of high-value data (should Com-pany X acquire ComCom-pany Y? can we reject the null hypothesis?) ([1], p. 50).
From a high level perspective, both use cases are from different domains; the users have different expertise and use different analytics tools. They deal with different data from different data sources, with stakeholders making different decisions for different purpose in their work. However, all of them are dealing with intelligent analysis to transform input data into knowledge product in order to see the ‘‘big picture’’ from a large collection of information.
Use case partners were then asked to describe their vision on a future system. It would be difficult for an individual user to give a complete scenario of how Dicode system might change their current practice. Therefore, in this phase, user stories were collected, in which users talked about their expectations about how Dicode could help (i.e. facilitate, augment) their work in the future. After analyzing all users’ stories, we realized that at that stage users could only suggest small incremental change on their current work practice, which would not fully exploit the potentials that new technology would bring. In other words, information col-lected from users could not produce the desired innovation, and associated structured system requirements which could benefit from cutting edge technology. Input from technical partners into the requirement elicitation process was needed to stimulate a co-design culture.
partners and technical partners about their ideas are facilitated. Technical partners were given the chance to evangelizing their ideas. For use case partners, they were encouraged to open their mind and seek new opportunities from new technologies. It was expected that use case partners and proposals from technical partners could diverge from each other. It is the future work practice, which takes both vision and proposals into account, to unify those differences. In Dicode, the results of this unifying were:
• a generic conceptual architecture to guide the design of services for each use
case, in which requirements related to interfaces between services will be made explicit;
• a set of functional specifications that guide the first iteration of development.
3.5 Application of Sensemaking Models
To better understand the use cases in terms of intelligent analysis process, we included a social modelling approach to requirements engineering. This approach is driven by a priori understanding, through theories and models, of how human make sense of data and then apply that understanding to derive requirements from the use cases. Here, we describe the concepts and theoretical perspectives employed in our study, which are related to individual and collaborative sensemaking.
[image:10.439.54.388.71.283.2]For individual sensemaking, we have chosen the model of Pirolli and Card [22] as it provides the means for identifying new technologies for improving the production
Table 3.1 Summary of two dicode use cases
Use Cases CGR SOM
Application domain Biomedical research Social media marketing
Users Biologists Marketing analysts
Biomedical researchers Social media analysts
Expertise of users Biology Marketing
Medical science, statistics Communications Analytics tools Data collection, manipulation and
analysis tools (such as R, or online data repositories)
Social media monitoring tools
Access of data sources Public and private to research lab Public
Input data Gene-expression profiles (GEP) News, blogs, tweets Phenotypic data
Molecular pathways (MP) Annotation data
Activities of intelligent analysis
Interpreting result Formulating strategy Planning future research Planning marketing campaign Knowledge product Scientific findings Strategy for social media
engagement Insights for experimental work
of new intelligence from massive data and its claim echoes ours in terms of sense-making is a process of transformation of information into a knowledge product.
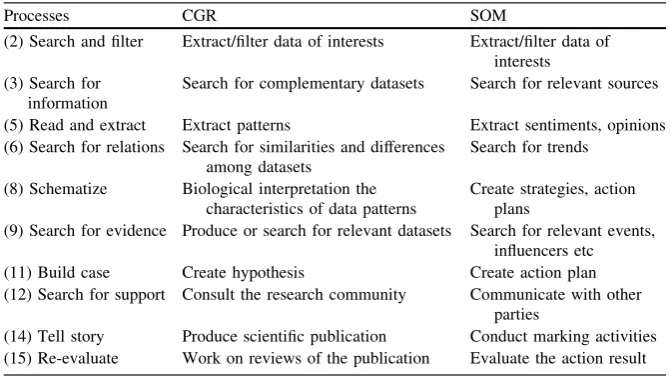
Figure3.1summarizes how an analyst comes up with new information. The sequence of rectangular boxes represents an approximate data flow. The circles represent the process flow. The processes and data are arranged by degree of effort and degree of information structure. This is a process with lots of backward loops and seems to have one set of activities that cycle around finding information and another that cycles around making sense of the information, with plenty of interaction between these. The overall information processing can be driven by bottom-up processes (from data to theory) or top-down (from theory to data) and their analysis suggested that top-down process (process 2, 5, 8, 11, 14 in the diagram) and bottom-up processes (process 15, 12, 9, 6, 3) are invoked in an opportunistic mix. According to this framework, the processes of intelligent analysis of two Dicode use cases are identified in Table3.2.
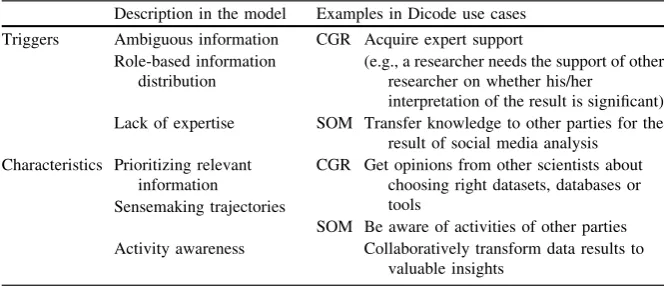
[image:11.439.78.363.57.266.2]For collaborative sensemaking, we find Paul and Reddy’s framework more relevant to our studies because it links individual sensemaking and collaborative sensemaking, and defines triggers and characteristics of sensemaking. In this framework, it highlights important factors that trigger collaborative sensemaking during a CIS activity, namely: ambiguity of information, role-based distribution of information, and lack of expertise. It shows that CIS activities are often initially split into tasks/sub-tasks and sub-tasks are performed by different group members, with different roles and expertise. Roles can be organisational or might be assigned informally. Within this context, action awareness information is shared amongst
group members even during individual sensemaking, i.e., group members keep each other aware of what they are doing.
The framework illustrated in Fig.3.2 highlights that CIS activities often involve individual information seeking and sensemaking and then lead to col-laboration. The framework lists some characteristics of collaborative sensemaking, namely, prioritising relevant information, sensemaking trajectories, and activity awareness. Prioritising the ‘right’ pieces of information as relevant enhances group sensemaking. Knowing the ‘‘path’’ that a group member followed to make sense of information helps other group members’ sensemaking. Such paths are called sensemaking trajectories. Group members share and make sense of information, they create shared representations to store the information found and the sense made of that information. The characteristics and the triggers of collaborative sensemaking identified in this framework provide us a guideline to understand the demand of collaboration in Dicode use cases (Table3.3).
3.6 Conceptual Architecture for Big Data Analytics
[image:12.439.52.388.70.259.2]Derived from the Dicode use cases and sensemaking frameworks, we developed a generic conceptual architecture to support the characteristics (both differences and commonalities) of big data analytics. This conceptual architecture describes the important components and their relationship at an abstract level and provides a framework for specifying, comparing and contrasting big data analytics implementations.
Table 3.2 Processes of intelligent analysis of dicode use cases
Processes CGR SOM
(2) Search and filter Extract/filter data of interests Extract/filter data of interests (3) Search for
information
Search for complementary datasets Search for relevant sources
(5) Read and extract Extract patterns Extract sentiments, opinions (6) Search for relations Search for similarities and differences
among datasets
Search for trends
(8) Schematize Biological interpretation the characteristics of data patterns
Create strategies, action plans
(9) Search for evidence Produce or search for relevant datasets Search for relevant events, influencers etc (11) Build case Create hypothesis Create action plan (12) Search for support Consult the research community Communicate with other
parties
The conceptual architecture aims to provide a framework without implemen-tation of components, from which different big data analytics solutions can be constructed and implemented as long as they can fulfil their roles in the archi-tecture. The conceptual architecture illustrates:
• A big data analytics solution consists of services or algorithms that exploit both
machine capability (data-centric services) and human intelligence (collaboration-centric services).
• To facilitate and ensure the integration of machine capability and human
intelligence, integration-centric services are needed to support users interact with both data-centric services and collaboration-centric services and provide mechanisms to integrate the result of two types of services.
• All services or algorithms together support the big data transformation from raw
format to knowledge product (bottom-up) or from hypothesis to resources (top-down).
• Human intelligence should be involved in the whole process of data
transfor-mation, including configuring data-centric services, interpreting the result of data-centric services, collaborating with other experts on interpreting and sharing the results.
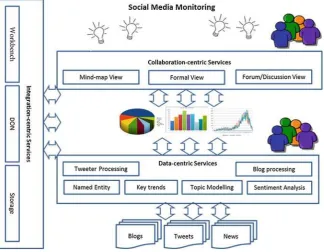
As shown in the architecture diagram (Fig.3.3), there are three types of components:
• Data-centric services, which exploit large data processing technology to
meaningfully search, analyse and aggregate data from heterogeneous data sources. The input of the data-centric services is structured and/or unstructured data from heterogeneous data sources. The output of data-centric services is searched or filtered information, discovered patterns or lists etc. The data-centric services aim to improve the processes of individual sensemaking.
• Collaboration-centric services, which support people and their interaction by
[image:14.439.53.388.71.214.2]capturing and sharing resources, opinions, arguments and comments among participants, so to facilitate the collective understanding of the issues related to data analysis. The input of the collaboration-centric services could be the output of data-centric services as well as the interactions (comments, arguments and discussions etc.) among all parties. The knowledge product (hypothesis, strategies
Table 3.3 Collaborative Sensemaking Triggers and Characteristics of Dicode Use Cases Description in the model Examples in Dicode use cases
Triggers Ambiguous information CGR Acquire expert support
(e.g., a researcher needs the support of other researcher on whether his/her
interpretation of the result is significant) Role-based information
distribution
SOM Transfer knowledge to other parties for the result of social media analysis Lack of expertise
Characteristics Prioritizing relevant information
CGR Get opinions from other scientists about choosing right datasets, databases or tools
Sensemaking trajectories
SOM Be aware of activities of other parties Activity awareness Collaboratively transform data results to
etc.) should be the outcome of their interaction. The collaboration-centric services aim to support collaborative sensemaking.
• Integration-centric services, which support data-centric services and collabo-ration centric-services. Integcollabo-ration-centric services are to ensure and facilitate the seamless integration of the independent services developed. Related func-tions include user interface, data storage and integration mechanisms etc. The integration-centric services implemented in Dicode project are the Dicode Workbench, the Dicode ONtology and the Storage Service.
The Dicode Workbench (see Chap. 7) provides a web user interface with
functions of user management and service management. Through the Dicode Workbench, users can access different services (data-centric services and collab-oration-centric services) developed within the Dicode project via widgets [3].
TheDicode Ontology(DON) is a multi-layered ontology, designed to address
[image:15.439.59.379.65.314.2]requirements from multiple use cases that involve sensemaking [28]. DON is used as a common vocabulary among services and service developers for enhancing the functionality of Dicode services. DON plays a crucial role to facilitate the inte-gration and interoperability of services. The main idea is that some features of the services will be annotated using concepts included in the DON. The information about services and their annotations will be maintained in a central registry
(Dicode Service Registry—DSR). This registry will be available for the rest of the components of the Dicode environment through a REST interface.
TheStorage Serviceis to provide Dicode users with a permanent and reliable
storage place to keep resources accessible. The service will be as generic as possible to allow storing any kind of files (text plain, doc, pdf, html, xml, json, zip, etc.). The service provides mechanisms to upload files and retrieve them by using RESTful services. Additionally, meta-data information about files will be also stored to facilitate their search and location by search engines or services. These meta-data will contain information such as type of file (pdf, html, xml, etc.) or type of content (medical report, DNA sequence, etc.).
3.6.1 Usage Scenario for CGR
We present an example on how Bioinformatics researchers benefit from Dicode platform for their work:
Sarah(Ph.D.student),James(Postdoctoral Researcher)and John(Professor,
supervisor of Sarah and James) are three researchers from a Breast Cancer research institution. They have conducted some studies on a small sample-size gene-expression microarray breast cancer dataset. The analysed result is not satisfactory but they believe that some extra datasets from public resources,such as Gene Expression Omnibus(GEO)with the same pathology characteristics can augment their sample size and allow them to identify some extra statistically significant genes.
All of them are usingDicode Workbenchto coordinate their work and support their research. Each of them has an account on the Dicode workbench and this enables them securely share their work. Using theStorage service,both Sarah and James have uploaded some graphs and data on what they have found out from their studies.
Working towards a publication,Sarah has added thePubMed serviceto their Dicode workbench.Using this service, she discovers relevant publications which address similar biological questions and may be used to justify their sample size choice.The result from PubMed tool has been recorded and can be seen by James and John at any time.
Having a brief idea about their sample size,the team‘‘meet’’ in the
Collabo-ration workspaceto brainstorm their ideas and their opinions (agree,disagree,
comments,ideas,support documentsetc.).
To understand more about James’ work, Sarah asks James to upload his R-script as she wants to know whether a few arguments(lines of code) could be rearranged.Using theR service,James run his R-script with some new arguments and a new graph is easily produced for everybody to assess the new strategy and decide on the significance of the results.
Recommender serviceto get the datasets.He types in the request describing the data and also the methodology he will apply.All qualified datasets are provided in a list.
From the list of recommended datasets, Sarah wants to find the functional interpretation of expressed genes in two datasets and compare them. She first launches the R service to identify expressed genes. In the second step, she uses
Subgroup Discovery service, which provides a list of subgroups describing the
expressed according to their molecular function and their role in biological process,which has shown a good match to their previous findings.
3.6.2 Architecture for CGR
Biomedical research has become increasingly interdisciplinary and collaborative in nature. The vast amount of the data available and the ever increasing specialised resources show that the way forward is to form biomedical research collaboration teams to address complex research questions. To support this use case, the Dicode solution (Fig.3.4) is to support biomedical research community to work together dealing with increasing volume and diversity of data sources:
• Gene-Expression profiles (GEP): Gene-expression data (normalized or raw data); • Phenotypic data: Supplementary, clinical or phenotypic data available; • Molecular Pathways (MP): Data from known and established molecular
networks;
• Annotation data: Reference databases for biomedical and genomic information.
The data-centric services are developed to deal with data processing and analysis in this field, such as:
• Subgroup Discovery service (seeChap. 5) provides the tool for the functional
interpretation of gene expression data that combine and use knowledge stored in Gene Ontology database. The interpretation involves translating these data into useful biological knowledge. It is solved by constructing new features from Gene Ontology and finding the most interesting rules using Subgroup Discovery algorithm.
• PubMed service (see Chap. 8) provides access to PubMed but with extra
improvements created for Dicode allowing data exchange with other services within Dicode workbench.
• R service (see Chap. 5) executes R-Scripts in Dicode and to perform custom
data processing and data mining tasks.
• GEO Recommender service (see Chap. 5) provides relevant and interesting
3.6.3 Usage Scenario for SOM
We present below an example on how social media analysts benefit from Dicode platform for their work:
A car manufacturer is launching a new product. In this process,three main parties are involved. One is a Brand Manager (Frank) from the marketing department of the company. The second one is a Social Media Analyst (Alice)
working in a marketing consultancy. The third one is Social Media Engager
(Natalie) working in a public relations agency responsible for social media engagement.
TheDicode Workbenchallows all three parties to collaborate during the whole
process. Frank has a question about first consumer experiences with the new product in the social web and gives a briefing to Alice.
Alice starts analysing the web and updates the results in the Collaboration
workspace. She watches over social media and provides advice to the Brand
Manager. She detects the significant conversations and news articles with the
Topic Detection serviceand looks for insights as a basis for product development
[image:18.439.60.385.59.326.2]or communications from the blogs and tweets. If she wants to get deeper infor-mation on relevant tweets detected,she can useKeytrends serviceto show trends
on Twitter,such as the top links for a certain day posted by twitter users. She can also use Phrase Extraction service with the pre-trained sentiment model to monitor positive or negative sentiments that are expressed in connection with the brand.
Frank can directly ask questions and/or give advice to control the research conducted by Alice. Natalie can access the results that Frank and Alice have provided to understand more about the current opinions from social media.
In parallel,Frank can start thinking about marketing activities to promote the product or to change packaging and/or communications. He can pre-align the activities with further involved parties in and out of the company.At the meantime,
Frank can quickly brief Natalie on engaging with identified blogs.
3.6.4 Architecture for SOM
In a fast-changing world, where social media is influencing consumer demands, a successful media engagement strategy depends on the collaboration of all relevant parties—public relations, brand, media and marketing. In this instantiated archi-tecture (Fig.3.5), the data sources are specific in social media monitoring: dedi-cated news feeds, tweets and blogs. Consequently, the services are chosen to deal with data processing and analysis in this field, such as topic, and sentiment analysis, etc.
• Named Entity service (seeChap. 5) returns disambiguated Named Entities for
Dicode’s document corpora (currently Twitter and blogs). The service identifies Named entities of the following types: PERSON, PLACE, ORGANISATION and WORK and returns a Freebase URI for each entity. Named entity disam-biguation is performed based on the context of the analysed surface form. The quality of disambiguation depends usually increases with text size.
• Keytrends service returns metadata about tweets on a selected day. Based on
metadata: Hashtags (Top hashtags), Language (Languages of tweets), Country (Country code of Twitter user), Place (Places of Twitter user [only available for few tweets]) and Urls (Urls mentioned in tweets)
• Topic Detection service (seeChap. 5) gives the user a quick albeit superficial
overview of the thematic content of a document collection, including a visu-alization of the results. The visuvisu-alization provides a quick overview of the topics that are present in a text collection as well as their interrelations. Users will also be able to zoom in on a graph detail related to a particular topic.
• Sentiment Analysis serviceworks on pre-trained models to extract positive and
3.7 Conclusion and Future Research
Traditionally, the task of the requirements analyst is to collect requirements and statements from stakeholders: the customer and representatives of users. These statements say what the system should do (functionality) and at what levels of quality (non-functional properties such as performance, reliability, extensibility, usability, and costs). However, users and customers are often not able to articulate these wants directly. Instead, the analyst needs to help them uncover their real needs. Users are often unaware of what is possible or have misconceptions about what is feasible, especially when technology is advancing quickly. For that, we claim that we should seek resources, such as existing models and frameworks developed in other disciplines, which can be integrated into requirement modelling processes. This in turn enables subsequent evaluation processes [23,32].
[image:20.439.59.384.61.313.2]The complexity of the big data analytics presents a formidable challenge for modelling and analysis [11]. Rather than modelling the domain from scratch, we brought cognitive models into the requirement engineering to analyse the features of data and the details of user activities. In this article, underpinned by sense-making models, we proposed a conceptual architecture to understand the user requirements and system characteristics of big data analytics. Specially, we emphasize that a big data analytics solution consists of components that exploit
both machine capability and human intelligence. To facilitate and ensure the integration of machine capability and human intelligence, integration-centric components are needed to provide seamless experience of users. The fundamental goal of a solution is to support the big data transformation from raw format to knowledge products.
In summary, this chapter makes the following contributions to the literature.
• A sensemaking perspective to understand big data analytics, which emphasises
the human aspects of big data analytics.
• A generic conceptual architecture, which illustrates the essential components
and their relationship to provide effective and comprehensive IT support for big data analytics.
• A demonstration of two instantiations of the generic architecture of two use
cases to provide examples of big data solutions relative to a situation in a specific organization.
This approach opens up an extra channel to requirements modelling and analysis, which is based on transforming and analysing theoretical models from social science and cognitive science to a design artefact. The research work reported in this chapter provides an illustration of how theoretical models were selected and applied to the analysis and design of the architecture. We hope this modest attempt at bringing social science or cognitive science models into requirement engineering will complement the traditional requirement modelling process. Much more work is needed to refine our method to meet the practical needs of requirements analyst and engineers.
References
1. Agrawal, D., et al.: Challenges and opportunities with big data. Proc. VLDB Endow.5(12), 2032–2033 (2012)
2. Barton, D., Court, D.: Making advanced analytics work for you. Harv Bus. Rev.90(10), 78–83 (2012)
3. de la Calle, G, Alonso-Martínez, E., Tzagarakis, M., Karacapilidis, N.: The dicode workbench: a flexible framework for the integration of information and web services. In: Proceedings of the 14th International Conference on Information Integration and Web-based Applications and Services (iiWAS2012), Bali, Indonesia, 3–5 Dec 2012, pp. 15–25 (2012) 4. Dervin, B.: From the mind’s eye of the user: the sense-making qualitative-quantitative
methodology. In: Dervin, B., Foreman-Wernet, L., Lauterbach, E. (eds.) Sense-Making Methodology Reader: Selected Writings of Brenda Dervin. Hampton Press Inc, Cresskill (2003)
5. Fisher, D., DeLine, R., Czerwinski, M., Drucker, S.: Interactions with big data analytics. Interactions19(3), 50–59 (2012)
6. Gartner, Inc.: Pattern-based strategy: getting value from big data. Gartner Group press release, July 2011.http://www.gartner.com/it/page.jsp?id=1731916
8. Hevner, A.R., March, S.T., Park, J., Ram, S.: Design science in information systems research. MIS Q.28(1), 75–105 (2004)
9. Karacapilidis, N.: Mastering data-intensive collaboration and decision making through a cloud infrastructure: the dicode EU project. EMBnet. J.17(1), 3 (2011)
10. Karacapilidis, N., Rüping, S., Tzagarakis, M., Poigné, A., Christodoulou, S.: Building on the synergy of machine and human reasoning to tackle data-intensive collaboration and decision making. Intelligent Decision Technologies. Springer, Berlin, 2011, pp. 113–122
11. Kiron, D., Shockley, R., Kruschwitz, N., Finch, G., Haydock, M. Analytics: the widening divide. MIT Sloan Manage. Rev.53(3), 1–20 (2011)
12. Kittur, A., Chau, D.H., Faloutsos, C., Hong, J.I.: Supporting Ad hoc sensemaking: integrating cognitive, hci, and data mining approaches. In: Sensemaking Workshop at CHI, Boston, MA (2009)
13. Klein, G., Moon, B., Hoffman, R.R.: Making sense of sensemaking 2: a macrocognitive model. Intel. Syst. IEEE21(5), 88–92 (2006)
14. Lee, C.P., Abrams, S.: Group sensemaking. In: Position Paper for Workshop on Sensemaking. ACM Conference on Human Factors and Usability (CHI), Florence, Italy (2008)
15. Lim, E.-P., Chen, H., Chen, G.: Business intelligence and analytics: research directions. ACM Trans. Manage. Inf. Syst. (TMIS)3(4), 17 (2013)
16. Lohr, S.: The age of big data. New York times, Feb 11, 2012 (2012).http://www.nytimes. com/2012/02/12/sunday-review/big-datas-impact-in-the-world.html
17. Maiden, N., Jones, S. Karlsen, K., Neill, R., Zachos, K., Milne, A.: Requirement engineering as creative problem solving: a research agenda for idea finding. In: Proceedings of 18th IEEE International Conference on Requirements Engineering (RE’10). IEEE Press, pp. 57–66 (2010)
18. March, S.T., Smith, G.F.: Design and natural science research on information technology. Decis. Support Syst.15(4), 251–266 (1995)
19. Ntuen, C.A., Balogun, O., Boyle, E., Turner, A.: Supporting command and control training functions in the emergency management domain using cognitive systems engineering. Ergonomics49(12–13), 1415–1436 (2006)
20. Paul, S.A., Reddy, M.C.: Understanding together: sensemaking in collaborative information seeking. In: Proceedings of the 2010 ACM Conference on Computer Supported Cooperative Work. ACM (2010)
21. Peffers, K., Tuunanen, T., Rothenberegr, M.A., Chatterjee, S.: A design science research methodology for information systems research. J. Manage. Inf. Syst.24(3), 45–77 (2007) 22. Pirolli, P., Card, S.: The sensemaking process and leverage points for analyst technology as
identified through cognitive task analysis. In: Proceedings of International Conference on Intelligence Analysis, vol. 5 (2005)
23. Qu, Y., Furnas, G.: Model-driven formative evaluation of exploratory search: a study under a sensemaking framework. Inf. Process. Manage.44(2), 534–555 (2008)
24. Qu, Y., Hansen, D.L.: Building shared understanding in collaborative sensemaking. In: Proceedings of CHI 2008 Sensemaking Workshop, 2008
25. Russell, D.M., Stefik, M.J., Pirolli, P., Card, S.K.: The cost structure of sensemaking. In: Proceedings of SIGCHI. ACM Press, New York, pp. 269–276 (1993)
26. Savolainen, R.: The sense-making theory: reviewing the interests of a user-centered approach to information seeking and use. Inf. Process. Manage.29(1), 13–18 (1993)
27. Schoenfeld, A.H.: Learning to think mathematically: problem solving, metacognition, and sensemaking in mathematics, In: Grouws, D. (ed.) Handbook of Research on Mathematics Teaching and Learning. MacMillan, New York (1992)
28. Thakker, D., Dimitrova, V., Lau, L., Denaux, R., Karanasios S., Yang-Turner, F.: A priori ontology modularisation in ill-defined domains. In; Proceedings of the 7th International Conference on Semantic Systems. ACM (2011)
30. Weick, K.E.: Sensemaking in Organizations. Sage Publications Inc, Thousand Oaks (1995) 31. Yang-Turner, F., Lau, L.: A pragmatic strategy for creative requirements elicitation: from current work practice to future work practice. In: Workshop on Requirements Engineering for Systems, Services and Systems-of-Systems (RESS), 2011. IEEE (2011)
32. Yang-Turner, F., Lau, L., Dimitrova, V.: A model-driven prototype evaluation to elicit requirements for a sensemaking support tool. In: Proceedings of the 2012 19th Asia-Pacific Software Engineering Conference, vol. 1. IEEE Computer Society (2012). doi:10.1109/ APSEC.2012.129
33. Yu, E.: Modelling strategic relationships for process reengineering. In: Yu, E., Giorgini, P., Maiden, N., Myopoulous, J. (eds.) Social Modeling for Requirements Engineering. The MIT Press, Cambridge (2011)
![Fig. 3.1 Notional model of sensemaking loop for intelligence analysis derived from Cognitivetask analysis (CTA) [22]](https://thumb-us.123doks.com/thumbv2/123dok_us/7944358.196174/11.439.78.363.57.266/notional-model-sensemaking-intelligence-analysis-derived-cognitivetask-analysis.webp)
![Fig. 3.2 A framework for collaborative sensemaking during Collaborative Information Seeking(CIS) activities [20]](https://thumb-us.123doks.com/thumbv2/123dok_us/7944358.196174/13.439.77.364.53.478/fig-framework-collaborative-sensemaking-collaborative-information-seeking-activities.webp)