Int. J. Electrochem. Sci., 7 (2012) 5604 - 5615
International Journal of
ELECTROCHEMICAL
SCIENCE
www.electrochemsci.orgComplex Impedance Spectroscopy Study of Silica Nanoparticles
Via Sol-Gel Method
Noorsaiyyidah Darman Singho, Mohd Rafie Johan*
Nanomaterials Engineering Research Group, Advanced Materials Research Laboratory, Department of Mechanical Engineering, University of Malaya, Lembah Pantai, Kuala Lumpur, 50603 Malaysia.
*
E-mail: [email protected]
Received: 22 September 2011 / Accepted: 20 May 2012 / Published: 1 June 2012
Silica nanoparticles were synthesized by sol-gel method from tetraethoxysilane (TEOS), ethanol (C2H5OH), water and ammonium hydroxide (NH4OH) as catalyst. The morphology and structure of
colloidal silica particles formed depend on the molar ratio of reagents. The XRD patterns show the amorphous nature of the particles. FTIR spectra confirm the presence of functional group in the bulk and at the surface of the silica particles. TEM image show that the silica particles are in nanometer scale for higher molar ratio of ethanol. Complex impedance spectroscopy study show the presence of both bulk and grain boundary effects in the material, as well as the presence of temperature dependent electrical relaxation phenomena in the method.
Keywords: Silica nanoparticles; sol-gel method; amorphous; complex impedance
1. INTRODUCTION
Silica nanoparticles are widely used in industrials such as electronic devices, insulator, catalysis or pharmaceuticals [1, 2] due to their attractive properties in optical properties. These intensive properties can be attractive to surface defect related to large surface/volume ratio [3 - 5]. The silica particles play a different role in each of these products. The quality of some of these products is highly dependent on the size and size distribution of the silica particles.
The most popular process of obtaining silica nanoparticles is through sol-gel technique [6-10]. It involves the simultaneous hydrolysis and condensation reaction of the metal alkoxide. In general, sol-gel process is very sensitive towards the experimental conditions that affect the rate of hydrolysis and condensation reactions.
desired particles size and morphology of silica particles are produced through controlling parameters such as concentration of alkoxide, amount of water and concentration of ammonia or acid and solvent and aging time.
Most of the recent works on silica nanoparticles focus on the synthesis routes, particles morphology and optical properties [12-14]. In this paper, we have synthesized silica nanoparticles via sol-gel process. The change in impedance spectra of nanosilica at different temperature and frequency are highlighted.
2. EXPERIMENTAL
2.1 Reagents
Tetraethylorthosilicate (99.9%, Fluka), absolute ethanol (EtOH 99.5%, Systerm), ammonia (NH3, 25% Merck) and distilled water have been used in this work. The chemicals were employed
without any further purification.
[image:2.596.250.356.350.706.2]2.2 Procedure
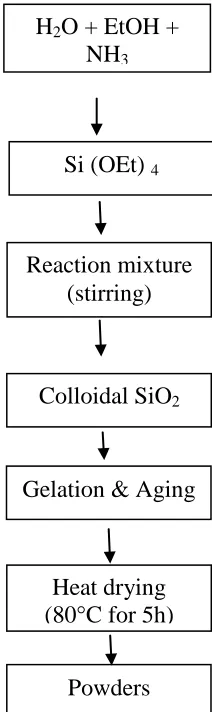
Figure 1. Flow chart for nanosilica preparation H2O + EtOH +
NH3
Si (OEt) 4
Reaction mixture (stirring)
Colloidal SiO2
Gelation & Aging
Heat drying (80°C for 5h)
Silica nanoparticles were synthesized using a standard procedure with experimental conditions provided in Table 1. Water, TEOS, ammonia and ethanol with molar ratio of 1:4:6:6 and 1:4:6:24 were prepared at room temperature under air condition. First, distilled water and ammonia were mixed with each other. Then, ethanol poured into water/ammonia solution. TEOS was mixed into water/ammonia/ethanol solution and the mixture was stirred vigorously by hand for approximately 6s. Drying was carried out using a conventional oven at 80ºC for 5 hours. Depending on different molar ratio of reagents, the condensation reaction began after various times. This could be easily observed because after the invisible hydrolysis reaction forming silicic acid, the condensation of the supersaturated silicic acid was indicated by an increasing opalescence of the mixture starting 2-10 min after adding the TEOS. After this transformation, a turbid white suspension formed after a few more minutes. The flow chart of the sample preparation is given in Fig. 1.
Table 1. Optimized molar ratios for the preparation of silica nanoparticles
2.3 Characterizations
hase of the samples were studied y using -ray diffraction D D 500 -ray diffractometer e uipped with graphite monochromati ed Cu radiation .5 8 ) irradiation with a scanning rate of 0.02 s-1. The morphologies of the samples were examined using L O Li ra® 20 Transmission Electron Microscopy operating at 120kV. Samples for TEM analysis were prepared by dissolved in its respective solvent. Then the samples were submerged in water in ultrasonic bath for sonification for 30 minute duration. A drop of each sample solution was placed on a 300-mesh lacy carbon-coated copper grid, which was allowed to dry for 3 days before being used for analysis. The sample grids were focused at appreciates locations and at specific magnifications to record micrographs in the bright field image made on the photograph plate. The average sizes and distribution of silica nanoparticles were obtained by image analysis of these micrographs, measuring at least 100 particles. The impedance analysis was performed using Electrochemical Impedance Spectroscopy (EIS), Hioki 3531 z Hi Tester with frequency range of 50Hz to 5 MHz at different temperature. A chemically inert and commercially grade graphite paste was used as the electrode. It was applied on opposite parallel surfaces of the sample pellet to block the ion movement on the other side of the sample configuration. The powdered samples were compressed at pressure of 4 tons in a stainless steel dye using a hydraulic hand press. The pellet obtained had a diameter of 2.3 cm and thickness of 0.3 cm. the density of the pellet is 1.0029 g/cm3. FTIR analysis was carried out using Perkin-Elmer 400 FTIR in the wavenumber region between 4000 and 400 cm-1. The impedance measurement was carried out in the air environment.
Sample Molar ratio
H2O TEOS NH4OH C2H5OH
1 1 4 6 6
3. RESULTS AND DISCUSSION
3.1 Structural studies
3.1.2 X-ray diffraction studies
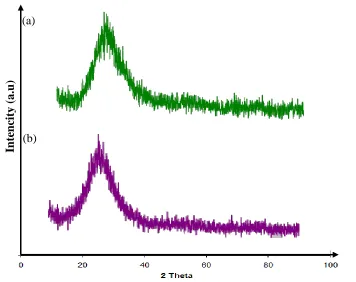
Fig. 2 shows the XRD pattern of gel silica at different molar ratio of NH3/EtOH. The XRD
patterns show a typical broad halo, clearly assigned to amorphous silica. The broad XRD reflection peaks may be due to the small size and incomplete inner structure of the particles. This demonstrates that a high percentage of these particles are amorphous [15].
Figure 2. XRD patterns of the gel silica at different NH3/EtOH ratio: (a) 1.00 and (b) 0.25
3.1.2 Transmission electron microscopy (TEM)
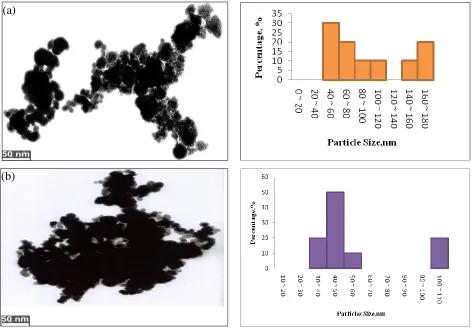
Fig. 3 shows the TEM images of silica particles prepared at different molar ratio of NH3/EtOh.
It is observed that at molar ratio of NH3/EtOh = 1.00, the average particles size is 48.5 nm with narrow
size distribution. The morphology consists of almost spherical particle with low aggregation.
Fig. 3(b) shows the image of silica nanoparticles at molar ratio of NH3/EtOH = 0.25. The
particle size decreases with increasing the molar ratio of ethanol (average size 42 nm). The optimum conditions for synthesizing silica nanoparticles were considered to be with the same molar ratio of TEOS and a higher molar ratio of ethanol gives rise to smaller silica nanoparticles with broad distribution of particle sizes.
(b)
In
te
n
city (
a.u
)
[image:4.596.142.498.240.522.2]
Figure 3. TEM images of silica particles and their particle size distribution produced at different NH3/EtOH ratio: (a) 1.00 and (b) 0.25
The small particles due to the increase in the –OH group concentration lead to the reduction in the rate of hydrolysis and condensation reaction, which consequently inhibit the growth of the larger particles. Therefore, by increasing molar ratio of ethanol, the final particle size and particle size distribution of the powder can be controlled.
3.2 FTIR studies
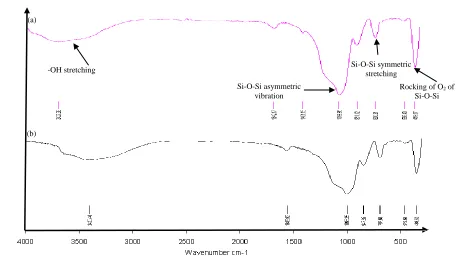
Fig. 4 shows FTIR spectra of the resulting silica nanoparticles at different molar ratios of ethanol. The band at ~469 cm-1 corresponds to Si-O rocking vibration where the oxygen atom moves perpendicular to the Si-O-Si plane [16, 17]. The band around 800 cm-1 corresponds to Si-O [17] bending vibration where the oxygen move at the right angle to the Si-Si lines in the Si-O-Si plane [16, 17]. The absorption around 949 cm-1 corresponds to Si-OH bending vibration. The band around 1098 cm-1 correspond to asymmetric stretching vibration of Si-O-Si band, which the bridging oxygen atom moves parallel to the Si-Si lines in the opposite direction to their Si neighbors . The band around 3424 cm-1 corresponds to Si-OH stretching vibration, hydrogen bonded [17]. The results showed that the peak height for Si-O-Si stretching vibration (~1098 cm-1) increased as the particle size is reduced as shown in Fig. 4(b). FTIR analysis shows that the silica particles are very hygroscopic in nature. The
(a)
[image:5.596.66.539.70.398.2]
FTIR analysis also showed that the band was slightly shifted toward lower wave number as the particle size reduces.
[image:6.596.57.513.149.410.2]
Figure 4. FTIR spectra for silica particles produced at different NH3/EtOH ratio: (a) 1.00 and (b) 0.25
3.3 Complex Impedance analysis
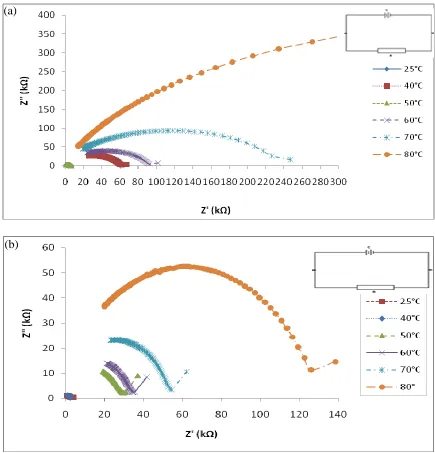
Fig. 5 shows the complex impedance spectra (Nyquist plot) of silica particles produced at different NH3/EtOH ratios for some representatives temperatures. The graph clearly shows that there is
an inclined straight line in the lower frequency range followed by the semicircular arc at higher frequency region as shown in Fig. 5(b) whose pattern of evolution changes with a rise in temperature. All the spectra contain only a single arc and the extent of their intercept on the real axis tells us about the electrical processes occurring within the sample. Table 2 shows the values of bulk resistance and capacitance at varies temperature.
The low values of resistance observed in the spectra are possibly due to humidity effects as confirmed by FTIR studies. It also explains the increase of resistance with temperature. The increase in temperature leads to the increase in the diameter of the semicircular arcs. These semicircles exhibit some depression at lower temperature. That indicates a non-Debye type of relaxation and manifests that there is a distribution of relaxation time instead of a single relaxation time in the material [4]. The presence of a single semicircular arc indicates that the electrical process contribution is from a bulk material (grain interior) which can be modeled by a parallel R-C circuit. The arc’s intercept on the real axis for semicircular gives the value of bulk resistance (Rb) which is increasing with rise in
temperature.
(a)
(b)
Transmittance, %
Rocking of O2 of
Si-O-Si Si-O-Si symmetric
stretching Si-O-Si asymmetric
Figure 5. Complex impedance spectra as a function of temperature at different NH3/EtOH ratio: (a)
1.00 and (b) 0.25
Appearance of spikes at lower temperature can be attributed to the grain boundary effect. As the amount of grain boundary present is higher, it is more difficult for mobile ions to cross over them [18].
(a)
Table 2. Bulk resistant and capacitance values for varies temperature
NH3/EtOH= 1.00 fmax Rb Cb (F)
25 3230 4.7 1.04838 E-05
40 3333.4 6.9 6.91963 E-06 50 27160 66.84 8.76704 E-08
60 39503 92.22 4.36863 E-08
70 93515 226.80 7.50403 E-09
NH3/EtOH= 0.25 fmax Rb Cb (F)
25 1055.6 2.85 4.85336 E-05
40 1263.3 3.12 3.70822 E-05
50 10828 30.73 4.39859 E-07
60 13982 35.54 2.94563 E-07
70 23350 54.05 1.15976 E-07
80 52556 126.06 2.20929 E-08
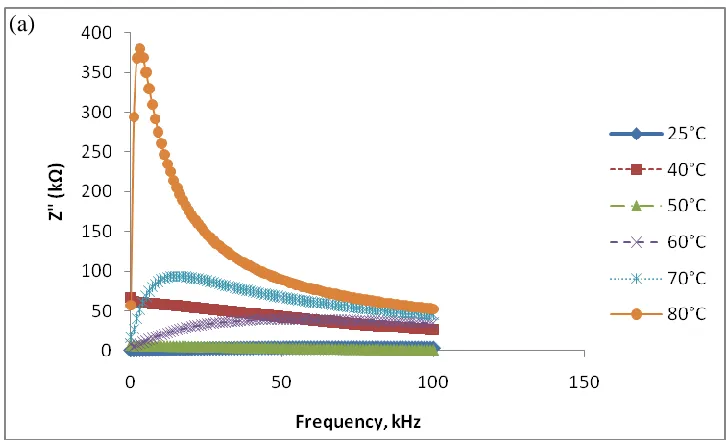
The variation of the imaginary part of impedance (i.e. loss spectrum) at different temperatures is shown in Fig. 6. The loss spectrum is characterized by the appearance of a peak with further broadening of the peak with arise in temperature. A significance broadening of the peaks with an increase in temperature suggests the existence of a temperature-dependent electrical relaxation phenomenon in the material. The relaxation species in the material may be possibly immobile species/electrons at low temperature and defects/vacancies at higher temperature. The position of the peak is found to shift towards the lower frequency side with fall in temperature. Furthermore, the broadening of the peak with increase in temperature shows multiple relaxation-time scale.
Figure 6. Fre uency dependence of Z” at various temperatures for H3/EtOH ratio: (a) 1.00 and (b)
0.25
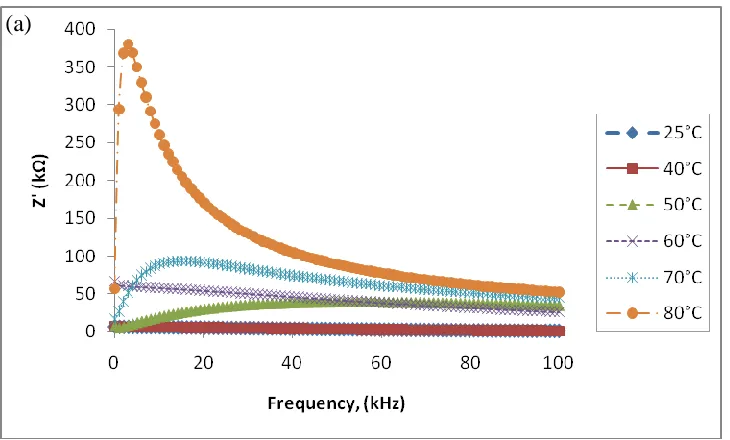
Fig. 7 shows the variation of real part of the impedance with frequency at different temperatures. The impedance value is typically higher at higher temperatures in the low frequency region and decrease gradually with increasing fre uency. The value of Z’ appears to merge in the higher-frequency region irrespective of temperature may be due to the release of space charges [5]. The merge of the value of Z’ for all temperatures at higher fre uencies can e interpreted y the presence of space charge polarization. This interpretation was confirmed by the higher impedance values at lower frequencies.
(b)
[image:9.596.118.483.503.723.2]
Figure 7. Fre uency dependence of Z’ at various temperatures for different H3/ tOH ratio: (a) 1.00 and (b) 0.25
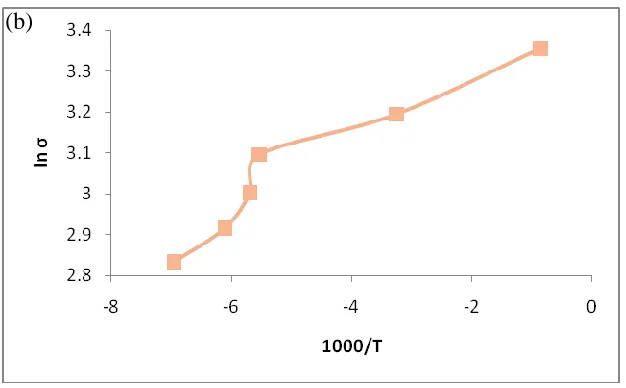
Fig. 8 (a) and (b) shows the plot of conductivity against temperature. From the figure it shows that the conductivity of the nanosilica was decrease at elevated temperature. The activation energy was calculated for both samples as 2.9136 x 10⁻¹⁹ eV. s for sample with of NH3/EtOH ratio 1.00 and 3.3764
x 10-19 eV. s for sample with of NH3/EtOH ratio 0.25 in Table 3.
Table 3. The values of activation energy of NH3/EtOH ratio (a) 1.00 and (b) 0.25 at varies
temperature.
Sample Ea (eV.s)
NH3/EtOH ratio = 1.00 2.9136 x 10⁻¹⁹
NH3/EtOH ratio = 0.25 3.3764 x 10⁻¹⁹
(b)
[image:10.596.123.479.68.288.2] [image:10.596.128.468.495.763.2]
Figure 8. The values of electrical conductivity of different NH3/EtOH ratio: (a) 1.00 and (b) 0.25
4. CONCLUSION
Spherical silica nanoparticles have been synthesized via sol-gel method at different NH3/EtOH
ratio. The morphology with the narrow particle size distribution and the average diameter of colloidal silica particles depend on the propotion of the reactants. TEM image show that the sample with high weight ratio of NH3/EtOH has a smaller particles size ~ 42 nm and highly aggregated. XRD pattern
show the amorphous nature of the materials. Complex impedance analysis indicate that the electrical properties of the material are strongly dependent on temperature and frequency. Analysis of this spectra permits to estimate the grain boundary contribution. It also show the presence of electrical relaxation phenomenon in the sample. The FTIR analysis indicates that the peak height for Si-O-Si stretching vibration (~1098 cm-1) increases as the particle size is reduced. The spectra show that the transmittance band is slightly shifted toward a lower wave number as the particle size reduces. The spectra also show that the silica particles are hygroscopic in nature.
ACKNOWLEDGEMENT
The authors would like to thank Mr. Said Sakat for his assistance and also to the funding from University of Malaya/Mekanik/BM27.
References
1. K.J. Klabunde, Nanoscale Matrials in Chemistry, Wiley-Interscience, USA 2001. 2. Y.T. Chen. Tamkang J. Sci. Eng. 5 (2002) 99.
3. A.Anedda, C.M. Carbonno, F. Clemente, R.Corpiro, P.C. Ricci, Mater. Sci. Eng. C25 (2005) 631-634.
4. R.K. Iller, The chemistry of Silica, Wiley, New York 1979. 5. L.L. Hench, J.K. West, Chem. Rev. 90 (1990) 33.
7. N. Enomoto, T.Koyano, Z.Nakagawa, Ultrason. Sonochem. 3 (1996) 105-109.
8. G. Buchel, M.Gurnn, K.K. Unger, A. Matsumoto, K.Tsutnami, S-pramol. Sci. 5 (1998) 532 559. 9. D. Nagoo, H. Osuzu, A. Yamada, E. Mine, Y. Kobayashi, M. Konno, J. Colloid Interface Sci. 274
(2004) 143-149.
10.S. Tatabaei, A. Shukohfar, R. Aghababazadeh, A. Mirhabibi, J. Phys. Confer. Series 26 (2006) 371-374.
11.R.K. Eller, The Chemistry of Silica, Wiley, New York, 1979.
12.S. Sridhar, D. H. Rasmnssen, F.P. Chen, R.K. Kannabiran, Colloids Surf. A 132 (1998) 45. 13.I.A. Rahman, P. Vejayakumarm, C.S. Sipaut, J. Ismail, M. Abu Bakar, R. Adnan, C.K. Chee,
Ceram. Int. 32 (2006) 691.
14.B.K. Lee, K.Y. Lee, T. Kawai, Anal. Chim. Acta 576 (2006) 177. 15.Shein Y and Lee S-H, Materials Research 11 (1996) 156.
16.E. Moncada, R. Quijada and J. Retuert, Nanotechnology 18 (2007), p. 1. 17.C. Hernandez and A.C. Pierre, Langmuir 16 (2000), p. 530.
18.G.Ardel, D. Golodnitsky, E.Peled, Y.F. Wang, H.Wang, B.Stanley, G.Steren, Solid State Ionics 113 (1998) 477.