Limitations On The Creation of Continuously Surfable Waves
Generated By A Pressure Source Moving In A Circular Path
by
Steven Anthony Schmied
Bachelor of Engineering (Aerospace) (Honours), Master of Business Administration, Master of Engineering (Computing), Chartered Professional Engineer,
Engineering Executive, Fellow of Engineers Australia
Submitted in fulfilment of the requirements for the Degrees of
Doctorate of Philosophy
at
the University of Tasmania (UTAS) Australian Maritime College (AMC)
and
Doctorate of Engineering
at
Limitations On The Creation of Continuously Surfable Waves
Generated By A Pressure Source Moving In A Circular Path
Proefschrift
ter verkrijging van de graad van doctor aan de Technische Universiteit Delft,
op gezag van de Rector Magnificus prof. ir. K.C.A.M. Luyben, voorzitter van het College voor Promoties,
in het openbaar te verdedigen op 29 januari 2014 om 10.00 uur
door
Steven Anthony SCHMIED
Bachelor of Engineering (Aerospace) (Honours), Master of Business Administration, Master of Engineering (Computing), Chartered Professional Engineer,
Engineering Executive, Fellow of Engineers Australia.
Dit proefschrift is goedgekeurd door de promotor:
Prof. dr. ir. R.H.M. Huijsmans.
Samenstelling promotiecommissie:
Rector Magnificus voorzitter
Prof.dr.ir. R.H.M. Huijsmans Technische Universiteit Delft, 3mE, promotor
Prof. M.R. Renilson Universiteit Tasmanië Australische Maritieme College and Technische Hogere Colleges, Verenigde Arabische Emiraten
Prof. dr. ir. M.J.F. Stive Technische Universiteit Delft, CiTG Prof. dr. ir. G.S. Stelling Technische Universiteit Delft, CiTG Prof. dr. ir. H.W.M. Hoeijmakers Universiteit Twente
Dr. J.R. Binns Universiteit Tasmanië Australische Maritieme College Dr. J. Hennig Maritiem Research Instituut Nederland (MARIN) Prof. dr. ir. T.J.C. van Terwisga Technische Universiteit Delft, 3mE, reservelid
Universiteit Tasmanië Australische Maritieme College Associëren Prof. G. Thomas and Dr. G. Macfarlane, heeft als begeleider in belangrijke mate aan de totstandkoming van het proefschrift bijgedragen.
ISBN: 978-1-86295-934-7
Copyright © 2014 by S.A. Schmied. All rights reserved.
Published by the University of Tasmania and Delft University of Technology. Printed by: Gildeprint Drukkerijen - www.gildeprint.nl.
Abstract
Limitations On The Creation of Continuously Surfable Waves
Generated By A Pressure Source Moving In A Circular Path
The aim of the research presented in this work was to investigate the novel idea to produce continuous breaking waves, whereby a pressure source was rotated within an annular wave pool. The concept was that the pressure source generates non-breaking waves that propagate inward to the inner ring of the annulus, where a sloping bathymetry (beach) triggers wave breaking. In order to refine the technique, research was conducted to better understand the mechanics of waves generated by moving pressure sources in a constrained waterway, the transformation of these waves as they travel across the channel and the effect of the sloping beach on the wave quality for surfing.
The quality of the waves was defined in terms of wave height, speed and shape, with the aim to create plunging waves, known as “barrels”, that are highly desired by surfers. Surfers also require a long steep crestline or “wall”, to allow a full range of manoeuvres to be performed. Finally, the pool was required to create waves suitable for surfers from beginner to expert level.
The major finding was that the design parameters were generally in competition, and to determine a balance of limiting values, the parameters could not be considered in isolation. Therefore, a set of empirical relationships between the design parameters were developed to allow the pool to be designed for a combination of desired wave height and shape in a given pool radius.
and no beach), the predicted wave heights and shape generally did not correlate well with initial experimental results.
Thus, a predominantly experimental approach was undertaken. A method of qualitative scoring wave shape from a surfer’s perspective was developed and proved valuable for focusing the research effort. At the end of the test series, high quality continuous breaking waves with the desired plunging shape were able to be generated, with these waves being desirable for surfing. However, it was determined that only a very small range of design parameter values produced the desired high, plunging waves in the very constrained waterway under consideration, and the wave quality was shown to be extremely sensitive to changes in the design parameters.
Steven Schmied
Samenvatting
Beperkingen op het creëren van voortdurende surfbare golven
voortgebracht door een bewegende kracht bron in een
cirkelvormige baan.
Het doel van dit onderzoek was, om uit te vinden of het mogelijk zou zijn om continu brekende golven te produceren door middel van een draaiende kracht bron in een ringvormig golfslagbad. Het begrip was gebasseerd op een kracht bron, die niet-brekende golven inwendig verspreid in de binnenste ring van het grensgebied van twee concentrische cirkels waarbij een schuinstaande zee bodem een golfbreking veroorzaakt. Om deze techniek te verfijnen, werd er onderzoek uitgevoerd om een beter inzicht te verkrijgen in het gedrag van golven als we bewegende kracht bronnen in een beperkte waterweg produceren, als ook de verandering van deze golven als ze zich voortbewegen over het kanaal en het effect van de schuine zee bodem op de golf kwaliteit die nodig is om te surfen.
De kwaliteit van de golven wordt gedefinieerd door golfhoogte, snelheid en vorm met het gewenste doel stort golven te maken die zeer gewenst zijn voor surfers. Surfers vereisen ook een lange steile golf koppen, zodat ze een volledig assortiment van kunstgrepen kunnen worden uitgevoerd. Ten slotte is het zeer belangrijk, om een golfslagbad te creeren dat geschikt is voor zowel beginnende als bedreven surfers.
De belangrijkste bevinding was, dat de ontwerp parameters niet samenwerkten en om een evenwicht te verkrijgen van de grenswaarden was het onmogelijk om deze op zich zelf konden staan. Daardoor werd er een reeks experimentele relaties ontwikkeld tussen de ontwerp parameters om een zwembad te ontwerpen in combinatie met de gewenste golfhoogte en vorm in een gegeven zwembad radius.
van lineaire en niet-lineaire potentiaal stroming numerieke analystische instrumenten ongeldig in het golfslagbad design. Zelfs het overwegen van vereenvoudigde configuraties (zoals een lineair spoor, geen blokkade en geen strand) de voorspelde golfhoogte en vorm was niet in verhouding met de eerste experimentele resultaten. Als gevolg hiervan werd een overwegend experimentele benadering uitgevoerd. Een methode van kwalitatief behaalde golf vormen vanuit het perspectief van een surfer werd hierdoor ontwikkeld en bewees waardevol genoeg om het onderzoek hierop te concentreren. Aan het einde van de test series, hoge kwaliteit voortdurend brekende golven met de gewenste vorm konden worden voortgtebracht die wenselijk zijn om te surfen. Echter werd er vastgesteld dat slechts een zeer klein bereik van ontwerp parameters de gewenste hoge, diepe golven in een beperkte waterweg in overweging kan worden genomen en de golf kwaliteit bleek uiterst gevoelig voor veranderingen in de ontwerp parameters.
Steven Schmied
Acknowledgements
This thesis would not have been possible without the kind patience over the many years shown by my supervisors Dr. Jonathan Binns, Prof. Martin Renilson, Prof. Dr. Ir. Rene Huijsmans, Associate Prof. Giles Thomas, and Dr. Gregor Macfarlane.
I take this opportunity to thank Greg Webber, whose idea of making a continuously breaking surfing wave pool sent us all on this journey of discovery. I also thank all the team at Liquid Time Pty Ltd (Webber Wave Pools) for their support and encouragement, and especially my friend Richard Pierce who designed the scale model drive system. I especially thank my family and friends for patiently listening to my stories of wave pools and surfing.
Hearty thanks to the many students at the UTAS AMC, TU Delft and the University of Sydney who have contributed and participated in the research, and that I had the privilege of supervising on behalf of Liquid Time Pty Ltd: Mohammadreza Javanmardi, Sanne van Essen, Matthieu de Schipper, Sierd de Vries, Nathan Doyle, James Erbacher, Andrew Hartley, Marcus Vanderharst and Scott Van Munster. I would like to thank the other international exchange staff and interns who assisted with the test sessions: Dr. Pepijn de Jong (TU Delft), Teo Kohonen, and Arnaud Duquesnel.
Further, I thank all the staff at UTAS AMC and TU Delft, who have been so welcoming and supportive, especially the technical support staff: Kirk Meyer, Liam Honeychurch, Mike Underhill and Peter Tomic.
I would like to thank the Australian Research Council (ARC) for awarding a Linkage Project grant to the joint Liquid Time Pty Ltd, UTAS AMC and TU Delft team. This grant included an APAI scholarship that we were proud to award to Mohammadreza.
Contents
Chapter 1 Introduction 1
1.1 Motivation 1
1.2 Previous and related work 7
1.3 Author’s contribution 9
1.4 Outline of thesis 12
Chapter 2 Surfing waves and wave pool design parameters 13
2.1 Chapter introduction 13
2.2 Surfing waves 13
2.3 Ship waves 30
2.4 Wave pool design parameters 36
2.5 Discussion 58
Chapter 3 Experimental approach 59
3.1 Chapter introduction 59
3.2 Aims 59
3.3 Facilities 59
3.4 Pressure source models 62
3.5 Error analysis 65
3.6 Analysed results 67
Chapter 4 Pressure sources and wave generation 71
4.1 Chapter introduction 71
4.2 Pressure source shape 73
4.3 Near-field region 73
4.4 Blockage and Depth Froude Number 75
4.5 Entry angle and waterline length 81
4.6 Beam 89
4.7 Draught 91
4.8 Pressure source symmetry 93
4.9 Linear and circular tracks 97
4.11 Discussion 104
Chapter 5 Bathymetry and wave breaking 105
5.1 Chapter introduction 105
5.2 Pool radius 106
5.3 Lateral distance to the start of the beach 113
5.4 Beach slope 117
5.5 Water depth at the start of the beach and the outer wall 122
5.6 Wave dissipation 123
5.7 Currents 124
5.8 Discussion 133
Chapter 6 Summary, concluding remarks and further work 135
6.1 Summary 135
6.2 Concluding remarks 135
List of Figures
Figure 1-1. An example of overcrowding at popular surf breaks causing tension and reducing surfer enjoyment (http://swellnet.com.au). Snapper Rocks is a very popular surf break in Queensland Australia that provides extremely long, high quality, plunging waves. This online comment also highlights that the minority of better surfers ride the majority of naturally occurring waves. ... 2 Figure 1-2. Traditional wave pool (http://wn.com/Siam_Park_Tenerife) (top) and Flowriders (www.waveloch.com) (bottom). ... 3 Figure 1-3: Cross-section (top) and plan view (bottom) of circular path in the proposed wave pool design by Webber Wave Pools (reproduced with permission of Liquid Time Pty Ltd). The pressure sources are travelling anticlockwise, generating right-handed waves. ... 5 Figure 1-4: Wave pool concept (reproduced with permission of Liquid Time Pty Ltd). ... 6 Figure 1-5. Artist’s impression of the wave pool for a water park complex (reproduced with permission of Liquid Time Pty Ltd). The pressure sources are travelling anticlockwise, generating left-handed waves ... 6 Figure 2-1. An artist’s impression of a fantasy surfing location (source unknown). ... 14 Figure 2-2. Wavelength and height. The waves are travelling from right to left. ... 16 Figure 2-3. Wave life-cycle illustrated in the circular scale model; condition 45 model 11-12 at Frh0 = 0.975 with B = 275mm, d* = 0.2 and h0 = 250mm. The model was travelling towards
the camera. ... 16 Figure 2-4. Circular track bathymetry parameters. ... 17 Figure 2-5. Spilling wave generated by condition 48 run 402 model 12-02 with ξ = 0.4, d* = 0.2 in h0 = 250mm at Frh0 = 0.95 and s = 9O and ybeach* = 1.4. The pressure source was
Figure 2-7. Collapsing breakers (first and second waves) generated by condition 52 model
12-02 with ξ = 2.3,d* = 0.2 in h0 = 250mm at Frh0 = 0.95, s = 23O and ybeach* = 1.9. ... 20
Figure 2-8. Surging waves generated by condition 50 model 12-02 with ξ = 3.3, d* = 0.2 in h0 = 250mm at Frh0 = 0.9, s = 23O and ybeach* = 1.4. ... 21
Figure 2-9. Surfer riding plunging “barrelling” wave of Hbeach ≈ 2m. ... 21
Figure 2-10. A high quality wave shape. The elements of the wave as described by Mead et. al. [34] are shown. ... 22
Figure 2-11. Surfing speed components. ... 24
Figure 2-12. “Close-out” wave with θpeel =0O. ... 25
Figure 2-13. “Slow” wave with θpeel=90O. ... 25
Figure 2-14. Lorne point with breaking waves (both elevation and plan view). The crest lines are indicated by the red lines, with the wave direction of travel perpendicular to the crest line (blue arrow). The black arrow indicates the surfer’s and the breakpoint path, moving parallel to the shoreline at the “board speed” (csurfer). (Images captured from www.swellnet.com.au and GoogleMaps). ... 26
Figure 2-15. Surfer skill as a function of the peel angle (θpeel) and wave height (Hbeach) (reproduced from Hutt et al. [38]). ... 27
Figure 2-16. Dally [57] and Hutt et. al. [38] observed mean wave speed (cp) for surfing. ... 28
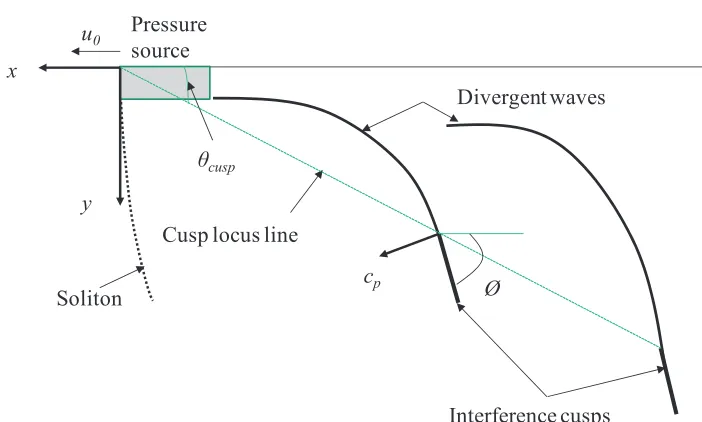
Figure 2-17. Deep water wave field. Locus cusps of the diverging and transverse waves lie on the Locus cusp line which encloses an angle θcusp = 19O with the sailing line. The angle between the sailing line and the propagation of the divergent (“featherlet”) waves (ø) ≈ 55 O. u0 is the pressure source velocity and cp was wave phase speed. ... 31
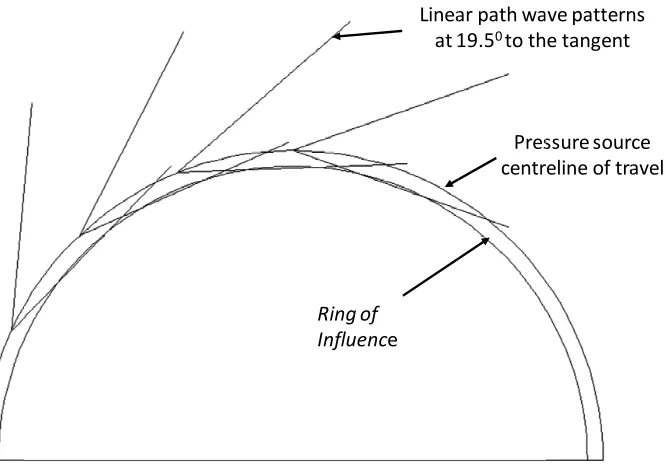
Figure 2-19. Bhattacharya’s approach to the problem of curved path wave patterns, showing the empirical Ring of Influence [62] traced by the inner half of the normal linear Kelvin wave
pattern. (Reproduced as presented in Doyle [43]). ... 34
Figure 2-20: Soding’s numerical prediction of a curved path wave pattern [14]. Photograph taken from Stoker [61] supporting Soding’s work. (Reproduced as presented in Doyle [43]).34 Figure 2-21. Trials using a fishing vessel on a river to generate surfable waves (reproduced with permission of Liquid Time Pty Ltd). ... 35
Figure 2-22: Pressure source parameters for a linear track. ... 37
Figure 2-23: Circular track pressure source parameters. ... 38
Figure 2-24: Circular track wavedozer pressure source parameters. ... 38
Figure 2-25: Bathymetry parameters for the linear track. ... 41
Figure 2-26. Pressure source and wave velocity components. The x-axis was parallel with the pressure source centre-line of travel and the y axis was perpendicular (radial) with the pressure source centre-line of travel. ... 45
Figure 2-27. Near field and preferred surfing regions. ... 50
Figure 2-28. The wave steepness, H/λ, increases as a function of the water depth to a point where the wave breaks [63]. ... 51
Figure 2-29. Pressure source to wave relationship at Frl = 0.56. ... 53
Figure 2-30. Wavelength components and featherlet angle (øbeach). ... 55
Figure 3-1: Linear track tow tank channel cross-section. ... 60
Figure 3-2. Linear track tow tank setup. The wave probe array is shown. ... 61
Figure 3-3. Circular track scale model installed in the UTAS AMC Model Test Basin. ... 62
Figure 3-5: Linear track scale model 09-35 wavedozer with 1500mm length, 300mm beam and α = 14O. ... 63 Figure 3-6: Circular track series 3 model 12-02 wavedozer with 1200mm length, 275mm beam and α = 7O. ... 64 Figure 3-7: Example of time trace of u0for condition 6 model 2 with d* = 0.2 in h0 = 250mm
at Frh0= 0.975 with a ramp rate of 5% per second. The passing of arm number 1 recorded by
the laser is shown. ... 66 Figure 3-8. Example of barely surfable quality waves for condition 48 model 12-02 with d* = 0.2 in h0 = 250mm at Frh0 = 0.95, κ = 0.07, s = 17O, and ybeach* = 1.4. The pressure source
was travelling towards the camera. ... 68 Figure 3-9. Example of fair quality waves for condition 57 model 12-02 with d* = 0.2 in h0 =
250mm at Frh0 = 0.95, κ = 0.06, s = 17O, and ybeach* = 1.9. ... 68
Figure 3-10. Example of an average quality wave for condition 48 model 12-02 with d* = 0.2 in h0 = 250mm at Frh0 = 0.95, κ = 0.07, s = 17O and ybeach* = 1.4. ... 69
Figure 3-11. Example of a good quality wave for condition 55 model 12-02 with d* = 0.2 in h0 = 250mm at Frh0 = 0.95, κ = 0.07, s = 17O and ybeach* = 1.4. ... 69
Figure 3-12. Example of excellent quality waves for condition 45 model 11-12 with d* = 0.2 in h0 = 250mm at Frh0 = 0.975, κ = 0.06, s = 17O and ybeach* = 1.9. ... 70
Figure 4-1. YNF* = 2 for condition 56 model 12-02 with d* = 0.2 in h0 = 250mm at Frh0 =
0.95. ... 74 Figure 4-2. YNF* as a function of Frh0for condition 62 model 12-02 with d* = 0.2 in h0 =
250mm and κ ≈ 0. ... 74 Figure 4-3. κ as a function of Frh (Lyakhovitsky [23]). ... 76
Figure 4-5. H* as a function of y* for different values of κ for model 12-02 with d* = 0.2 in h0 = 250mm at Frh0 = 0.95; condition 62 κ ≈ 0 and condition 56 κ = 0.07 and ybeach*.= 1.9. .. 78
Figure 4-6. Determining whether the test point was “sub-critical” or “critical” for condition 56 model 12-02 at Frh0 = 0.95 with κ = 0.07 and d* = 0.2 in h0 = 250mm. ... 78
Figure 4-7. H* as a function of Frh0 at y* = 0.9 for model 12-02 with d* = 0.2 in h0 = 250mm
with different κ and ybeach*. ... 79
Figure 4-8. Time traces of ζ* at y* = 0.9 (WP1) for model 12-02 with condition 62 κ ≈ 0 and condition 56 s = 17O and κ = 0.07 at Frh0 = 0.95 with d* = 0.2 in h0 = 250mm. Model 11-12
was time shifted to align with model 12-02. The pressure source bow passed the wave probe at time = 24.5 seconds. ... 80 Figure 4-9. H* as a function of Frh0at y = 375mm (WP1)with different values of α for model
11-10 B = 75mm (left) with d* = 0.2 in h0 = 250mm and κ ≈ 0. ... 82
Figure 4-10. H* as a function of Frh0 at y = 375mm (WP1) with different values of α for
model 11-12 B = 275mm (right) with d* = 0.2 in h0 = 250mm at Frh0 = 0.99 and κ ≈ 0. ... 83
Figure 4-11. H* as a function of α at y = 375mm (WP1)for models 11-10 B = 75mm and model 11-12 B = 275mm with d* = 0.2 in h0 = 250mm at Frh0 = 0.99 and κ ≈ 0. ... 84
Figure 4-12. H* as a function of Frlat y = 375mm (WP1)with different values of α for model
11-10 B = 75mm with d* = 0.2 in h0 = 250mm and κ ≈ 0. ... 85
Figure 4-13. H* as a function of Frlat y = 375mm (WP1)with different values of α for model
11-12 B = 275mm with d* = 0.2 in h0 = 250mm at Frh0 = 0.99 and κ ≈ 0. ... 86
Figure 4-14. Time traces of ζ for model 11-12 B = 275mm at y = 375mm (WP1) with different values of α with d* = 0.2 in h0 = 250mm at Frh0 = 0.99 and κ ≈ 0. For comparison α = 4O and
7O were time shifted to align with α = 14O. ... 87 Figure 4-15. Wave quality for model 11-12 B = 275mm with d* = 0.2 in h0 = 250mm and κ ≈
0 at Frh0 = 0.99 at with α = 14O rear view at water level. The arrow indicates local wave
Figure 4-16. Waves generated by model 11-12 B = 275mm with d = 50mm in h0 = 250mm
and κ ≈ 0 at Frh = 0.99 with α of 14O (top), 7O (middle) and 4O (bottom). Note for α = 4o, the
bow was slightly submerged. ... 88 Figure 4-17. H* as a function of B* (models 11-10, 11-11 and 11-12) at y* = 0.9 at different values of Frh0 with d* = 0.2 in h0 = 250mm and κ ≈ 0. ... 90
Figure 4-18. H* as a function of d* at y = 375mm (WP1) for conditions 59 and 60 model 12-02 α = 7o in h0 = 250mm at Frh0 = 0.975 and ybeach = 950mm. ... 92
Figure 4-19. H* as a function of Frl at y = 375mm (WP1) for conditions 59 and 60 model
12-02 in h0 = 250mm at Frh0 = 0.975 and ybeach = 950mm. ... 92
Figure 4-20. “Rooster tail” generated by condition 46 model 09-35 dry transom with α = 14O with d* = 0.07 in h0 = 1500mm at Frh0 = 0.95 (u0 = 3.6m/s). ... 93
Figure 4-21. H* as a function of Frh0 at y = 375mm (WP1) for model 10-25 asymmetrical and
model 10-27 symmetrical with d* = 0.2 in h0 = 250mm and κ ≈ 0. ... 95
Figure 4-22. H* as a function of Frl at y = 375mm (WP1) for model 10-25 asymmetrical and
model 10-27 symmetrical with d* = 0.2 in h0 = 250mm and κ ≈ 0. ... 96
Figure 4-23. Time traces of ζ at Frh0 = 0.95 at y = 375mm (WP1) for model 10-25
asymmetrical and model 10-27 symmetrical with d* = 0.2 in h0 = 250mm and κ ≈ 0. For
comparison, model 10-27 was time shifted to align with model 10-25. ... 97 Figure 4-24. H* as a function of Frh0 at y* = 5.2 and κ = 0.01 for linear track model 09-35
R0* → ∞ with d* = 0.2 in h0 = 500mm and compared to circular track model 11-10 R0* = 25
with d* = 0.2 in h0 = 250mm and model 11-13 R0* = 12 with d* = 0.2 in h0 = 500mm. ... 98
Figure 4-25. Time trace of the surface elevation ζ* at y* = 5.2 and Frh0 = 0.9 with κ = 0.01
and α = 14o for linear track model 09-35 R0* → ∞ with d* = 0.2 in h0 = 500mm and compared
to circular track model 11-10 R0* = 25 with d* = 0.2 in h0 = 250mm and model 11-13 R0* =
12 with d* = 0.2 in h0 = 500mm. Model 09-35 and model 11-13 were time shifted and Froude
Figure 4-26. Minimum and maximum surface elevation ζ* and wave height H* at y* = 5.2 and Frh0 = 0.9 with κ = 0.01 for linear track model 09-35 R0* → ∞ with d* = 0.2 in h0 =
500mm compared to circular track model 11-10 R0* = 25 with d* = 0.2 in h0 = 250mm and
model 11-13 R0* = 12 with d* = 0.2 in h0 = 500mm. ... 100
Figure 4-27. Time trace of ζwp1at y* = 0.9 (WP1) for condition 56 model 12-02 with d* = 0.2
in h0 = 250mm and κ = 0.06 at Frh0=0.95. ... 102
Figure 4-28. Time traces of ζwp1at y* = 0.9 (WP1) for d* = 0.2 in h0 = 250mm and κ ≈ 0 at
Frh0=0.95 for condition 6 model 10-25 (left), condition 14 models 10-25 and 10-27 (centre),
and condition 15 models 10-24, 10-25, 10-26 and 10-27. ... 103 Figure 5-1. H* as a function of Frh0 at ybeach* = 1.9 with κ = 0.07 for condition 56 model
12-02 R0* = 12 with d* = 0.2 in h0 = 250mm and condition 63 model 12-03 R0* = 6 with d* =
0.2 in h0 = 500mm. ... 107
Figure 5-2. H* as a function of y* for Frh0 = 0.95, κ = 0.07 and ybeach* = 1.9 for condition 56
model 12-02 R0* = 12 with d* = 0.2 in h0 = 250mm and condition 63 model 12-03 R0* = 6
with d* = 0.2 in h0 = 500mm. ... 108
Figure 5-3. Time trace of the surface elevation ζbeach* at ybeach* = 1.9 for Frh0 = 0.95 and κ =
0.07 for condition 56 model 12-02 R0* = 12 with d* = 0.2 in h0 = 250mm and condition 63
model 12-03 R0* = 6 with d* = 0.2 in h0 = 500mm. Model 12-02 was time shifted and Froude
scaled to align with Model 12-03. ... 109 Figure 5-4. Minimum and maximum surface elevation ζbeach* and wave height Hbeach* at
ybeach* = 1.9 for Frh0 = 0.95 and κ = 0.07 for condition 56 model 12-02 R0* = 12 with d* =
0.2 in h0 = 250mm and condition 63 model 12-03 R0* = 6 with d* = 0.2 in h0 = 500mm. .. 110
Figure 5-5. First wave score as a function of Frh0 for condition 56 model 12-02 R0* = 6
compared to condition 56 model 12-03 R0* = 12. ... 111
Figure 5-6. Second wave score as a function of Frh0 for condition 56 model 12-02 R0* = 6
Figure 5-7. Plunging waves generated by condition 56 model 12-02 R0* = 12 and κ = 0.07
with d* = 0.2 in h0 = 250mm water depth, ybeach* = 1.9 at Frh0 = 0.95. ... 112
Figure 5-8. Spilling waves generated by condition 63 model 12-03 R0* = 6 and κ = 0.07 with
d* = 0.2 in h0 = 500mm water depth, ybeach* = 1.9 at Frh0 = 0.95. ... 112
Figure 5-9. H* as a function of y* for different values of ybeach* for model 12-02 with d* =
0.2 in h0 = 250mm at Frh0 = 0.95. Hbeach* for each condition is circled. ... 114
Figure 5-10. First wave scores as a function of Frh0 for different values of ybeach* for model
12-02 with d* = 0.2 in h0 = 250mm. ... 115
Figure 5-11. Second wave scores as a function of Frh0 for different values of ybeach* for model
12-02 with d* = 0.2in h0 = 250mm. ... 116
Figure 5-12. H* as a function of y* at for different values of s for model 12-02 with d* = 0.2 in h0 = 250mm. ... 118
Figure 5-13. First wave scores as a function of Frh0 for different values of s for model 12-02
with d* = 0.2 and ybeach* =2.4. ... 119
Figure 5-14. Second wave scores as a function of Frh0 for different values of s for model
12-02 with d* = 0.2 and ybeach* = 2.4. ... 120
Figure 5-15. Time traces of ζ* at y* = 0.9 showing the solitons and / or surge generated by model 12-02with d* = 0.2 in h0 = 250mm at Frh0 = 0.95 for condition 49 s = 9O, condition 56
s = 17O, and condition 52 s = 23O. Conditions 52 and 56 were time shifted to align with Condition 49. ... 121 Figure 5-16. Rapid wave dissipation post breaking for condition 49 model 12-02 with d* = 0.2 in h0 = 250mm and ybeach*=0.15 at Frh0 = 0.95. ... 123
Figure 5-17. H* as a function of y* for condition 49 model 12-02 with d* = 0.2 in h0 =
250mm and ybeach* =1.9at Frh0 = 0.95. ... 124
Figure 5-18. uc* as a function of Frh0measured by the ADV at y* = 0.9 and Z* = 0.28 for
Figure 5-19. uc* as a function of y* measured by the ADV for different Z* for condition 59
model 12-02 with d* = 0.2 and ybeach* = 2.4 in h0 = 250mm at Frh0 = 0.975 and κ = 0.05. .. 128
Figure 5-20. uc* on the surface observed with the surface floats as a function of y* for
condition 6 model 10-25 at Frh0 =0.975, ybeach* = 1.4 and κ = 0.07. ... 129
Figure 5-21. uc* as a function of κ measured by the ADV at y* = 0.9 and Z* = 0.28 for
conditions 48 to 60 model 12-02 with d* = 0.2 in h0 = 250mm at Frh0 = 0.95. ... 131
Figure 5-22. uc* as a function of d* measured by the ADV at y* = 0.9 and Z* = 0.28 for
List of Tables
Nomenclature
Greek symbols
α Pressure source entry angle [deg]
θpeel Peel angle [deg ]
θcusp Inference cusps line angle [deg ]
ζ Surface elevation [m]
ζ* Non-dimensionalised surface elevation
√
ζbeach Surface elevation measured at the start of the beach (ybeach) [m]
ζbeach* Non-dimensionalised surface elevation √
ζmax Maximum surface elevation of the wave crest [m]
ζmin Minimum surface elevation of the wave trough [m]
ζmax* Non-dimensionalised maximum surface elevation
√
ζmin* Non-dimensionalised minimum surface elevation √
γ Breaking water depth constant
H
κ Blockage A
Volume displacement [m3]
ξ Inshore Iribarren Number
H ø
λ Wavelength [m]
λ0 Wavelength at the pool outer wall (R0) [m]
λbeach Wavelength parallel to beach slope at the start of the beach [m]
λs Wavelength perpendicular to the beach slope [m]
ø Interference cusp angle [deg]
ø0 Interference cusp angle at the pool outer wall [deg]
øbeach Interference cusp angle at the start of the beach [deg]
ω Angular velocity [rad/s]
Latin symbols
Ac Channel cross-section area [m2]
As Pressure source cross-section area [m2]
B Pressure source beam [m]
B* Non-dimensionalised pressure source beam !
√
c Wave speed (celerity) [m/s]
cg Wave group speed [m/s]
cp Wave phase speed [m/s]
csurfer Surfer’s speed [m/s]
d Pressure source draught [m]
d* Normalised pressure source draught "
#$
Frl Length Froude number &'.)*)%
Frh Depth Froude number &'.#%
Frh0 Depth Froude number at the pool outer wall &'.#%$
$
g Acceleration due to gravity [m/s2]
H Wave height [m]
H* Non-dimensionalisedwave height +
√
H0 Wave height at the pool outer wall [m]
Hbeach* Non-dimensionalised breaking wave height at the start of the beach +,-./0
√
Hbreak Wave height at the breakpoint [m]
Hy Wave height at the lateral distance from pressure source centreline of travel [m]
h Water depth [m]
h0 Water depth at the pool outer wall [m]
hbeach Water depth at the start of the beach [m]
hbeach* Normalised water depth at the start of the beach #,-./0#
$
hbreak Water depth at the breakpoint [m]
hy Water depth at lateral distance (y) [m]
k Wave number [rad/m]
LWL Pressure source waterline length [m]
n Coefficient of lateral wave decay [ - ]
R Radius [m]
R0 Radius of the pool outer wall [m]
Rbeach Radius of the start of the beach [m]
Rbeach* Normalised radius at the start of the beach 1)*),-./0
R0* Non-dimensionalised radius of the pool outer wall )*)1$
Ry Radius of lateral distance (y) [m]
s Beach slope [deg]
T Wave period [s]
u, v, w velocity vector components [m/s]
u0 Pressure source velocity at the pool outer wall [m/s]
u0’ Effectivepressure source velocity at the pool outer wall [m/s]
ubeach Wave velocity at the start of the beach [m/s]
uc* Normalised current velocity %%/
$
uy Wave velocity at the lateral distance from pressure source centreline of travel [m/s]
vpeel Wave peel velocity [m/s]
x, y, z Wave field coordinates [m]
Y Channel width [m]
Ybeach Beach width [m]
Ybeach* Normalised beach width 2,-./0)*)
YNF Near field effect width [m]
YNF* Non-dimensionalised near field effect width 2!34
Ywall Surfable wall width [m]
Ywall* Non-dimensionalised surfable wall width +25.66
,-./0
y Lateral distance from pressure source centreline of travel [m]
y* Normalised lateral distance from the pool outer wall 7
)*)
ybeach Lateral distance to the start of the beach from the pool outer wall [m]
ybeach* Normalised lateral distance to the start of the beach from the pool outer wall 7)*),-./0
Z Distance above bottom of channel [m]
Z* Normalised distance above bottom of channel #8
$
Subscripts
0 Pool outer wall
beach Start of the beach location break Wave breaking location
NF Near field
t Tangential tothe pressure source centreline of travel wall Surfable crest width (wall)
y Lateral distance from the pressure source centreline of travel
Subscripts
* Normalised / non-dimensionalised
Abbreviations
AMC Australian Maritime College ARC Australian Research Council
Eq. Equation
TU Delft Delft University of Technology UTAS University of Tasmania
Chapter 1 Introduction
1.1
Motivation
Surfing is fun. However, it is also extremely difficult to learn and master. This difficulty is not helped by ever changing nature and generally short duration of the breaking waves; with the waves changing both day to day with the weather, tide, and as the wave breaks on the shore. It has been observed the average ride time per wave is less than 7 seconds, resulting in surfers generally limited to riding waves for less than 8% of their time spent in the water [1]. Therefore, the dream of every surfer is for consistent, long lasting, high quality waves. This search concentrates surfers on to those areas of coastline that are exposed to regular surf, and with a bathymetry suitable to cause the wave to break in a consistent manner and provide a long ride.
Figure 1-1. An example of overcrowding at popular surf breaks causing tension and reducing surfer enjoyment(http://swellnet.com.au). Snapper Rocks is a very popular surf break in Queensland Australia that provides extremely long, high quality, plunging waves. This online comment also
highlights that the minority of better surfers ride the majority of naturally occurring waves.
1.1.1
Current status of wave pools
Wave pools are not a new concept. In 1934, the Wembley Swimming Pool in London was the first to thrill its visitors with small artificial waves. In 1966, the first indoor surfers rode waist-high waves in the Summerland wave pool in Tokyo, Japan [3]. Since then, more surf pools have been built around the world, receiving mixed reviews from surfers. The original linear wave pools, where the waves are generated at one end and travel to a beach at the other end, try to mimic naturally occurring waves with piston-driven paddles or similar mechanical devices. Such man-made waves are not very appealing to surfers as the rides are short, and the waves generally weak and poorly shaped; Figure 1-2.
object though the existing intensive. waves movement. Key deficiencies wave motion generate financial
Figure
though shallow existing techniques intensive. Instead,
by the pressure movement.
deficiencies with motion of a generate the waves financial viability of
Figure 1-2. Traditional
shallow water along techniques generate
the novel pressure source
with these approaches moving wave waves and a limitation
of the pool.
Traditional wave
along a linear generate the waves
method discussed source imparting
approaches invo wave breaking limitation of a single
wave pool (http://wn.com/Siam_Park_Tenerife (www.waveloch.com
linear track creating waves by moving
discussed in this imparting wave energy
involve both breaking on a shoreline,
single rider
http://wn.com/Siam_Park_Tenerife www.waveloch.com)
creating waves moving large volu
this thesis more energy into
both the lack of shoreline, the being able to
http://wn.com/Siam_Park_Tenerife ) (bottom).
waves in front of volumes of water,
more efficiently into water with
of an authentic, the large power
to surf at one
http://wn.com/Siam_Park_Tenerife) (top)
of the object water, they are efficiently generates
with minimal
authentic, scalable power requirements
one time, limiting
(top) and Flowrider object [6]. As
are power generates the minimal water
scalable surfing requirements to limiting the
[image:31.539.105.435.280.535.2]1.1.2
Webber Wave Pool concept
In order to find the solution to these problems with current wave pool technology, a novel idea to produce continuous surfable breaking waves has been patented by Liquid Time Pty Ltd [7], the Webber Wave Pool, whereby one or more pressure sources are rotated within an annular wave pool; Figure 1-3. The pressure source is any object that disrupts the water surface, such as a ship-like hull or submerged body. Ideally, the pressure source should generate high, smooth waves.
The inner ring of the annulus has a sloping bathymetry (i.e. a beach) to induce the waves to break, with the break point following the circular path around the central island at a given water depth (hbreak) proportional to the wave height (Hbreak). Should the pressure sources be
symmetrical about their centre, the waves may be generated in either the clockwise or anti-clockwise directions; that is, rotating the pressure sources anti-clockwise will form left-handed waves, whilst anti-clockwise will produce right-handed waves. An artist’s impression of the concept and a commercial application are shown in
Figure 1-4 and Figure 1-5 respectively, with the pressure sources travelling anticlockwise, generating left-handed waves.
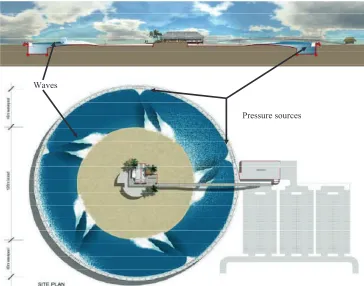
Figure 1-3: Cross-section (top) and plan view (bottom) of circular path in the proposed wave pool design by Webber Wave Pools (reproduced with permission of Liquid Time Pty Ltd).
[image:33.539.89.453.94.380.2]Figure
Figure
permission
Figure 1-4:
Figure 1-5. Artist’s permission of Liquid
Wave pool co
Artist’s impression Liquid Time Pty
concept (reproduced
impression of the wave Pty Ltd). The pressure
left
(reproduced with
wave pool for pressure sources left-handed waves
with permission
for a water park sources are travelling
waves.
of Liquid Time
park complex (reproduced travelling anticlockwise,
Time Pty Ltd).
(reproduced with ticlockwise, generating
Ltd).
1.2
Previous and related work
The understanding and control of ship waves has been considered a key aspect of ship operations, and the focus being on controlling and minimising wave generation. The first investigations on ship wave generation date back to the work of Lord Kelvin [8], Froude [9], Michell [10] and Lamb [11]. Froude's observations led him to describe the resistance of a shape as being a function of the waves caused by varying pressures around the hull as it moves through the water. Thus a hull may be considered a pressure source. Froude defined the relationship between ship velocity, water depth and wave generation; the depth Froude Number (Frh) and ship velocity, waterline length and wave generation; the length Froude
Number (Frl). Motion of the pressure source in a circular path was addressed by Wehausen
and Laitone [12], and further by Bhattacharya [13], Soding [14], Havelock [15] and others.
The operation of ships in constrained waterways has been of particular concern for both ship wave resistance [16] [17], nuisance to other users of the waterway [18] and destructive wave-shore interaction [19]. The blockage ratio (κ), defined as the ratio of the pressure source cross-sectional area (As) to the channel cross-sectional area (Ac), was found to have a significant
effect on wave generation, including the generation of solitary waves or “solitons”. Soliton formation was described by Russell [20], who observed a solitary wave in the Union Canal in Scotland, and characterised by the wave crest being perpendicular to the pressure source direction of travel and with the wave speed proportional to both the water depth and wave height. He reproduced the phenomenon in a wave tank and named it the "Wave of Translation". The conditions for soliton formation has been further defined by many other authors, including Lap [21] and Kryukov [22]. Blockage (κ) was thoroughly investigated by experiments performed by Lap [21] in a towing tank, where he concluded that it had a significant impact on the range of Frh in which solitons were generated. With a small κ,
solitons were only produced with Frh very close to unity, whereas solitons were observed at
lower Frh for large κ. Further work has been conducted to define this “critical zone”,
including work by Lyakhovitsky [23] and Robbins et. al. [24].
shorelines in constrained waterways [17] [24] [27] [28] [29]. A more efficient pressure source shape, being a wavedozer, was investigated by Standing [30], and further developed by Driscoll and Renilson[31] and Renilson [32]. The wavedozer is also a very simple structure to form, essentially simply being an inclined flat plate.
Research has been conducted to understand breaking waves with the aim of designing and installing artificial reefs to improve the surf in the ocean [33] [34]. The earliest work on defining wave breaking relationships was conducted by Miche [35] and Iribarren et al. [36], with Iribarren et al. developing the Inshore Iribarren Number (ξ), to quantify the wave breaking shape in terms of “wave breaking intensity”. Further work on wave breaking has been conducted by Elkeberry and Battjes [37], and by Hutt et al. [38] defining the ranges of wave shape and height for different level of surfer skill. Hartley [39] defined the wave quality in terms of a wave score, based on ξ, wave width (termed the wave “wall”), and wave steepness. These parameters provided a starting point for the design of the wave pool.
Subsequently, Vries [40] and Schipper [41] conducted initial potential flow predictions using the DELKELV linear potential flow model, with the model validated using results from linear scale model testing of two parabolic pressure sources with different beams. A further numerical approach used to consider the effect of wavedozer beam and entry angle on the generated wave height was conducted by Essen [42] using the RAPID non-linear potential flow model.
be predicted and to compensate for the numerical dissipation that resulted in the reduction in the wave height in the far-field experienced by Doyle [43]. Javanmardi [44] also conducted initial scale model experiments to determine the drag on the wavedozer, and validate his model to allow the pressure source propulsion power requirement for the full size pools to be predicted.
1.3
Author’s contribution
The thesis addressed the immediate research aims:
a. To physically and numerically produce predetermined continuously generated surfable breaking waves in a circular pool.
b. To design the optimum pressure source for wave generation.
c. To control the transformation of the wave from the pressure source on the perimeter of the pool to the breaking point.
Without this research the novel concept of generating continuously breaking surfing waves in a circular pool will not be achievable. A number of issues were addressed to allow the pool to be designed:
a. The impact of bathymetry under and close to the pressure source on wave generation and transformation.
b. The influence of the pressure source’s circular track on wave generation.
c. The effect of local currents in the pool on the breaking wave characteristics.
shoreline [17] [28] [29]. The research presented in this thesis and the wave pool is believed to be novel as to the author’s knowledge, no one has aimed to generate such large smooth ship waves in a constrained channel and to control the breakpoint on the beach to generate the desire breaking wave shape. The author’s contribution may be divided into three parts: empirical relationships, numerical approach and experimental results.
The first part of the author’s contribution was devoted to the empirical analysis to determine a series of relationships between wave pool parameters. The empirical analysis combined existing relationship defining the effect of the pressure source shape and operating conditions, and bathymetry on the wave life cycle. To support the empirical analysis, field observations of waves with the preferred wave shape and quality were conducted at Lorne Point [45]. Full scale validation that pressure source generated waves can be surfed was conducted using a fish boat in a river, generating high quality waves suitable for surfing.
A numerical approach was undertaken using the Michlet linear potential flow model [46]. An efficient modeling method was required to conduct an initial analysis of the waves generated by the pressure sources given the freedom to control many of the design parameters, including pressure source configuration (shape, waterline length, beam, draught, and displacement), water depth, and pressure source velocity. Michlet had the advantage of being able to efficiently model a large number of test conditions.
As detailed in Michell [10], the waves are created by a pressure source where there is a longitudinal change in the pressure source cross-sectional area. Therefore, the initial focus was on determining whether a pressure source design that had a continually changing cross-sectional area would efficiently generate large waves. Examples of this design were the hyperbolic tangent waterline pressure sources, used in initial investigation by Schipper [41] and Vries [40].
Michlet was not able to be used to accurately predict the wave heights. These early results were published by the author [45] [47] [48], with the work presented at conferences [49] [50] [51] and other venues.
Subsequently, the author changed the focus of the investigation to an experimental approach, given the limitations of the potential flow numerical approach and with the more complex FVM approach undertaken by Javanmardi [44]. The third part of the author’s contribution was devoted to the experimental validation of the empirical relationships between the design parameters, determination of the limiting parameter values, and the provision of experimental results for the circular track to validate Javanmardi’s numerical model [44]. For this purpose, a scale model of the circular pool with a beach was constructed and a series of three circular track scale model experiments were performed. The wavedozer was found to be the most efficient pressure source, making smooth high waves. The wavedozers used differed from those previously tested by Standing [30], Driscoll and Renilson [31] [32], that spanned the channel, where the wavedozer tested by the author had limited beam. The wavedozer entry angle (α) was initially set to 14O, as used by Driscoll and Renilson [31] [32], however a shallower angle of 7O was found to produce better quality waves.
1.4
Outline of thesis
The structure of the thesis addresses the research aims and issues.
Chapter 2 deals with the requirements of the wave pool from the end-user perspective; being the surfer. The desired wave qualities of height, shape, and speed were defined, and related to the surfer skill level from beginner to expert. An analysis of the wave life-cycle, from generation, through transformation to breaking was conducted. A series of empirical relationships between the pressure shape, operating conditions and the pool bathymetry that allow the pool to be designed to create the required waves.
Chapter 3, with annexes A Scale model experiments and B Scale model experiments run sheet summary, details the test program, model setup, instrumentation, testing procedure, treatment of the results and the error analysis. To provide a qualitative assessment of the breaking wave shape, a wave quality scoring system was defined based on the criteria used for professional surfing competitions, with the results presented in Annex C.
Chapter 4 addresses the experimental results for the effect on wave generation of the pressure source shape, operating conditions and bathymetry design parameters. Results for each of the design parameters are presented, and limiting values discussed.
Chapter 5 focuses on the effect of the bathymetry on the breaking wave shape and quality, the currents generated by the pressure source were determined, the effect on the wave quality discussed and methods to reduce the current velocity were proposed.
Chapter 2 Surfing waves and wave pool design parameters
2.1
Chapter introduction
This chapter details the definition of surfing waves and the empirical analysis of the wave pool design parameter to produce high quality surfing waves.
Wave parameters that define wave quality from the surfer’s perspective are presented. Wave height, shape, width, speed and angle to the shore all determine the suitability of a wave for surfing. Further, a wave suitable for an experienced surfer may be totally unsuitable for a beginner. Therefore, the competing and common requirements for each of these groups are discussed.
With the wave breaking requirements set, the waves needed to be generated and transformed into the required wave breaking shape; the surf. The investigation initially had the freedom to use any range of values for design parameters. No particular pressure source shape, operating conditions or bathymetry was predetermined. Further, as the pressure source was able to be fixed in position relative to the water surface, the design was not even limited by the pressure source having to be positively buoyant or stable.
To begin to constrain the design to one that was able to produce high quality, breaking waves in a constrained waterway, an empirical analysis of the wave life-cycle, from generation, through transformation to breaking was conducted. The outcome is a series of empirical relationships between the pressure shape, operating conditions and the pool bathymetry design parameters.
2.2
Surfing waves
failure to produce high “quality” surfing waves has led to the financial failure of previous wave pools [52].
Figure 2-1. An artist’s impression of a fantasy surfing location (source unknown).
2.2.1
Wave height
When talking about surf, the first question that surfers ask is “how big are the waves?” However, the answer to this question is not straight forward, as surfers still cannot agree on how to measure wave height, whether it is the wave face (on which the surfer rides) [53], the wave height in deep water before the wave breaks (that is measured using swell buoys and detailed in weather reports), or some other measure.
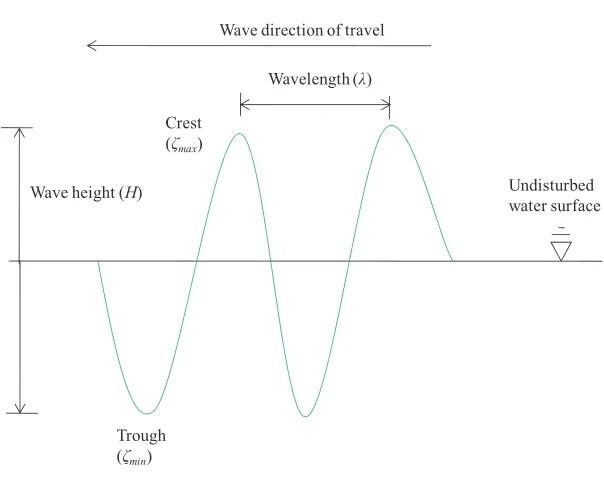
For the purposes of this work, the wave height (H) was defined as the surface elevation of the preceding trough (ζmin) to the surface elevation of the next crest (ζmax), as surface elevation
In the wave pool, the wave height changes as it travels across the channel from being generated at the pressure source, to breaking on the beach, to dissipating following breaking; Figure 2-3. The parameters that define the circular track bathymetry, and therefore the wave transformation and breaking, are shown in Figure 2-4:
a. Radius of the pool outer wall (R0).
b. Radius of the start of the beach (Rbeach).
c. Lateral distance from the outer wall to the start of the beach (ybeach).
d. Water depth at the pool outer wall (h0).
e. Water depth at the start of the beach slope (hbeach).
f. Beach slope (s).
g. Lateral width of the beach (Ybeach).
h. Vertical height of start of the beach (Zbeach).
Further details on the bathymetry parameters are provided in Section 2.4.2.
In conducting the empirical analysis, the waves were assumed to break at the start of the beach (ybeach) with wave height of Hbeach. For a thrilling desirable ride, the wave must be large
enough for the average surfer. As an initial design requirement, Hbeach ≥ 2m was desirable as it
Figure 2-2. Wavelength and height. The waves are travelling from right to left.
Figure 2-3. Wave life-cycle illustrated in the circular scale model; condition 45 model 11-12 at Frh0 = 0.975 with B = 275mm, d* = 0.2 and h0 = 250mm. The model was travelling towards the
camera.
Trough (ζmin)
Wave direction of travel
Undisturbed water surface Crest
(ζmax)
Wavelength (λ)
[image:44.539.110.412.88.329.2]Figure 2-4. Circular track bathymetry parameters.
2.2.2
Wave quality
The next question surfers ask each other when checking the surf is: “how good is it”. That is, for surfing, wave quality is as important, if not more important, than the wave height (Hbeach).
This question is again subjective; however, the wave quality can be broken down into two elements:
a. The wave shape, including the breaking intensity and the width of the surfable wave wall.
b. The speed that the break point travels along the wave crest, which must be matched or exceeded for the surfer to stay on the unbroken part of the wave.
Further, even with the same swell hitting a stretch of coast, the wave quality will differ at different surf breaks due to each location’s bathymetry, orientation to the swell, exposure to the wind and alike. Therefore, surfers will carefully weigh up the factors affecting the surf and often pick the surf break that they believe will offer the highest quality waves, even if it may mean surfing smaller waves.
Beach height (Zbeach)
Start of the Beach (ybeach)
Water depth (h0)
Slope (s)
Pool radius (R0)
Beach radius (Rbeach)
Beach width (Ybeach)
Water depth at the start of the beach (hbeach)
Transformation
Finally, surfers may even trade wave quality for the opportunity to surf more waves in a session, by surfing lower quality, less crowded, waves. For the surfer, the wave quality may be as important, or more important, than the wave height, and the number of waves a surfer may surf in a given time period may be as important, or more important, than both the wave height and quality.
To meet all of the surfer’s requirements, it was desirable to generate as many high quality, smooth waves of Hbeach ≥ 2m as possible in each pool.
2.2.3
Wave shape
The shape of the wave at the breakpoint is a critical element of the suitability of the wave for surfing. The shape of the wave is defined both in terms of the breaking intensity and wall width.
Breaking intensity
Galvin [54] and Battjes [55] found the wave break with different breaker shapes dependent on the beach slope (s), Hbeach and the wavelength where the wave crest is parallel with the beach
slope (λs). Battjes [55] used the inshore Iribarren number (9), also called the “surf similarity
parameter”, to describe the breaker type on the basis of previous results of Galvin [54]:
9 = tan =
&>?@AB#/DE
(2.1)
with λs being the wavelength [m] in deep water perpendicular to the orthogonal slope.
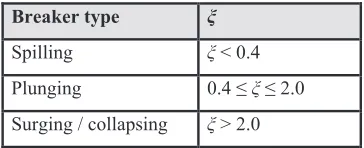
Breaker type ξ
Spilling ξ < 0.4
Plunging 0.4 ≤ξ ≤ 2.0
Surging / collapsing ξ > 2.0
Table 2-1. Breaker type and ξ (from Battjes [55]).
Spilling waves (ξ < 0.4) occur if the wave crest becomes unstable and flows down the front face of the wave producing a foamy water surface. Surfers would say a ‘soft’ or ‘weak’ wave. This regime was considered surfable; Figure 2-5.
Figure 2-5. Spilling wave generated by condition 48 run 402 model 12-02 with ξ = 0.4, d* = 0.2 in h0 = 250mm at Frh0 = 0.95 and s = 9O and ybeach* = 1.4. The pressure source was travelling towards the
camera.
Plunging waves (0.4 ≤ ξ ≤ 2.0) occur if the crest curls over the front face and falls into the base of the wave; surfers call this a barreling or tubing wave; Figure 2-6 with 9 = 0.95. This regime is preferred by most surfers and the wave pool will be designed to create these types of plunging waves.
[image:47.539.179.361.93.167.2]Figure 2-6. Plunging waves (first and second waves) generated by condition 56 model 12-02 with ξ = 1, d* = 0.2 in h0 = 250mm at Frh0 = 0.95 and s = 17O and ybeach* = 1.9.
Collapsing waves (ξ > 2.0) occur if the crest remains unbroken and the front face of the wave steepens and then falls, producing an irregular turbulent water surface; Figure 2-7. Surfers often encounter this regime at reef breaks when the tide is too low and the reef is not submerged enough to produce surfable waves. This is an unsurfable regime.
Figure 2-7. Collapsing breakers (first and second waves) generated by condition 52 model 12-02 with ξ = 2.3, d* = 0.2 in h0 = 250mm at Frh0 = 0.95, s = 23O and ybeach* = 1.9.
Plunging waves
Surging waves (ξ > 2.0) occur if the crest remains unbroken and the front face of the wave advances up the beach with minor breaking; Figure 2-7. This regime was considered unsurfable.
Figure 2-8. Surging waves generated by condition 50 model 12-02 with ξ = 3.3, d* = 0.2 in h0 = 250mm at Frh0 = 0.9, s = 23O and ybeach* = 1.4.
Combined with Hbeach ≥ 2m, the plunging wave shape allows the average height surfer to be
able to stand “inside” the wave; Figure 2-9. Riding inside plunging, or “barrelling”, waves is the most highly sought after experience in surfing, requires high quality waves and sufficient surfer skill. High quality plunging waves are naturally rare as not all surfing breaks generate plunging waves, and due to the distribution of Hbeach in a wave group (known in surfing as a
“set” of waves), not every wave plunges. This rarity drives surfers to routinely travel all over the world in the search for high quality plunging waves. Therefore, to constantly generate high quality plunging waves is the ultimate aim of the wave pool.
Figure 2-9. Surfer riding plunging “barrelling” wave of Hbeach ≈ 2m.
Surging waves
Wall width
The length of a smooth, unbroken wave crest was defined as the usable “wall” width. As defined by Hartley [39], a wide steep wall was required to provide surfers sufficient vertical and lateral space to perform typical manoeuvres. An example of such a high quality wave is shown in Figure 2-10.
Mead et. al.[34] further associates the different parts of the breaking wave with the different manoeuvres .The ‘pocket’ is just in front of the barrel (break point) and is where the majority of the wave’s power is located. It forms the steepest part of the wave and thus is the section where surfers are able to generate the most speed. The ‘shoulder’ is where the wave is the less steep and generally surfers will struggle to generate speed whilst surfing on this section. Advanced surfers will often use a cutback manoeuvre to position themselves back in the pocket. The ‘lip’ is the uppermost point of the wave and is used for powerful top-turns or aerials. The ‘white water’ is the broken part of the wave in which is generally avoided by surfers of a reasonable skill level. The white water may be ridden by beginners while they are learning to stand up, but this is undesirable for experienced surfers.
2.2.4
Surfer velocity components and wave celerity
With the desired wave size and shape defined, the surfer velocity components and the wave phase speed or “celerity” (cp) needed to be determined.
Peel angle (θpeel) was defined as the angle between the trail of the broken wave crest (white
water) and the unbroken wave crest as it propagates shoreward; Figure 2-11 [56] [38] [34]. Peel angles range between 0° and 90°, with low angles creating fast surfing waves and high angles creating slow waves [38]. The wave peel rate (vpeel) described the speed that the
breakpoint advances laterally along the wave crest, and was determined by the peel angle. The surfer must surf across the wave crest at least as fast as the wave peel rate in order to stay in front of the wave break point [33], with the surfer’s speed (csurfer) or “board speed” [57] at the
breakpoint, Figure 2-11, being:
IE%JK@J= IL/ sin OL@@P (2.2)
and
QL@@P= IL/ tan OL@@P (2.3)
The physical limiting values for θpeeland the impact on the wave quality were:
a. θpeel = 0O, vpeel → ∞ and csurfer → ∞; Figure 2-12. In this case, the wave crests are
parallel with the shoreline and the entire wave crest breaks simultaneously and the surfer is unable to stay on the unbroken wave face. This situation is termed a “close-out” [34].
b. θpeel=90O, vpeel = 0 m/s and csurfer= cp; Figure 2-13. In this case, the wave crests are
The effect is that the surfer, and the wave breakpoint, travel parallel to the shoreline, but towards the shore, at the surfer speed (csurfer). To illustrate this, the wave velocity components
are shown overlayed on the popular surf site at Lorne Point in Victoria, Australia [45]; Figure 2-14. This example closes matches the schematic shown in Figure 2-11. Lorne Point was considered a close analogue to waves to be generated in the wave pool, with θpeel≈ 45O and a
[image:52.539.91.455.216.461.2]plunging wave shape for even small waves of hbeach≤ 1m.
Figure 2-11. Surfing speed components.
Rocky point
Sandy beach
Broken wave crest
Unbroken wave crests
v
peelc
pθ
peelSurfer’s path
c
surferWave
Figure 2-12. “Close-out” wave with θpeel = 0O.
Figure 2-13. “Slow” wave with θpeel = 90O.
Shoreline
Broken wave crest Unbroken wave crests
vpeel→ ∞ θpeel = 0 cp Surfer’s path csurfer→ ∞
Wave direction of travel
Rocky point
Broken wave crest
Unbroken wave crests
V
peel= 0
c
surfer= c
pθ
peelSurfer’s path
Wave
.
Figure 2-14. Lorne point with breaking waves (both elevation and plan view). The crest lines are indicated by the red lines, with the wave direction of travel perpendicular to the crest line (blue arrow).
The black arrow indicates the surfer’s and the breakpoint path, moving parallel to the shoreline at the
“board speed” (csurfer). (Images captured from www.swellnet.com.au and GoogleMaps).
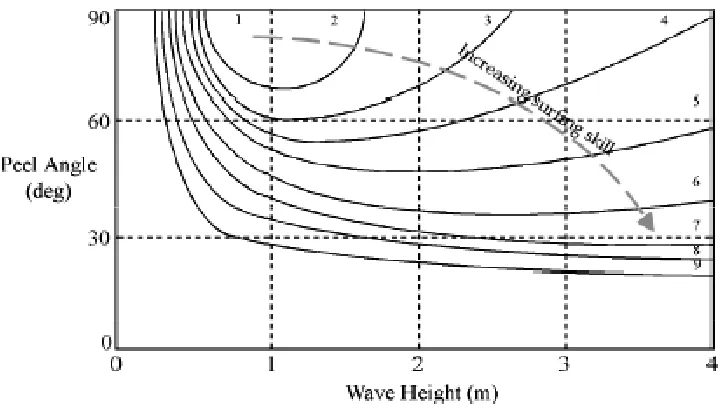
Surfer skill
Hutt et al. [38] defined the minimum surfer skill required to stay in the break point as a function of peel angle (θpeel) and wave height (Hbeach), and thus wave peel rate (vpeel);
Figure 2-15:
a. 1-3 - beginner level of skill required;
b. 4-6 - intermediate level of skill required; and
c. 7-9 - expert level of skill required.
The assumption was the greater surfer skill is required to generate the higher vpeel.Therefore,
to allow the wave pool to be used by surfers with the broadest range of skill level, with the desire value of Hbeach≥ 2m, the range of peel angles possible was27O < θpeel< 90O.
Surfer path
c
pθ
peelv
peelFigure 2-15. Surfer skill as a function of the peel angle (θpeel) and wave height (Hbeach)(reproduced
from Hutt et al.[38]).
Surfer speed and wave celerity
Whilst the surfer must generate a sufficient velocity across the wave (vpeel) to stay ahead of
the break point, to design the wave pool the pressure source velocity needed to be determined
from the wave speed (cp).
The preferred cp range for surfing was determined by considering questions:
a. What is the design range of cp for a surfing wave?


![Figure 2-16. Dally [57] and Hutt et. al. [38] observed mean wave speed (cp) for surfing.](https://thumb-us.123doks.com/thumbv2/123dok_us/8420296.329524/56.539.93.446.203.541/figure-dally-hutt-observed-mean-wave-speed-surfing.webp)