Faculty of Engineering and Surveying
Toowoomba, QLD 4350
Demand-Supply Interacting System
Towards a Dynamic Electrical Energy Management-
The Smart Grid
A dissertation submitted by
Abdullah Khalfan AlMahrouqi
(Student No. 0050083405)
in fulfilment of the requirements of
ENG8002-Project and Dissertation
towards the degree of
Master of Engineering Technology (Power Systems
Engineering)
Project Supervisor: Dr. Fouad Kamel
Project Co-Supervisor: Dr. Wei Xiang
Course Examiner: Dr. Tony Ahfock
High peak demands are common occurrences in Australian electricity market increasing the
volatility of electricity whole sale prices. Recently, reducing electricity demand has been one
of the most common objectives for all electricity suppliers, environmental organizations and
others at the national and international level. Peak demands make it difficult to meet the
increased demand of electricity, to lower prices, to increase quality and to avoid negative
impacts on the environment. A scheme that allows consumers to moderate own demand will
reduce the electricity peak demands.
This project describes and delineates the scheme of averting peak demands. The main
premise up on which this study is designed is to enable electricity users to effectively manage
and control own demand based on information, publicly available from the Australian Energy
Market Operator (AEMO). Adequately managing and controlling energy demands shall lead
to enhanced system performance. The scheme is contributing towards achieving a Smart Grid
Faculty of Engineering and Surveying
ENG8002
Project and Dissertation
LIMITATIONS OF USE
The Council of the University of Southern Queensland, its Faculty of Engineering and
Surveying, and the staff of the University of Southern Queensland, does not accept any
responsibility for the truth, accuracy or completeness of material contained within or
associated with this dissertation.
Persons using all or any part of this material do so at their own risk, and not at the risk of the
Council of the University of Southern Queensland, its Faculty of Engineering and Surveying
or the staff of the University of Southern Queensland.
This dissertation reports an educational exercise and has no purpose or validity beyond this
exercise. The sole purpose of the course pair entitled "Research Project" is to contribute to
the overall education within the student’s chosen degree program. This document, the
associated hardware, software, drawings, and other material set out in the associated
appendices should not be used for any other purpose: if they are so used, it is entirely at the
risk of the user.
Professor Frank Bullen
Dean
I certify that the ideas, designs and experimental work, results, analyses and conclusions set
out in this dissertation are entirely my own effort, except where otherwise indicated and
acknowledged.
I further certify that the work is original and has not been previously submitted for
assessment in any other course or institution, except where specifically stated.
My Full Name: Abdullah Khalfan Mohammed ALMahrouqi Student Number: (0050083405)
………..………..
Signature
………..………..
I would like to express my warm appreciation to the advisory committee: Dr. Fouad Kamel,
Dr. Wei Xiang and Dr. Tony Ahfock for their help and positive attitudes. I would like to
express my deepest gratefulness to my project supervisor, Dr. Fouad Kamel, for his precious
time, continuous assistance, consultation, encouragement, valuable feedback and patience
during the entire period of the preparation of the project.
I would like to express my special gratitude to the Faculty of Engineering and Surveying at
USQ for facilitating the experiments of the project by providing equipped laboratories and
electrical devices.
I also wish to thank USQ library staff for facilitating accesses to rich databases, valuable
references and for their effective guidance.
I wish to express my thanks to all those who contributed to successfully complete the project.
Abdullah AlMahrouqi
Signature: ……….
TABLE OF CONTENTS
ABSTRACT ... i
LIMITATIONS OF USE ... ii
CERTIFICATION ... iii
DEDICATION ... iv
ACKNOWLEDGEMENTS ... v
LIST OF FIGURES ... ix
LIST OF TABLES ... xi
Chapter 1 INTRODUCTION ... 1
1.1 Problem Description ... 1
1.2 Proposed solution ... 2
1.3 Disposition ... 3
1.4 Abbreviation ... 5
Chapter 2 RESEARCH GOALS & OBJECTIVES ... 7
2.1 Objectives ... 7
2.2 Goals... 7
2.3 Project description ... 8
2.4 Towards Smart Grid ... 8
2.5 Project focused sector and area ... 9
Chapter 3 BACKGROUND ... 13
3.1 Australian electricity market ... 13
3.1.1 National Electricity Market ... 14
Australian Energy Market Operator ... 16
3.1.2 Western Australia’s electricity System ... 17
Independent Market Operator (IMO)... 17
3.1.3 Northern Territory’s electricity industry ... 18
3.2 Current Electricity Demand and cost ... 18
3.3 Critical market situations ... 27
3.4 Peak Demand Impacts ... 33
3.4.1 Technical impacts ... 33
3.4.3 Environmental impacts ... 35
3.5 Related researches and applications ... 36
Chapter 4 ELECTRICTY MARKET IN QUEENSLAND ... 40
4.1 Stages of electricity delivery in QLD ... 41
4.1.1 Generation ... 42
Fueling Queensland's electricity supply ... 44
4.1.2 Transmission ... 45
4.1.3 Distribution ... 46
4.2 Electricity selling contracts ... 48
Chapter 5 METHODOLOGY ... 50
5.1 Project concept ... 50
5.2 Demand Side Response ... 50
5.3 Proposed Design ... 54
5.4 Apparatus ... 55
5.4.1 Internet modem ... 55
5.4.2 Personal computer ... 55
5.4.3 Interface unit ... 56
5.4.4 Power switches... 58
5.4.5 Cables and wires ... 60
5.5 Software ... 61
5.6 System installation requirements ... 63
5.7 System operation ... 65
5.8 Safety precautions ... 66
Chapter 6 ACHIEVED RESULTS, REQUIREMENTS FOR WIDE DEPLOYEMENT AND SCHEME LIMITATIONS ... 67
6.1 Achieved results ... 67
6.2 Implementation requirements ... 68
6.3 Limitations ... 69
Chapter 7 SCHEME APPLICATIONS AND RETURNS ... 71
7.1 Scheme implications ... 71
7.2 Project returns ... 77
Chapter 8 FUTURE WORK & CONCLUSION ... 81
8.1 Future work ... 81
8.2 Conclusion ... 83
REFERENCES ... 84
APPENDICES ... 94
Appendix 1 – Project specification (Initial and Updated) ... 95
Appendix 2 – Software codes (Demand and Price controlled) ... 98
A) Demand controlled ... 98
B) Price controlled ... 101
LIST OF FIGURES
Figure 2.1 Electricity consumption by sector, (AEMO 2009) ... 10
Figure 2.2 Total energy sent out (2007-2008), (AEMO 2009) ... 11
Figure 2.3 Average daily 2007-2008 demand (MW), (AEMO 2009) ... 12
Figure 3.1 Transmission lines and generators in Australia (Cuevas-Cubria et al., 2009, pp.31) ... 13
Figure 3.2 Electricity market structure, (Cuevas-Cubria et al., A 2009) ... 16
Figure 3.3: Electricity Demand and Cost, Queensland, (AEMO, 2009b) ... 19
Figure 3.4 Electricity demand in Queensland in 2008, data extracted from the Australian Energy Market Operator AEMO (2009) (Kamel & Kist, 2009). ... 20
Figure 3.5 Frequency of occurrence of electricity wholesale price RRP in Queensland year 2008, data extracted from the Australian Energy Market Operator AEMO (2009) (Kamel & Kist, 2009)... 21
Figure 3.6 National Electricity Market electricity consumption (AER, 2009) ... 22
Figure 3.7 National Electricity Market peak demand (AER, 2009) ... 23
Figure 3.8 Illustrative generator offers (megawatts) at various prices, (AER, 2009) ... 24
Figure 3.9 Daily Load Curves for South Australia and New South Wales for Tuesday, December 9, 2008, (Evans & Quirk, 2009) ... 25
Figure 3.10 Electricity wholesale Price Curves for South Australia and New South Wales for Tuesday, December 9, 2008, (Evans & Quirk, 2009) ... 26
Figure 3.11 Daily spot electricity prices for QLD market, 13/12/1998 – 30/6/2001 (Worthington et al., 2005) ... 27
Figure 3.12 Daily spot electricity prices for QLD market ($/MWh), 1/1/1999 – 31/12/2004 (Higgs, 2006) ... 28
Figure 3.13 Fluctuation of electricity prices in Queensland, data extracted from the Australian Energy Market Operator AEMO (Kamel & kist, 2009) ... 29
Figure 3.14 Queensland Average Weekly Pool Prices (1998-2007) (DME, 2007b) ... 29
Figure 3.16 Queensland Yearly Average Pool Price 1998-2008 ... 31
Figure 3.17 Energy Dispatch Prices in the NEM ($/MWh) (NEMMCO 2008b) ... 32
Figure 3.18 peak and off-peak wholesale spot prices in different time zones of USA (2007), (Huber, 2008) ... 38
Figure 4.1 Electricity delivery chain in QLD. ... 42
Figure 5.1 Areas of possible demand response ... 51
Figure 5.2 Illustration of the peakiness of the network demand and opportunities for DSR applications (Diagram provided by EUAA/Pareto from the EUAA Report on the DSR)... 53
Figure 5.3 Project concept design, Note: the dotted line located inside the house. ... 54
Figure 5.4 Project apparatus ... 55
Figure 5.5 Web Relay components and features (XRDI, 2007) ... 56
Figure 5.6: Solid state relay ... 58
Figure 5.7 SSR basic circuit diagram (NI, 2008) ... 59
Figure 5.8 Flow chart of software sequence for one switch ... 62
Figure 5.9 Entire system circuit diagram ... 64
Figure 5.10 System connection ... 65
Figure 7.1 loads selection and prioritize by consumers through the project scheme. ... 71
Figure 7.2 Day electricity demand curtailed for wholesale regional reference price not to exceed AUD $55/MWh in Queensland in 2008 (Kamel, 2009). ... 72
Figure 7.3 Electricity demand curtailed in Queensland not to exceed $55/MW (Kamel, 2009). ... 73
Figure 7.4 Achievable energy savings by curtailing energy demand over a certain energy prices, Queensland 2008, (Kamel, 2009b) ... 74
Figure 7.5 Electricity demand curve during a period of time ... 75
Figure 7.6 Opportunities for best utilization of electricity ... 76
LIST OF TABLES
Table 3.1 National Electricity Market at a glance (AER, 2009) ... 15
Table 3.2 Annual electricity consumption (terawatt hours) in the National Electricity Market
(AER, 2009) ... 21
Chapter 1
INTRODUCTION
1.1 Problem Description
Reaching high electricity demands for a few hours a day is one of the most significant
problems at the national and international level. The current increase in demand peaks in
Australia is unprecedented particularly at the level of the residential sector. The reason for
electricity demand peaks includes the simultaneous high consumption of electricity. Not only
does the wasted energy resulting from the unconscious consumption like over cooling or over
heating or in lighting contribute to the electricity demand peaks, but the rapidly increase in
miscellaneous Information Technology (I T) and entertainment equipments has also
contributed to the increase in the simultaneous electricity consumption (Williams et al., 2006;
GEF, 2008). Other reasons contributing to increase in demand peaks include the lack of
residential consumers’ awareness of the dramatic increases occurring due to simultaneous
high consumption.
The residential electricity usage in the National Electricity Market (NEM) represents 27.8%
of the total electricity demand in 2009 (AEMO, 2009). This estimated ratio is expected to
considerably increase in the coming years due to the growing of the population and other
factors such as increase in Heating, Ventilation and Air Conditioning (HVAC) system usage
due to increase in population and residential households. The number of the occupied
residential households is expected to rise from six millions to about ten millions in the period
from 1990 to 2020, or approximately 61% increase (EES, 2008). The study also estimated
increase by about 56% over the same period by about 20 % increase per person (EES, 2008).
Although the peak demand time is normally about 0.2 % of the whole day, such short period
of time requires establishing more than 5 % of the entire specified electricity network
infrastructure in order to assure electricity supply (Fraser, 2005; Kamel, 2009).
The relationship between electricity users and suppliers in the electricity market has been
usually based on that whenever and whatever loads are required by users, they are expected
to be met by suppliers at the expected time with the maximal quality. The above electricity
consumption increase in the residential sector and other sectors is leading to the
overcrowding electricity demands. However, to meet the current continuous growing
electricity demands, there should be a constantly growing electricity supply; this would lead
to assist the existing network with more electricity generators and improve transmission and
distribution infrastructure. More noticeable negative impacts could occur including increase
in energy generating cost, increased electricity prices, compromised quality e.g. voltage
fluctuations, technical and economic deficiencies and even undesirable environmental
impacts e.g. greenhouse gas emissions. Technical and economic difficulties are presented
mainly in congestions at peak demands associated with compromises in quality and
high-priced energy. At low-demands, a resulting low energy cost could drive power stations to
operate at the limits of economic viability (Kamel, 2009).
1.2 Proposed solution
With the problematic issue of the increased electricity demand and excessive peak demands,
there is a need to design a system that enables electricity consumers to decrease and defer
their usage as required. The users are receiving information from the Australian Energy
system enables users to rationally decide the quantity of energy usage based on information
publicly received on the internet. With such effective engagement, the users could contribute
and control electricity demand paving the way towards achieving improved electrical supply
services.
The main premise of this research is based on information made public through AEMO to the
electricity users through the internet about the state of electricity market (electricity demand
or load profile). The load curve will show a peak point where electricity consumption reaches
critical points causing undesired consequences. Providing consumers with such a load curve
will enable users to switch off certain load when the state of electricity demands reaches
certain limit. More details about this technique will be elaborated in the followings chapters.
1.3 Disposition
This report is divided into eight chapters and three appendices.
The first chapter presents the introduction of the report and the significance of the project,
provides discussion of the problem for the increased peak demand and describes the proposed
solution and the abbreviations used in the report.
In the second chapter, the report focuses on describing the goals, objectives, project
description and focus region and sector of the project.
In the third chapter entitled background, the report presents review of the literature about the
most significantly related topics to the project including electricity market in Australia,
analysis of the current electricity demand costs and the critical market situations which
occurred because of peak demands. The third chapter provides the related studies which have
electricity market management and the main companies or authorities that are responsible for
the management process and extends to discuss the national electricity market providing
description of the development of Australian Energy Market Operator.
Chapter four discusses analysis of the Queensland electricity market providing discussion of
the stages of electricity delivery and electricity selling contractors.
The fifth chapter involves discussion of the proposed design for reducing the electricity
demand, description of the apparatus used and the connection and operation of the system.
The sixth chapter provides discussion of the results which have been achieved through the
project and the benefits which have resulted. Besides, it continues to provide the
implementation procedures of the proposed design and the hindrances that could be
confronted by its implementation.
The seventh chapter explains the implications of implementing the proposed scheme, which
could be applied in Queensland and in other markets. Besides, different types of returns
obtained by implementing this scheme have been provided in chapter seven.
Finally, the eighth chapter lists suggestions for possible future studies based on the scheme
and provides a conclusion.
Three appendices are providing project specifications, software codes, and software
1.4 Abbreviation
AEMO Australian Energy Market Operator
AER Australian Energy Regulator
AMI Advanced Metering Infrastructure
BMS Building Management System
DSR Demand Side Response
GOC Government Owned Corporations
HVAC Heating, Ventilation and Air Conditioning
I T Internet Protocol
IMO Independent Market Operator
kWh kilowatt hour
LED Light-Emitting Diode
LPG Liquefied Petroleum Gas
MOSFET Metal–Oxide–Semiconductor Field-Effect Transistor
MWh Megawatt hour
NEM National Electricity Market
PCF plant capacity factor
RRP Regional Reference Price
SCC Standard Connection Contract
SSR Solid State Relay
STEM Short Term Energy Market
SWIS South West Interconnected System
WEM Wholesale Electricity Market
Chapter 2
RESEARCH GOALS & OBJECTIVES
2.1 Objectives
On a long term, applying the system could lead to the followings benefits:
Decreasing Peak Demand.
Raising users’ awareness.
Reducing Environmental impacts.
Improved system reliability.
Reducing electricity Price.
Reducing price volatility.
Improved efficiency.
Improved economics.
2.2 Goals
The project goals which are to be accomplished during the offered period are as follow:
1. Problem identification.
2. Identification of solutions.
3. Define project components.
4. Components selection.
5. Coordination with concerned utilities and suppliers.
6. Choosing and writing software.
8. Conducting experiment.
9. Work evaluation.
10.Writing the dissertation.
2.3 Project description
With the use of the publicly published information, customers will be alarmed about the need
for reduction in their demand at particular times. Upon getting the signal containing this
information about electricity rates or peak demand, the customer (computer) scrutinizes the
condition to immediately take the appropriate action. This action should be carried out
according to the consumer management plan.
Reduction in demand peaks are expected to reflect economic/social/environmental benefits to
consumers, suppliers, generators and the whole economy. No doubt that the utility is the
direct beneficial from implementation of the system, so it ought to be offering incentives to
the consumers to encourage them implementing the scheme. Such encouragement can be bill
credit, direct payments or any other inducement which will not only satisfy the consumers but
let them express about their willingness to participate in such mutually beneficial plan, even
if not called by the utility.
2.4 Towards Smart Grid
Given that the project design is one part of the entire smart grid, it would be beneficial for
this project to provide some information about the smart grid. Smart grid, or Dynamic Energy
Management framework, is an intelligent connected communication and control system
(Brown, 2008). Drifting from manual connection between all components of the entire
electricity community, the smart grid allows automatic and intelligent multisided flow of
energy and information between electricity generators and end users. Its main role is to
provide the right information to the right entity at the right time to take the right action. Smart
grid reduces power losses, enhances power supply and delivery, enables self-healing, and
paves the way to the next-generation energy efficiency and demand response applications
(Gellings, 2008). Smart grid main features include the two sided communication within the
grid community; therefore, electricity consumers can, whenever they want, move from
passive to active participation in the marketplace (LSC, 2007; Albadi & El-Saadany, 2007).
Smart grid comprises computerized multi-sided standard intelligent devices which allow
communication among the participants of the entire electricity system including transmission,
distribution and end use devices(Brown, 2008). Other functions performed by smart grid
include smart interconnections to distributed energy resources and advanced metering
infrastructure (AMI) (Bennett & Highfill, 2008). Smart grid automatically delivers power in
response to end users’ varied demand and gathers power from those end users whether they
are residential, businesses who produce their own power by solar, wind or geothermal power
when they have more than they need (Gunther et al., 2009).
2.5 Project focused sector and area
Although the project is compatible to be implemented in any electricity using sector, the main
focus of the project, for significant reasons, is on the residential sector in Queensland. The
residential sector is considered one of the largest electricity consumers in Australia next to
the industrial sector (APC, 2005; AEMO, 2009). Moreover, given that the commercial sector
sector is able to afford the prices offered by suppliers. This makes the commercial sectors less
attracted than the residential sector for implementing the project. It is estimated that the
number of households in Australia will be growing by approximately 39% to 47% in 2026, or
from 7.4 million in 2001 to between 10.2 and 10.8 million in 2026 (ABS, 2006). The increase
in households is expected to be faster and higher than the growth of Australia's population
growth of 25% for the same period. Other reasons include that most individuals’ electricity
related activities are based at homes with the availability of domestic appliances which
provide users with the lifestyle needed such as cooling, heating, lighting internet,
entertainment and etc. For example, the operation of split-cycle air-conditioning into
hundreds of thousands of Australian houses has had a dramatic impact on the daily electricity
load and on seasonal variations in demand for electricity (Frew, 2006a).
Figure 2.1 Electricity consumption by sector, (AEMO 2009)
Figure 2.1 indicates the electricity usage for every sector in Australia including residential,
industry, transport, agriculture and storage. It indicates that the residential sector includes the
largest electricity consumers and comes in the second rank at 27.8 % while the industrial
sector which involves metals, aluminum smelting, manufacturing and mining comes in the
first rank at 48 %. Even the commercial sector comes in the third rank at 22.4 %. This makes
the residential sector one of the most significant sectors in electricity consumption which if
From the five states in Australia, the project focuses on Queensland for different significant
objectives. For example, the fastest household growth in Australia is expected to occur in
Queensland in the period from 2001 and 2026. The households in Queensland are expected to
increase by approximately 63% to 76%, from 1.4 million in 2001 to between 2.3 million and
2.4 million in 2026 which is considered to be faster than the expected national growth of 39%
to 47% (ABS, 2006).
Figure 2.2 below indicates the number of electricity consumers in every state in all Australia
including Queensland. The chart indicates that although New South Wales comes in the first
rank in terms of the number of electricity users because of its large population, electricity
consumers in Queensland represents around 28 percent of all electricity consumers in
Australia making Queensland second largest electricity consumer in all Australia.
Figure 2.2 Total energy sent out (2007-2008), (AEMO 2009)
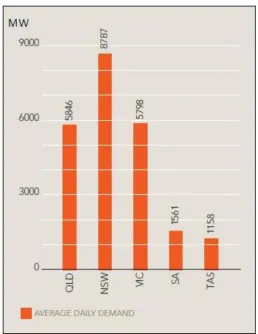
Figure 2.3 illustrates that the main three states which are considered large electricity
consumers on a daily basis in Australia are QLD, NSW and VIC. In terms of the average
daily demand, Queensland State has the second largest electricity demand which reached an
average of 5846 MW in 2007-2008. Reducing the electricity demand in Queensland shall
Figure 2.3 Average daily 2007-2008 demand (MW), (AEMO 2009)
In the period from 1999-2000 to 2007-08, the annual growth of electricity consumption in
Queensland has increased by more than 29 percent or approximately 10,500 Giga Watt hours
(GWh) making Queensland the second highest consumer of electricity in Australia. In
February 2009, for example, Queensland's record electricity power demand reached 8699
Chapter 3
BACKGROUND
3.1
Australian electricity market
The Australian electricity market involves three main regions; Western Australia, Northern
territories and the NEM which involves six interconnected states. Due to the geographical
distance among the three regions, it is not possible to interconnect them into one network
(Karri et al., 2007). The following part provides a brief explanation about the electricity
market in the three regions. Figure 3.1 illustrates the electricity network i.e. transmission
[image:25.595.76.523.392.710.2]lines and generators in the three regions.
3.1.1 National Electricity Market
Establishing the National Electricity Market (NEM) has been one of the most significant
reforms that occurred to electricity and gas supply industry in Queensland (Phunnarungsi &
Dixon, G 2003). Instead of owning and operating Australia’s electricity suppliers and gas
companies by the states and territories governments, National Energy Market (NEM) which
allows businesses to manage electricity and gas supply was established on 13 December 1998
(Higgs, 2009).
The NEM, geographically the largest interconnected power system in the world, involves 270
registered generators, transmission networks for six states and 13 major distribution networks
which collectively supply electricity to end use customers. The main regions involved in the
market include New South Wales, Queensland, Victoria, South Australia and Tasmania. The
customers supplied by electricity by the NEM are almost nine million residential and
business customers. The market generated around 208 terawatt hours (TWh) of electricity in
Table 3.1 National Electricity Market at a glance (AER, 2009)
In the NEM, businesses and retailers have been enabled to supply electricity; therefore,
consumers could compare the electricity prices available from different suppliers with the
aim that competition would deliver cost efficiencies to the market. The main functions of the
NEM include administering the trade between the generators of electricity and the wholesale
consumers of electricity. The activities of administering the electricity trade include setting
electricity demand levels, receiving offers to supply electricity from generators, scheduling
generators, dispatching generators into production, calculating the spot price of electricity,
measuring electricity use and financially settling the electricity market (DME, 2009b;
AEMO, 2009).
The NEM which is the umbrella under which electricity generators, distributors and retailers
trade electricity 24-hours-a-day and seven-days-a-week is operated and administered by the
National Electricity Market Management Company Limited (NEMMCO) which is made up
[image:27.595.117.478.73.334.2]Capital Territory, Victoria, South Australia and Tasmania (Anderson et al., 2007). However,
the roles of NEMMCO has been recently operated and administered by Australian Energy
Market Operator (AEMO), which was established on first of July 2009 (AEMO, 2009).
Figure 3.2 illustrates the electricity market structure.
Figure 3.2 Electricity market structure, (Cuevas-Cubria et al., A 2009)
Australian Energy Market Operator
Australian Energy Market Operator (AEMO) operates the electricity trade by aggregating
electricity produced by generators into an electricity pool to be bought by market retailers or
suppliers. The other key roles of AEMO include the National Transmission Planning function
for electricity, production of a National Transmission Network Development Plan, ensuring
the supply of electricity by measuring the power system’s capacity to continue operating,
managing a Supply Reserve to cater for shortage in electricity supply compared to the
demand (AEMO, 2009c). Establishing the AEMO has resulted into ongoing improvements
to efficiency and competitiveness in gas and electricity markets and warranting that
Australians retain is secure and effectively managing energy markets and electricity for the
3.1.2
Western Australia’s electricity System
Western Australia, owing to its geographical distance, could not be physically interconnected
with the other states under NEM (AER, 2009). However, western power, a State Government
owned corporation dominated the energy industry in WA. The Wholesale Electricity Market
(WEM) was established in 2006 in the South West Interconnected System (SWIS) of
Western Australia (Karri et al., 2007). Three mechanisms for energy trading exist within the
WEM; Bilateral Trade of Energy (Bilateral Contracts), Short Term Energy Market (STEM)
and the Balancing Mechanism. The Independent Market Operator (IMO), a government
body, was established in order to operate and oversee the WEM in accordance with the
Market Rules (Stewart, 2005).
Independent Market Operator (IMO)
Pursuant to the Electricity Industry Act 2004, the IMO was established to be a corporate body
responsible for the management and operation of the Western Australian Wholesale
Electricity Market. Furthermore, the IMO assures efficient capacity to meet Western
Australian consumers’ demand within the South West Interconnected System which is the
biggest interconnected network in WA. 88,000 km of power lines that cover about 322,000 sq
km which connects about 840,000 properties e.g. homes, offices and factories to the network
(Karri et al., 2007; AER, 2009). Energy resources used for power generation in the SWIS is
mainly coal and natural gas, with some liquid-fuelled plants used for peaking duty. However,
there are still renewable energy sources such as wind farms and a number of small landfill
gas projects responsible for a small amount of generation (Stewart, 2005). SWIS, despite the
large area it services, has an installed capacity of just over 4200 MW and a summer peak
been, in a reform process, divided into four separate publicly owned utilities managing four
areas; Generation (Verve Energy), Retail (Synergy), Networks and System Management
(Western Power) and Regional Power (Horizon Power) (Stewart, 2004; Stewart, 2005).
3.1.3
Northern Territory’s electricity industry
Around 82,500 only of the 220,000 population of the Northern Territory (NT) are connected
to a network making the electricity industry in NT small. In NT, three relatively small
regulated systems exist; the largest is the Darwin-Katherine system, with a 320 MW capacity.
After the commissioning of the first generator at the Weddell Power Station, the Territory’s
regulated systems had 444 MW of total capacity at 30 June 2008 (AER, 2009). In 2007-08
the Territory consumed around 1795 GWh of electricity. Main generators are Gas fired plants
which generate public electricity in NT, sourcing gas from the Amadeus Basinin Central
Australia. However, increasing demand in NT cannot be met by the Amadeus fields and
many contracts for gas supply are due to end in 2009 (AER, 2009).
3.2 Current Electricity Demand and cost
The electricity demand-cost relationship presents a challenge for generators, suppliers and
consumers. The main reason for the increased costs for the increased demand is that
generating lower loads of electricity does not require the same equipments and preparations
as producing higher electricity loads does. However, the other end of the formula
(consumers) is not aware of the electricity demand-cost relationship because they are charged
a fixed price whether demand increased or not (Fraser, 2005).
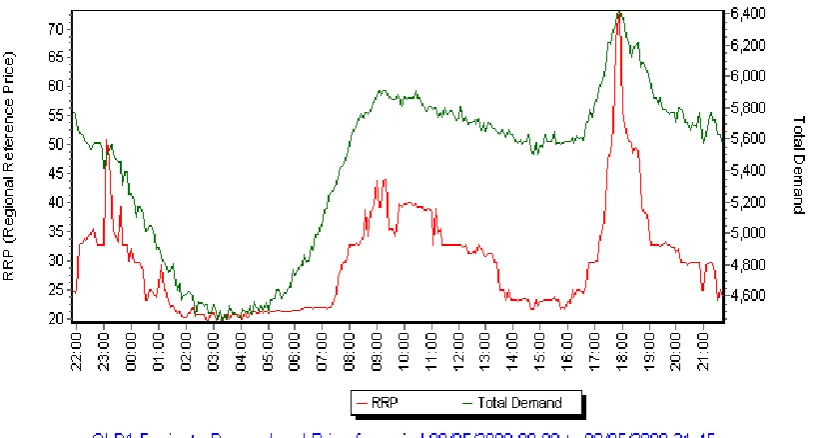
In analyzing the electricity demand-costs relationship, the following chart supplied by the
Figure 3.3: Electricity Demand and Cost, Queensland, (AEMO, 2009b)
Figure 3.3 shows the demand and costs of electricity in Queensland recorded by AEMO (was
known as NEMCO) during the period (8/5/2009 12 am to 9/5/2009 21:45 pm). The figure
illustrates clearly how electricity demands changes. Although the price curve follows the
demand curve closely, power generators used to provide base load power which are used
twenty-four hours per day are far cheaper than the most expensive plant such as gas turbines
which are used only to supply peak load power, usually three to four hours a day. There are
two major peak demands at day time from 9 AM to 14 PM and evenings from 17 to 20 PM
when prices usually rise. However, residential electricity customers are not affected by varied
electricity pricing because they usually pay a fixed price regardless of the time of day
(Kamel, 2009b).
Figure 3.4 extracted from data of the AEMO (2009), illustrates the curve of electricity
demand supplied in Queensland during 2008. The figure indicates mainly the fact that when
the load is above the base load of about 4100 MW, the extent of their duration will be less
(Kamel & Kist, 2009). Power stations which generate Base load are those operated twenty
possible energy price. Other power plants operated for shorter periods i.e. less than 10% a
year providing thus higher energy prices will cover higher loads. This implies that the higher
the peak demand is, the higher the energy price will be. Although peak demands occur for
short periods per year, significant high energy generation cost due to a reduced plant capacity
[image:32.595.75.525.224.496.2]factor (PCF) occur (Kamel, 2009).
Figure 3.4 Electricity demand in Queensland in 2008, data extracted from the Australian Energy Market Operator AEMO (2009) (Kamel & Kist, 2009).
Figure 3.5 extracted from data of the AEMO (2009), illustrates the regional reference
wholesale price RRP in Queensland during the year 2008. The figure illustrates that at more
than 80% a year low-priced supplies are taking place, while high prices happen at lower
occurrences. For example, prices of around AUD $20/MWh are occurring at about 80 % of
the year, while prices of over $50/MWh have occurred at less than 10 % (Kamel & Kist,
Figure 3.5 Frequency of occurrence of electricity wholesale price RRP in Queensland year 2008, data extracted from the Australian Energy Market Operator AEMO (2009) (Kamel & Kist, 2009).
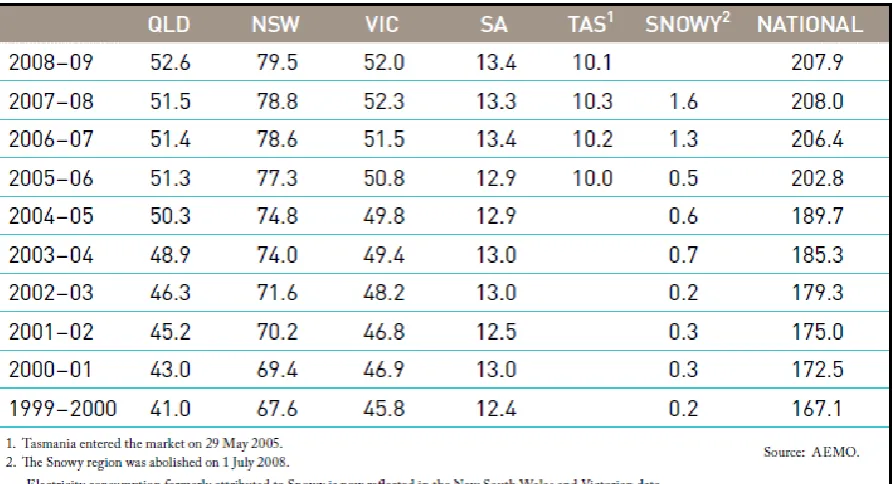
Table 3.2 illustrates the annual electricity consumption across the NEM since 1999-2000.
Table 3.2 shows thatbNew South Wales, due to its high population base, has the highest
electricity consumption then Queensland and Victoria. In the less populated regions of South
Australia and Tasmania, demand is considerably lower.
An increase from 170 TWh in 1999-2000 to 208 TWh in 2008-09 occurred in the annual
consumption of electricity of the NEM (figure 3.6). The entry of Tasmania in 2005 in the
NEM accounted for 10 TWh. Demand levels fluctuate throughout the year, with peaks
occurring in summer (for air conditioning) and winter (for heating) due to temperature.
Figure 3.7 illustrates the national increase in seasonal peaks from around 26 gigawatts (GW)
in 1999 to over 35 GW in 2009 (AER, 2009). Due to variations in weather conditions from
year to year, there is volatility in the summer peak’s prices.
Figure 3.7 National Electricity Market peak demand (AER, 2009)
In order to meet the demand at lowest possible cost, AEMO list the offer bids of all
generators in ascending price order for each 5 minute dispatch period. That is, the cheapest
generator bids are dispatched first, then progressively more expensive offers are dispatched
till meeting the required demand. A 5 minute interval dispatch price is the highest priced
megawatt (MW) of generation dispatched to meet demand. For example, figure 3.8 illustrates
that to meet the level of the demand for electricity at 4.15 with 350 MW, generators 1, 2 and
3 are fully dispatched and generator 4 is partly dispatched. $37 per MWh is the dispatch
price. When the demand reaches 4.20, a higher cost generator is required to be dispatched;
therefore, a higher offer price of $38 per MWh is reached. Therefore, increase in demand
Figure 3.8 Illustrative generator offers (megawatts) at various prices, (AER, 2009)
Average of the 5 minute dispatch prices is the wholesale spot price for each half hour period
(trading interval). Figure 3.8 illustrates that $37 per MWh is the spot price in the 4.00-4.30
interval. All generators receive this price for their supply during this 30 minute period, and
market customers pay this price for the electricity they use in this period. However, due to the
physical losses in the transport of electricity over distances and transmission congestion, a
separate spot price is determined for each region.
The Daily Load Curves for South Australia and New South Wales for Tuesday, December 9,
2008, in a normal working day, are shown in Figure 3.9. The scales for New South Wales and
South Australia differ; the maximum demand for South Australia is just over 1800 megawatts
(MW) at about 4.30 p.m., while for New South Wales the maximum demand is 11,000 MW
Figure 3.9 Daily Load Curves for South Australia and New South Wales for Tuesday, December 9, 2008, (Evans & Quirk, 2009)
The minimum demand for South Australia was 1150 MW between 3 a.m. and 6 a.m., 64 per
cent of the maximum demand. For New South Wales, minimum demand was 6500 MW
between 3 a.m. and 4 a.m., 59 per cent of maximum demand.
The regional reference price (whole-sale) curve is shown in Figure 3.10. As it is explained by
the Daily Load Curve, the generating station system has to cope with consumers’ electricity
demand changes. The elevated electricity demand during the day reaching a critical demand
peak requires electricity suppliers to run the cheapest generators to provide the base load
power during the whole day while the critical increase in demand which takes about three to
four hours during the day requires the most expensive generators such as gas turbines.
Although the variation in price during the day was between $14 and $42 per MWh, peak hour
prices can become much higher than the based load price, often over $100 per MWh Evans &
Figure 3.10 Electricity wholesale Price Curves for South Australia and New South Wales for Tuesday, December 9, 2008, (Evans & Quirk, 2009)
The analysis of the above charts illustrates that increased electricity demands is causing
increase in energy production costs. Furthermore, the operation of more generating capacity
is associated with more environmental impacts.
In order to understand the impacts of electricity demand-costs and their impacts on the
markets, the market situation should be analyzed as well. The following section presents
3.3 Critical market situations
There have been critical incidences which occurred in the electricity demand-supply market
leading to severe adverse impacts on the stability and quality of electricity supply. For
example, increased energy generating cost, increased prices and inability to meet electricity
demand are consequences of increased electricity demand. Figure 3.11 shows an example of
the daily spot in electricity prices for Queensland market in the period from 13th of December
1998 till the 30th of June 2001(Worthington et al., 2005). The graph shows that there are
numerous fluctuation of prices reaching the highest recorded value which exceeds 1000
$/MWh.
[image:39.595.77.506.370.593.2]
Figure 3.12 also continue to show the daily spot in electricity prices for Queensland market in
the period from first of January 1998 till 31 of December 2004.
Figure 3.12 Daily spot electricity prices for QLD market ($/MWh), 1/1/1999 – 31/12/2004 (Higgs, 2006)
Figure 3.13 illustrates electricity prices, during the year 2008, exceeding at times $500/MWh
Figure 3.13 Fluctuation of electricity prices in Queensland, data extracted from the Australian Energy Market Operator AEMO (Kamel & kist, 2009)
The weekly average whole-sale prices of electricity in Queensland in the period (1998 to July
2007) are shown in figure 3.14 (DME, 2007b).
The volatility of wholesale electricity prices are experienced in the same way in both
Queensland and across eastern Australia. This could be further explained in figure 3.15 which
indicates the weekly average whole-sale prices in Queensland in 2007 (to July) and the long
run average price. Prices in 2007 tended to be higher than the long-run average price (DME,
[image:42.595.74.540.222.490.2]2007b).
Figure 3.15 Queensland Average Weekly Pool Prices (January to July, 2007) (DME, 2007b)
The increase in average whole-sale prices is mainly caused by the impact of the prolonged
drought on generation capacity across the National Electricity Market. Droughts which
occurred in areas such as the Snowy region of New South Wales and Victoria, and in
south-east Queensland made some of the largest generators in the market to be operating at reduced
capacity levels in the first half of 2007 (DME, 2007b). Because of the increased level of
water in south-east Queensland due to the rainfall in January and February, water is no longer
a critical issue for electricity supply. Therefore, the pool price for 2008 (to date) is less than
Figure 3.16 Queensland Yearly Average Pool Price 1998-2008
In the following figure 3.17, a recent incident of high energy cost was experienced by
Queensland region on 7 February 2008 due to an error in scheduling while managing a
The following figure 3.17 shows the dispatch interval and trading interval energy prices.
Figure 3.17 Energy Dispatch Prices in the NEM ($/MWh) (NEMMCO 2008b)
More details also shown in table 3.3 below;
Trading Interval Trading Price ($/MWh)
Date Time
7/02/2008 14:30 232.84
7/02/2008 15:00 1094.11
7/02/2008 15:30 896.88
7/02/2008 16:00 98.39
7/02/2008 16:30 6622.24
7/02/2008 17:00 32.76
Table 3.3 Trading Interval Energy Prices (NEMMCO 2008b)
From the graph and the above table, it can be clearly noticed that the maximum significant
energy prices is $6622.24/MWh for the trading interval ending 16:30hrs and the average
price for the day was $215.98/MWh.
The conditions which resulted in the significant increase in Queensland energy prices can be
summarized according to NEMMCO (2008b) as following:
Tight supply/demand situation in Queensland;
Invocation of a shoulder season constraint equation to manage a line reclassification
which bound and constrained off most Queensland generators.
3.4 Peak Demand Impacts
Electricity peak demand has serious negative impacts on both electricity aspects and other
consumers’ life. Those negative impacts lead to other deficiencies in electricity generation,
transmission and distribution. The negative impacts of the sudden severe variable change in
electricity demand include inconsistency in the electric power system and instability of the
grid. The main three areas which are affected by electricity peak demand include technical
impacts, environmental impacts and economical impacts. One of the main goals of the project
is to adequately manage electricity peak demands to reduce the negative impacts including
the uncertainties of the system, increase grid reliability, reduce energy cost, and optimize
energy consumption.
3.4.1 Technical impacts
Reliability
Electricity reliability involves the capacity of the electricity generation to supply the required
total electricity demand to consumers at any given time (adequacy) and to withstand sudden
disturbances (security). That is, reliability is the ability to avoid power outrages. In order to
maintain reliability of electricity system, adequate electricity generation, transmission
infrastructure and effective management of the power system are essential (Berrie & IEE,
The main reasons that maximize the performance of the electricity infrastructure at the three
stages of electricity delivery include a reasonable and moderate demand of electricity. That
is, while the increased electricity demand leads to deficiencies in power generators at the long
term period, it affects the capacity and efficiency of the electricity supply making the
reliability of electricity delivery weaker and slower.
Efficiency
Efficiency of power generating stations at all levels of generators, connecting system,
transmission, distribution, protection and maintenance is highly impacted by the increased
electricity demand. Increased electricity demand oblige power generating station to run the
generators on overloaded mode which in turn increases its maintenance, reduces efficiency
and decrease life expectancy range of equipments. However, it becomes worse when the
increased electricity demand occurs during the increasing summer heat which has more
negative impacts on the entire electricity system (Berrie & IEE, 1992).
3.4.2 Economical and Social impacts
While the least expensive power plants (such as coal at the moment) are used to cover the
continuous (8760 h/year) base load (Gilau & Small, 2008), the most expensive-to-run power
plants will be used to cover peak demand. Although electricity consumers do not have direct
correlation with the use of most expensive-to-run power plants, generators add the increased
generation costs to the whole sale prices of electricity, which increase consumers bills.
Because of the electricity peak demand, electricity consumers pay a significant (and largely
unseen) price for the suppliers’ costs for building sufficient electricity generation and
networks to meet the short peaks in physical electricity demand, which can occur for only a
insulated from price volatility by ‘flat’ electricity prices, they are also paying a significant
and undisclosed (hard to evaluate) premium in their retail electricity prices to cover the retail
supplier’s costs of managing the risks of the extreme price volatility (Fraser, 2005).
The negative impacts of the electricity peak demand extend to affect the entire infrastructure
of the electricity system including transmission and distribution and delivery. For example,
more than 5% of the network infrastructure is only used for 0.2% of the time and this
under-utilised capital investment in the network is paid for by all consumers, whether they ever use
it or not, due to the nature of retail energy contracts and network charges (Fraser, 2005;
Kamel, 2009).
3.4.3 Environmental impacts
Many detrimental environmental impacts are experienced because of the fossil fuel fired
power stations. There are many greenhouses gas emissions taking place because of using
fossil fuel for generating electricity. The main cause of such emissions are caused e.g. by coal
whether in the stage of mining, transportation or burning involves its poor efficiency which
causes the waste of energy and the need to dispose of the wastes (Healey, 2009). That is, for
every unit of energy produced as electricity, about two units of energy are produced as heat
and must be dispersed in some way. So, huge amounts of waste heat are emitted either into
the atmosphere or into water; however, in the case of Callide B, evaporative cooling towers
are used with the water vapour heating the atmosphere (IPPC, 2001). According to (Keating,
2001), one of the dirtiest fuels in the world which is used to operate power stations is coal.
With the increasing demand for electricity in Australia, electricity industry was required to
increase electricity supply to meet the increasing needs. Different and numerous toxic
cleaning, from transportation to electricity generation to disposal (FSCETF, 1994; Lyster &
Bradbrook, 2006). Callide B power station in Queensland, for example, which is operated by
coal, burns about 2.2 million tons of coal a year. The negative impacts of coal use in power
station include health problems such as cancer, impairing reproduction and the normal
development of children, and damaging the nervous and immune systems and damaging the
environmental ecosystem (Fanchi et al., 2005).
3.5 Related researches and applications
The majority of the previous studies investigated how to reduce peak demands focused on
reducing the consumers load without considering the actual state load profile. That is, this
was normally achieved either by attempting to encourage the end users to achieve general
energy conservation or through the implementation of different tariffs.
There were also great efforts in producing electrical equipment with high energy saving
techniques in the manufacturing sectors. For instance, high energy saving lamps,
air-conditioning temperature thermostats, timer controlled-machines and etc have been
introduced and used in the manufacturing sectors. However, that is not all, other studies
moved towards building management system (BMS) in which the whole energy consumption
is automatically observed and controlled (APC, 2005).
In the industrial sector, some agreements have been established between the utilities and
users which benefits both parties. For instance, when the factory is working on limiting its
load to certain kilowatt per hours a day for agreed rewards or bill reduction from the utility,
both parties will benefit. In order to accomplish such conditions and agreements, the
development of smart switches and smart meters are required (Adilov et al., 2004). The main
during periods of peak demand and higher electricity prices, allow consumers to pre-pay for
electricity and giving another dimension of control for consumers (Rassenti et al., 2008).
In the residential sector, reducing and controlling electricity demand is achieved through
implementing real time pricing strategies. Smart meters provide consumers with options of
lower prices during off-peak periods and higher prices during peak periods making electricity
prices impacting purchase decisions (Frew, 2006a). With real-time pricing and time-of-use
tariffs where the electricity prices vary with time, the users tend to reduce their usage at times
when electricity prices are relatively high (Adilov et al., 2004). Communication between
utilities and consumers would enable consumers to be alerted of the different demand prices.
Consumers will receive from suppliers an alert on any day the real-time price that day
reaches or exceeds. Consumers are given the option to run their appliances such as air
conditioners, laundry machines and dishwashers in those low-priced hours like evenings,
nights and weekends which would save them money on their electricity bills. Therefore,
when consumers use electricity when the demand and prices are low, they will save on their
electricity bills with real time pricing (Wilson, 2006).
One of the previous studies which have a similar objective to reduce the overall demand of an
entire state aiming to achieve cheaper electricity was conducted in the USA (Huber, 2008).
The main premises of the study is based on that the price of electricity sold in wholesale
markets tracks the rising and falling demand in the area in consideration. According to
(Huber, 2008; figure 3.18), in the USA, demand moves from east to west with the sun
because it tracks human activity and afternoon peaks in air-conditioning loads because
weather and seasons raise and lower the temperature. Somewhere in America, some
community is always paying significantly more for power -20 to 50 percent- more than the
that determine where costs are high and where they’re low. In order to achieve almost a fixed
daily supply without the fluctuations and shifts in daily demand and supply, the whole
suppliers in the USA got to be solidly connected by one network.
Figure 3.18 peak and off-peak wholesale spot prices in different time zones of USA (2007), (Huber, 2008)
Queensland Solar City project in magnetic island, for example, is one of the significant
projects which integrates energy conservation and demand management and offer customers
a choice of power sources and tariffs options. Queensland government designated 5 million
dollars to support the delivery of the Ergon Energy ltd (Foulger, 2008). Involved in the
project is the installation of about 500 solar photovoltaic (PV) systems, 2500 smart meters
and around 1700 energy audits. It is predicted to conserve energy and minimize greenhouse
gas emissions by approximately 50,000 tonnes CO2 annually by 2013 (OCE, 2009).
Constructing the solar energy project in magnetic island will transform the island into a Solar
Suburb demonstrating an integrated approach to conserving energy to achieve a localized
reduction in electricity demand. The other significant objectives of the project is increasing
the awareness of Queenslanders to work together, embrace solar energy and become more
energy efficient to achieve positive energy and environmental outcomes for their community
wider-scale initiatives in Queensland and across Australia.
Another project called solar schools project will achieve reduction in the electricity demand,
particularly electricity generated using coal by installing solar panels and energy efficient
light bulbs at 1251 Queensland state schools more over three years (OCE, 2009). A part of a
sixty million USD package has been designated for installing circuit-timers to turn off night
non-essential power and installation of ‘smart meters’ that control energy use. Therefore,
every year, each school system will minimize greenhouse gas emissions such as CO2 by
more than 3.2 tones, which is the equivalent of 64 000 black balloons each of which weigh 50
grams of greenhouse gas (Foulger, 2008). Besides expanding the solar system industry and
usage, this project will increase the awareness of young people about energy conservation
Chapter 4
ELECTRICTY MARKET IN QUEENSLAND
The scheme devised by the project is intrinsically interrelated with the numerous variables of
electricity market including electricity pricing, supply, demand, investment and consumption.
Therefore, analysis and investigating the electricity market variables are crucial element for
the implementation of this project. Given that the project is designed to be implemented in
Queensland, variables of Queensland electricity market are analyzed. The market variables
are also interrelated with the different electricity marketing stages starting from electricity
generation at the power station to the end user’s consumption and demand. For example,
setting electricity pricing takes into consideration four types of costs incurred at the stage of
generating electricity, establishing and maintaining the state's extensive high voltage power
line infrastructure, building and maintaining the state's network of poles and lines that deliver
electricity to customers, billing customers and managing accounts (Docwra et al., 1991;
DME, 2007b). In other words, those costs could be categorized into four types; generation,
transmission, distribution and retailing costs.
Therefore, in the following sections, analysis of the Queensland electricity market in terms of
electricity generation, transmission, distribution and management and their relation to
demand and consumption which are highly beneficial for implementing the project scheme
will be discussed.
4.1 Stages of electricity delivery in QLD
Electricity generation, transmission and distribution are the three main stages performed to
deliver electricity to all types of customers. Generation is performed at a power station then
passed through a transformer to increase the voltage, which minimizes losses during
transportation. Transportation is carried out through a transmission networks. Then the
voltage is reduced in several steps as it passes through a series of transformers until it reaches
240 volts for household use. The medium and lower voltage networks are called distribution
networks. At every stage, different amount of costs which are affected by demand and
consumption are incurred and considered in setting electricity market pricing. For example,
Queensland investment in generation, transmission has increased with its rapid economic and
population growth which leads to increased consumption of electricity (DEEDI, 2009; DME,
2009c).
In Queensland, the companies owning and operating the different stages of electricity
delivery are illustrated in figure 4.1. For example, companies such as CS Energy, Stanwell
Corporation and Tarong Energy own and operate the power stations. Powerlink is the only
transmission company, which owns and operates high-voltage power lines from power
stations to distribution companies and other large electricity users. Distribution companies
include Ergon Energy and ENERGEX. Retail companies which are responsible for purchase
of the electricity from generators, receiving electricity from distributors and selling it to
consumers include Sun Retail and Ergon Energy Retail (Phunnarungsi & Dixon, 2003). In the
following part, analysis of the three stages carried out to deliver electricity in QLD will be
Figure 4.1 Electricity delivery chain in QLD.
4.1.1 Generation
Coal-fired power stations which are located in central and northern parts of Queensland and
are owned by Government Owned Corporations (GOC) are the main power stations used for
electricity generation in the state (DME, 2009c).
While the number of gas-fired power stations is increasing, Queensland is being developing
also renewable energy, such as hydro, wind and biomass which are currently being used to
generate electricity in the state. The electricity generation capacity of Queensland is more
than 10,000 megawatts (MW) (DME, 2009c; QG, 2008). This investment in Queensland is
because of the high quality and low cost of Queensland fuel sources, and their proximity to
While most of power stations in Queensland are owned and operated by Government Owned
Corporations (GOC), private corporations operate and own a few numbers of power stations.
Some details about these generators are as follow:
CS Energy
One of the Queensland Government-owned electricity generators is CS Energy which is
operated using a diverse mix of fuels to operate more than 3,000 megawatts of electricity
generating plant to supply the national electricity market (ESQ, 2009; DME, 2008). There are
a large number of power stations which are operated by the CS Energy such as:
Swanbank Power Station (south east Queensland)
Callide Power Station (central Queensland)
Mica Creek Power Station (north west Queensland)
Kogan Creek Power Station (south west Queensland)
Stanwell Corporation
Queensland Government owns and operates Stanwell electricity generator which generates
more than 1,500 megawatts of electricity from thermal and hydro fired facilities located
throughout Queensland. Stanwell Power Station is the largest Stanwell's operating sites
which generates around of 1,400 megawatts (ESQ, 2009; DME, 2008). However, there are
other sites by Stanwell such as:
Stanwell Power Station (22 kilometres west of Rockhampton)
Barron Gorge Hydro, Kareeya Hydro and Koombooloomba Hydro - (far north
Queensland)
Wivenhoe Hydro (south east Queensland)
Tarong Energy Corporation
There are a number of generating assets operated and owned by Tarong Energy Corporation.
For example, Tarong Power Station generates capacity of 1400 megawatts which is
considered one of Queensland’s largest power stations. Next to Tarong station is a single 445
megawatt advanced cycle coal-fired unit (ESQ, 2009). Wivenhoe Power Station generates
500 megawatt and is considered Tarong Energy's pumped storage hydroelectric plant.
Moreover, Tarong energy owns the Meandu Mine and Kunioon coal resource which will fuel
the power stations into the future (DME, 2008).
NRG Gladstone Operating Services (NRGGOS)
One of the largest power stations in Queensland is Gladstone Power Station which
contributes 1,680 megawatts capacity to the State grid. The power station is located five
kilometres north-west of Gladstone, and sells around 60% of the station's output to Boyne
Smelters under a long term contract. NRG Gladstone Operating Services has been operating
the station since 1994 on behalf of Joint Venture participants Rio Tinto Ltd (42.125%), NRG
Energy Inc (37.5%), SLMA GPS Pty Ltd (8.50%), Ryowa II GPS Pty Ltd (7.125%) and
YKK GPS (Queensland) Pty Ltd (4.75%) (ESQ, 2009; DME, 2008).
Fueling Queensland's electricity supply
Despite developing Queensland state's energy mix towards a greater use of renewables and
gas, approximately 88 percent of Queensland's electricity generation is still carried out by
Queensland’s high-quality, low-priced black coal. For example, renewable sources fired
stations in Queensland include 12 megawatt (MW) Windy Hill (wind) project and the
fired generation and electricity generated from renewable sources accounted for
approximately 12 per cent of Queensland's electricity generation. Moreover, QLD has had the
greatest level of investment in committed generation of about 3,500 megawatts of generation
capacity, since the creation of the National Electricity Market in 1998 (ESQ, 2009; DME,
2008c).
In Queensland the Gas-fired power generation capacity is over 2000 megawatts. Increased
private investment for gas-fired generation electricity retailers and other large electricity
users in Queensland must source at least 13 percent of their electricity from gas-fired
generation (DME, 2009c).
4.1.2 Transmission
Transmission of electricity in Queensland is mainly managed by a Government Owned
Corporation called Powerlink Queensland. The main roles of Powerlink include managing
more than 12,000 kilometres of Queensland's high voltage transmission network, transporting
electricity from the generators to the distribution networks and directly to large customers
such as aluminium smelters. Most of the power stations in the east coast network are directly
connected to the Queensland transmission system (DME 2009b).
Queensland Electricity Transmission Corporation Limited was established in 1995 through a
process of functional separation and corporatization of the electricity industry in Queensland.
The main responsibilities of the company include the delivery of a secure and reliable
transmission service to electricity market participants, providing services to the Australian
Energy Market Operator (AEMO) and providing metering at generation and
customer/distribution connection points. Other responsibilities of Powerlink include