This is a repository copy of
Optimal planning of distribution grids considering active power
curtailment and reactive power control
.
White Rose Research Online URL for this paper:
http://eprints.whiterose.ac.uk/108791/
Version: Accepted Version
Proceedings Paper:
Karagiannopoulos, S, Aristidou, P orcid.org/0000-0003-4429-0225, Ulbig, A et al. (2 more
authors) (2016) Optimal planning of distribution grids considering active power curtailment
and reactive power control. In: Power and Energy Society General Meeting (PESGM),
2016. 2016 IEEE Power and Energy Society General Meeting (PESGM), 17-21 Jul 2016,
Boston, MA, USA. IEEE , pp. 1-5. ISBN 978-1-5090-4168-8
https://doi.org/10.1109/PESGM.2016.7741538
© 2016 IEEE. Personal use of this material is permitted. Permission from IEEE must be
obtained for all other uses, in any current or future media, including reprinting/republishing
this material for advertising or promotional purposes, creating new collective works, for
resale or redistribution to servers or lists, or reuse of any copyrighted component of this
work in other works.
[email protected] https://eprints.whiterose.ac.uk/
Reuse
Unless indicated otherwise, fulltext items are protected by copyright with all rights reserved. The copyright exception in section 29 of the Copyright, Designs and Patents Act 1988 allows the making of a single copy solely for the purpose of non-commercial research or private study within the limits of fair dealing. The publisher or other rights-holder may allow further reproduction and re-use of this version - refer to the White Rose Research Online record for this item. Where records identify the publisher as the copyright holder, users can verify any specific terms of use on the publisher’s website.
Takedown
If you consider content in White Rose Research Online to be in breach of UK law, please notify us by
©2016
IEEE
.
Personal use of this material is permitted. However, permission to reprint/republish this
material for advertising or promotional purposes or for creating new collective works for
resale or redistribution to servers or lists, or to reuse any copyrighted component of this
work in other works must be obtained from the IEEE.
Optimal planning of distribution grids considering
active power curtailment and reactive power control
Stavros Karagiannopoulos, Petros Aristidou, Andreas Ulbig, Stephan Koch, Gabriela Hug
EEH - Power Systems Laboratory, ETH Zurich, Physikstrasse 3, 8092 Zurich, SwitzerlandE-mail:{karagiannopoulos, aristidou, ulbig, koch, hug}@eeh.ee.ethz.ch
Abstract—In this paper, a new planning methodology is pro-posed for existing distribution grids, considering both passive and active network measures. The method is designed to be tractable for large grids of any type, e.g., meshed or radial. It can be used as a decision-making tool by distribution system operators which need to decide whether to invest in new hardware, such as new lines and transformers, or to initiate control measures influencing the operational costs. In this paper, active power curtailment and reactive power control are taken into account as measures to prevent unacceptable voltage rises as well as element overloads, as these allow postponing network investments.
A low-voltage, meshed grid with 27 nodes is used to demon-strate the proposed scheme. In this particular case, the results show that by using control measures, an active distribution system operator can defer investments and operate the existing infrastructure more efficiently. The methodology is able to account for variations in operational and investment costs coming from regulatory influences to provide an insight to the most cost-efficient decision.
Index Terms—distribution grid planning, distributed energy resources, curtailment, reactive control, optimal power flow
I. INTRODUCTION
Traditionally, distribution grids have been dimensioned based on a ‘fit-and-forget’ approach. Based on their experi-ence, planning engineers size distribution grids considering historical data, as well as forecasts regarding load growth, installation of Distributed Energy Resources (DERs) and land development plans. The main goal is to dimension grids to withstand worst-case scenarios in terms of element loadings, voltage drops and other security margins. For such analyses, deterministic worst-case system snapshots are used as a basis which has proven to be rather conservative and inefficient.
Additionally, over the last years the composition of the generation mix has been changing dramatically, with a plethora of DERs located at Medium Voltage (MV) and Low Voltage (LV) distribution levels. The installation of a large share of DERs as well as the introduction of new load types, such as electric vehicles, pose new threats and challenges to modern electric power systems. For instance, wind and solar PhotoVoltaic (PV) power in-feed may lead to reverse power flows when generation exceeds demand locally. At the same time, new opportunities arise by having more observable and controllable distribution networks, raising the need to rethink the distribution system planning procedure.
Active control measures, such as coordinated dispatch of DERs, flexible loads, demand response or energy storage systems are generally thought to be more relevant for the
operation stage. However, their existence influences the avail-able alternatives to increase the hosting capacity of the grid, e.g. current rules in Germany [1] that allow curtailing the PV injections in steps can be considered in the planning phase and postpone grid reinforcements. Therefore, such considerations in the planning procedure may lead to more cost-efficient solutions, deferring grid expansion [2]. In this way, a trade-off between installing new hardware, e.g. lines or transformers, and initiating active applications, e.g. peak shaving through flexible loads, can be evaluated based on different criteria, such as total costs or reliability targets.
Optimal planning of distribution grids has been the subject of several studies in the literature. In most, the focus is solely on optimal placement of new DERs in distribution grids. For example, [3], [4] provide overviews on optimal placement of Distributed Generators (DGs), under different objectives and optimization techniques. Recent publications address the need to include also active distribution grid tools into the planning stage [5], [6]. In [5], the authors analyze classic and new smart grid planning techniques, with the use of controllable loads, storage and electric vehicles, while [6] discusses challenges and possibilities of the future planning problem.
However, neither of [4]–[6] provides a systematic method to assist Distribution System Operators (DSOs) to decide between the use of active applications or traditional network expansion techniques. Reference [2] comprises a comprehen-sive analysis for the transition towards active distribution grids. The proposed methods are based on probabilistic load flows and only active network schemes are integrated into as an Optimal Power Flow (OPF) problem.
In this paper, a methodology is proposed for optimal plan-ning of distribution grids considering both traditional grid extension as well as active control schemes. The methodology is applicable for large distribution systems irrespective of their type, e.g. meshed or radial. It can be used as a decision tool for regulated DSOs, which are assumed to have no influence on the location of new DER units.
The remainder of the paper is organized as follows: in Sec-tionIIthe proposed method is presented and all the necessary data and assumptions are described. Section III introduces the considered case study and presents the simulation results. Finally conclusions are drawn in SectionIV.
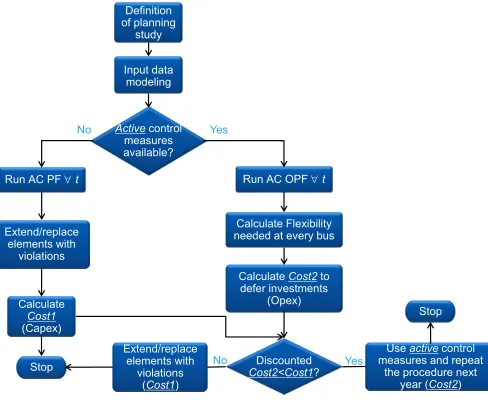
II. METHODOLOGY
Input data modeling Definition of planning
study
No Activecontrol measures available?
Stop Extend/replace
elements with violations
Run AC PF t
Calculate Cost1 (Capex)
Yes
Run AC OPF t
Calculate Flexibility needed at every bus
Calculate Cost2to
defer investments (Opex)
Discounted Cost2<Cost1? Yes
No measures and repeat Use activecontrol
the procedure next
year (Cost2)
Extend/replace elements with violations
(Cost1)
[image:4.612.52.296.50.250.2]Stop
Fig. 1. Proposed flowchart for planning active distribution systems
the study defines all the different data needed in order to explore the available planning alternatives. If active control measures are not available, the DSO is forced to increase the hosting capacity by installing new lines, transformers, etc. On the contrary, if active control schemes are available, a DSO can assess the trade-offs between deferring investments and increasing operational costs. In the first case, a passive DSO identifies the elements that could be overloaded and invests in new equipment to avoid constraint violations. In the latter case, an active DSO compares the operational costs from the available control measures with the costs of the first case, and chooses the most cost-efficient option.
A. Definition of planning study and data acquisition
The general framework of the planning study needs to be defined first. Here, the DSO decides on the planning horizon (thor in years), and collects all relevant data in order to
per-form its analysis. In the past, inper-formation regarding load and conventional generation growth was adequate, but for modern grids, this stage is more complicated. The production from DGs depends on weather data with a strong spatial correlation and shows a stochastic behavior. Apart from weather data, information concerning urban and rural development, future customer load and generation installation plans, as well as regulatory aspects are of interest.
B. Input data modeling
After all time-series data have been collected, they are converted into power quantities so as to be used in the analysis.
1) Generation data: In this work, only PVs and wind turbines are considered. Thus, to simulate the production from DGs, wind speed, solar radiation and temperature data are needed. The conversion into power quantities can be achieved by using simple formulas/models as in [7]. That is, the per unit power that can be extracted from the wind is given by
Pw=
1
2 ·ρ·A·V 3
·Cp , (1)
where ρ is the air density (mkg3), A is the wind turbine intercepting area (m2
),V is the wind speed (ms), andCp is a power coefficient. The output from solar PVs equipped with maximum power point trackers is given by,
Ppv=Ppv,r·D·
G Gstc
[1 +αp(Tc−Tc,stc)], (2)
where Ppv,r is the rated PV capacity (kW), D is a derating factor to account for dust, high temperature, shading, snow cover, aging and wiring losses (%), G is the solar radiation incident on the PV array (kW/m2
), Gstc= 1 kW/m2 is the incident radiation at standard conditions,αpis the temperature coefficient of power (%/◦C),Tcis the cell temperature (◦C),
andTc,stcis the temperature under standard conditions (25◦C). An alternative way to estimate future DG production poten-tial is to use external sources directly, e.g. [8] for PVs. This is a GIS-application which identifies the solar potential on roofs with an area larger than 14 m2
.
2) Consumption data: There are numerous ways to cope with load growth projections. Normally, a fixed annual load increase is assumed. However, the modeling of the demand from individual loads is not a straightforward task. Until recently, there were no detailed measurements in LV grids and usually, only the maximum yearly aggregated demand in the MV/LV transformer was measured. In such a case, the disaggregation to individual households can be based on the yearly maximum load of the MV/LV, the number of households connected to each bus, scaling factors to account for future increase in demand and population density in the interested area [9].
When detailed measurements from smart meters are avail-able, another approach would be to cluster different types of loads (residential, industrial, commercial) and create averaged profiles per category.
3) Time component: The classic planning approach does not consider the time dimension. However, the latter is a crucial characteristic of the emerging smart-grid technologies that impose intertemporal constraints. Units with a cyclic op-erational pattern, e.g. storage systems, impose a time coupling over a certain time period which needs to be taken into account. Thus, these operational aspects should be included in the planning stage. In this paper however, such time-coupling components are not considered. They will be included in a future extension of the methodology using a multi-period OPF problem formulation.
The time variability can be captured by performing a time-series analysis. For instance, yearly simulations can account for both the worst case conditions identifying overloaded elements, as well as for normal conditions which influence the operating costs. In case yearly simulations lead to intractable computational time, another approach is to use seasonal rep-resentative and worst-case days [9].
C. Available control measures
active distribution measures and designing new tariffs schemes to face modern grid challenges (active DSOs).
A passive DSO is interested in identifying which parts of the system will be overloaded within the planning horizon and reinforce them at a certain cost. An active DSO, on the other hand, can compare this cost against operational costs coming from a more efficient use of the existing grid.
1) Passive DSO: To achieve its goal, the DSO can calculate the loading of all elements and the voltage of all buses by running simple AC power flows for every time interval. The calculation of the AC power flows can be performed by different software platforms, such as [10]. In case of network violations, the DSO decides on the installation of new equip-ment to prevent them, be it new lines, cables or transformers. The new equipment leads to a capital expenditure that needs to be invested by the DSO (Cost1).
2) Active DSO: An active DSO aims at a more efficient use of the existent infrastructure. By using AC Optimal Power Flow (AC OPF) calculations, costly network investments can be deferred. However, the use of the available control actions is associated with operational costs. The objective is to minimize these cost through the formulation of the objective function:
min
u c T
u (3)
where vector c represents operational costs associated with the activated control measures vector u. These actions might involve changing the active/reactive output of DGs, activating some flexible loads, or modifying the behavior of storage units. Moreover, a two-way communication infrastructure is needed between the various controllers and the DSO to im-plement these active measures. Communication links inside LV grids are slowly emerging, as more and more smart devices, e.g. smart meters and controllable PV and battery inverters, are being installed. In this paper, we assume perfect communication, i.e. no delays or communication failures.
The OPF formulation includes the power balance equations at every node as given by
Pinj=Pg−Pl Qinj=Qg−Ql, (4)
wherePg andQg are the active and reactive power infeeds of the DGs,Pl andQl the active and reactive node demand and
Pinj,Qinj the net node injections. An active DSO can control the DG and flexible load powers. The voltage constraints at every node are given by
Vmin≤Vi≤Vmax (5)
where Vmin and Vmax are the upper and lower acceptable voltage limits. Similarly, the thermal limits of the power lines are imposed by
0≤Si,j≤Si,jmax (6)
where Si,j is the apparent power flowing through the line connecting nodes i and j, and Si,j
max
the value correspondingtoits upperthermallimit.
Furthermore, the DG limits are given by
Pmin
g ≤Pg≤Pgmax Q min
g ≤Qg≤Qmaxg (7)
where Pmin
g , Qming , Pgmax and Qmaxg are the upper and lower limits for active and reactive generation. These limits vary depending on the type of the DG and the control schemes implemented. For renewable DGs,Pmax
g is limited by the max-imum power they can produce as described in Section II-B. Moreover, it is usual for small inverter-based generators to have limitations on the power factor they can operate at. These limitations are either technical or defined in the grid codes. In this case, the reactive power limit of (7) is modified to
−tan(φmax)·Pg≤Qg≤tan(φmax)·Pg (8)
where cosφmaxis the maximum power factor.
Finally, in the case of a renewable DG without any control working at unit power factor, the constraints become
Pg=Pgmax Qg= 0 (9)
D. Active control measures considered
1) Reactive Power Control (RPC): Depending on the grid characteristics, such as the X/R ratio, reactive power can be useful to address both voltage and line overload issues. Different rules are found in grid codes regarding RPC. The most prominent are power factor control as a function of active power (cosφ(P)) and reactive power control as a function of voltage (Q(V)) [11]. However, these local controls only consider voltage at the DG terminal and cannot account for other network constraints and transformer overload.
An active DSO can perform centralized RPC to achieve an optimal grid operation. The DSO can increase the reactive power consumption to reduce the bus voltage. Additionally, the DSO can control the reactive power flows by making some DGs inductive and others capacitive, leading to reduced line and transformer loading. Such a centralized control scheme is considered in this paper.
2) Active Power Curtailment (APC): Active power curtail-ment is a simple yet efficient measure to avoid overvoltages as well as line overloads, by curtailing a relatively small amount of energy during problematic time intervals [12]. Therefore, it can be used by DSOs as a means to defer grid extensions. Concerning the capabilities and compensation schemes for such a control action, grid codes and regulation differ a lot between countries.
Thus, instead of (7), the PV generation is given by
(1−ccurt)Pgmax≤Pg ≤Pgmax, (10)
E. Usage quantification of the control measures
In order to quantify the usage of the control measures, two metrics are introduced. The normalized curtailed PV produc-tion and reactive power utilizaproduc-tion (consumpproduc-tion/producproduc-tion) are given by
mP= P
Pcurt P
Pmax g
mQ= P
|Qg| P
Qmaxg
(11)
where P
Pcurt and
P
|Qg| is the sum of the active power
curtailment of the whole system and the sum of the produc-tion/consumption of reactive power, respectively.
III. CASE STUDY
In this section, we demonstrate the proposed methodology using a meshed LV grid configuration. The grid is composed of 27 nodes and provides insights on the behavior of the different control measures used by DSOs. The grid topology and characteristics are shown in Fig.2, where PV panels with a total capacity of 400 kWp are installed on available roofs. The line resistance were increased to create artificial voltage violations and the transformer capacity was reduced to create overload problems. The original grid is part of a real LV grid in the area of Zurich.
Concerning input data, we followed the procedure of [9]. In summary, the PV potential was assigned using data from [8] and real PV measurements, whereas the load profiles were produced based on real measurements from the MV/LV trans-former, population density and number of households at each bus. Regarding the time dimension of the data, we used rep-resentative and worst-case profiles to account for seasonality. Three scenarios are considered; a) a Passive DSO (PDSO), b) an active DSO using only APC (ADSO-1), and c) an active DSO using APC and RPC with cosφmax = 0.85 (ADSO-2). The PDSO follows the procedure of the left part of Fig. 1, while the ADSOs of the right. First, we present results for one day to investigate the DSOs behavior when the grid is stressed. Then, we perform an economic assessment covering all seasons to explore the DSOs decision-making process.
A. Daily results
Large shares of DGs in LV distribution grids can lead to reversed power flows which was not designed initially for such events. By focusing on the worst day in terms of PV production, we can compare the DSO planning decisions to guarantee a secure LV grid operation.
Figure 3 shows the voltage profile at node 9 for the considered day which shows the largest overvoltage. The PDSO cannot satisfy the acceptable voltage limits, given by EN 50160 as ±10% [11], and it would require local actions to cope with overvoltages at this node. On the contrary, for both ADSO-1 and ADSO-2 the issue is solved through the OPF and the active control measures.
Figure4shows the loading of the MV/LV transformer for all DSO types. As seen in Fig.4a, both ADSOs manage to avoid the overload of the transformer. The difference between the two can be noticed at the transformer reactive power demand,
MV grid 27
1
2 4 13
10
7 25
21
14 15 16
19 18
20
3 5
22 26
12
MV/LV transformer capacity: 200 kVA
17
23 24
8
11
9
6
max. loading 158%
Vmax = 1.13 p.u.
Vmax = 1.14 p.u.
Vmax = 1.11 p.u.
[image:6.612.322.548.50.310.2]Total PV capacity: 400 kWp Peak load: 120 kW
Fig. 2. Reduced grid topology and characteristics. (modified [9])
shown in Fig. 4b. The PDSO and the ADSO-1 do not have control over reactive power and hence, request only a certain amount to cover the load demand. Controlling the reactive power within the constraints (8), the ADSO-2 makes some nodes capacitive and they produce the needed reactive power for the loads. Furthermore, by consuming reactive power in other nodes , the ADSO-2 can reduce line loadings by influencing the reactive current flow. This would be more obvious in distribution grids with larger X/R ratios. Having an additional control measure results in less PV curtailment (14.9 kWh in this day), as seen in Fig. 5 which shows the actual PV production of all PV nodes from10:00-16:00.
The flexibility required at the PV nodes from the two ADSOs is shown in Fig.6. Both ADSOs require a potential of 100% APC at nodes 22, 24 and 26. The reason is the transformer overload and it has nothing to do with the voltages. On the contrary, the curtailment in nodes9,11and16is related to overvoltages. Given that the cost for RPC is set to zero, RPC is always used at hours with voltage violations when active power is available.
Concerning the use of the control measures, ADSO-1 cur-tails more power than ASDO-2 within the day, as shown also in Fig.5. Therefore,mP >0at problematic hours in terms of
voltage and line overloads, with the ADSO-2 having smaller values than ADSO-1. Regarding reactive power, ADSO-1 has no control, i.e.mQ = 0, while the daily values of ADSO-2 are
depicted in Fig.7. We observe that RPC is prioritized during problematic hours with active power generation due to a zero cost coefficient in the objective function.
B. Yearly representation
Time (h)
1 3 5 7 9 11 13 15 17 19 21 23
Voltage (p.u.)
0.9 1 1.1
[image:7.612.374.503.74.144.2]PDSO ADSO - 1 ADSO - 2 EN 50160 limits
Fig. 3. Voltage profile at node 9 at day with maximum PV production.
Time (h)
1 3 5 7 9 11 13 15 17 19 21 23
Active power (kW)
-400 -300 -200 -100 0 100 PDSO ADSO - 1 ADSO - 2
(a)
Time (h)
1 3 5 7 9 11 13 15 17 19 21 23
Reactive power (kVar)
0 10 20
PDSO ADSO - 1 ADSO - 2
(b)
Fig. 4. Transformer loading. (a) Active power; (b) Reactive power.
Time (h)
10 11 12 13 14 15 16
Total PV production (kW) 240
250 260 270 280 290
ADSO - 1 ADSO - 2
Fig. 5. Actual PV production.
Node
3 6 9 11 12 15 16 19 20 22 24 26
Power (kW) 0 20 40 60 80
PV installed capacity (kW) ADSO - 1 flexibility needed (kW) ADSO - 2 flexibility needed (kW)
Fig. 6. Installed capacity and needed flexibility at each PV node.
time (h)
1 3 5 7 9 11 13 15 17 19 21 23
mQ
for ADSO-2
0 0.2 0.4
Fig. 7. Reactive power utilization metric.
control schemes. A PDSO would replace the transformer and that would lead to an investment, e.g. of Cost1= 80000CHF for a new compact station at a rural area equipped with a 400 kVA transformer.
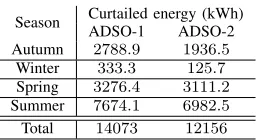
Table I shows the required curtailed energy per season by the ADSOs, assuming a curtailment cost of 0.1 CHF/kWh for the APC and zero cost for the RPC. Using RPC, ADSO-2 curtails 13.6% less total energy per year and that translates into 191.7 CHF less operational costs per year. Considering an interest rate of 0% andthor= 20years, the final operational
costs are: ADSO-1: Cost2 = 28145 CHF and ADSO-2:
Cost2= 24312CHF. Therefore, in this case it makes sense to use active distribution control measures. However, the final
TABLE I
ANNUAL REQUIRED CURTAILED ENERGY FOR THEADSOS.
Season Curtailed energy (kWh) ADSO-1 ADSO-2 Autumn 2788
.9 1936.5
Winter 333
.3 125.7
Spring 3276
.4 3111.2
Summer 7674
.1 6982.5
Total 14073 12156
decision in the general case will depend on the existing infrastructure of the DSO and on grid rules.
IV. CONCLUSION
The main aim of the DSOs is to guarantee a secure grid operation at the minimum possible cost. To achieve this, DSOs have in their disposal several planning strategies. In this paper, a methodology was proposed to be used by DSOs as a decision-making tool for optimal distribution grid planning. It considers both traditional and active network measures and can handle various grid structures as well as different regulatory requirements. In the future, the methodology will be extended to include control of units with intertemporal constraints, such as batteries, flexible loads, etc., as well as a comparison to local control schemes.
REFERENCES
[1] Netze BW GmbH, “Technische Mindestanforderungen (in german),” Tech. Rep. September. [Online]. Available: https://www.netze-bw.de/ media/kunden/docs/einspeiser/technische-spezifikationen-netze-bw.pdf
[2] Cigr´e Working Group C6.19, “Planning and optimization methods for active distribution systems,” Tech. Rep. August 2014.
[3] R. Viral and D. Khatod, “Optimal planning of distributed generation systems in distribution system: A review,”Renewable and Sustainable Energy Reviews, vol. 16, no. 7, pp. 5146–5165, Sep 2012.
[4] P. Georgilakis and N. Hatziargyriou, “Optimal distributed generation placement in power distribution networks: Models, methods, and future research,” IEEE Transactions on Power Systems, vol. 28, no. 3, pp. 3420–3428, 2013.
[5] M. O. W. Grond, J. Morren, and J. G. Slootweg, “Integrating smart grid solutions into distribution network planning,” in2013 IEEE PowerTech Conference. IEEE, Jun 2013.
[6] E. Tønne, J. Foosns, and T. Pynten, “Power system planning in distribution networks today and in the future with Smart Grids,” in
22nd International Conference and Exhibition on Electricity Distribution (CIRED), no. 1426, 2013, pp. 1426–1426.
[7] S. Karagiannopoulos, E. Vrettos, P. C. Lopez, M. Vrakopoulou, F. Old-ewurtel, G. Andersson, and M. Zima, “On geographical allocation of primary frequency control reserves in large interconnected power systems,” in2014 Power Systems Computation Conference, Aug 2014. [8] “Z¨uriPlan - Eignung f¨ur Solarw¨arme und Solarstrom in der Stadt Z¨urich (in german).” [Online]. Available: http://www.solarkataster. stadt-zuerich.ch/zueriplan/mapSolar.aspx
[9] V. Poulios, E. Vrettos, F. Kienzle, E. Kaffe, H. Luternauer, and G. An-dersson, “Optimal placement and sizing of battery storage to increase the PV hosting capacity of low voltage grids,” in 2015 International ETG Congress, Nov 2015.
[10] R. D. Zimmerman, C. E. Murillo-Sanchez, and R. J. Thomas, “MAT-POWER: Steady-State Operations, Planning, and Analysis Tools for Power Systems Research and Education,”IEEE Transactions on Power Systems, vol. 26, no. 1, pp. 12–19, Feb 2011.
[11] D. S.-M. Luke Schwartfeger, “Review of Distributed Generation Inter-connection Standards,” in2015 EEA Conference & Exhibition, 2015. [12] C. Bucher, G. Andersson, and L. K¨ung, “Increasing the PV Hosting
![Fig. 2. Reduced grid topology and characteristics. (modified [9])](https://thumb-us.123doks.com/thumbv2/123dok_us/7853654.178722/6.612.322.548.50.310/fig-reduced-grid-topology-characteristics-modied.webp)