Jie Bao, Mengling Wang, Hong Yue, William Leithead
Department of Electronic and Electrical Engineering, University of Strathclyde, Glasgow G1 1XW, UK (e-mail: [email protected]; [email protected]; [email protected]; [email protected])
Abstract: To investigate potential improvement in wind turbine control employing LIDAR measurement, pseudo-LIDAR wind speed data is produced with Bladed using a designed sampling strategy, and assessed with preliminary frequency-domain analysis. A model-inverse feed-forward controller is adapted to combine with feedback control so as to enhance pitch control performance at high wind speed. This controller is applied to an industrial-scale 5MW wind turbine model and the control performance is compared with a baseline feedback controller. Simulation study demonstrates that the combined feed-forward/feedback control scheme has improvements in reducing pitch angle variation and reduction of load relevant metrics.
Keywords: Wind turbine control, feed-forward control, LIDAR, wind speed modelling, pitch control.
1. INTRODUCTION
Control system is crucial for safe and efficient wind turbine operation. In recent years, the increasing size of wind turbines raises new challenges to wind turbine control systems. Conventional wind turbine control systems use feedback schemes involving PI and/or PID controllers as industry standard. The general control purpose is to maximise energy capture and reduce fatigue load. In below rated operation, a torque controller is applied to achieve maximum power coefficient by regulating the generator reaction torque. In above rated operation, a pitch controller is applied to limit the output power by regulating the pitch angle of rotor blades. The work in this paper is focused on improvement of pitch control at above-rated wind.
In the conventional feedback control scheme, the controller does not take wind speed information into account mainly because direct accurate measurement of the turbulent wind flow is not available. Therefore, the wind field experienced by the wind turbine is regarded as unknown disturbance to the control system. If the information of the incoming wind speed can be accurately measured, it is possible to compensate the disturbance through controller design. Recent developments on Light Detection and Ranging (LIDAR) technology in wind measurement shred lights on this aspect.
As an emerging technique, LIDAR can be used to measure wind speed over a spatial distribution and thereby provide the preview information of the incoming wind field for a wind turbine. The high-cost and complexity of LIDAR system have hindered its wider applications. However, recent progress on telecommunications and optical fibre techniques has made LIDAR more feasible for commercial use, especially in wind energy systems.
In the past decade, a number of wind turbine control methods have been proposed, in which wind speed measurement is either provided or potentially provided by LIDAR (Harris et al., 2006; Schlipf and Kühn, 2008; Dunne et al., 2011).
To take advantages of LIDAR measurement in enhancing wind turbine control performance, one solution is to add a feed-forward channel to the baseline feedback control system. In this case, the feed-forward controller can be designed independently of the feedback controller and will not affect the closed-loop stability. A predictive disturbance control (PDC) method was applied to design a feed-forward controller for collective pitch control, in which wind speed measurement is considered as input to the controller (Schlipf and Kühn, 2008). Later on more realistic LIDAR wind measurements information was applied to wind turbine control system instead of using an effective wind speed (Schlipf et al., 2010). The results showed reductions of tower and blade fatigue loads during high turbulent wind speeds. In (Dunne et al., 2011), two feed-forward controllers were designed to combine with two baseline feedback controllers, one applying model-inverse feed-forward control for collective pitch control, and the other applying a shaped compensator for individual pitch control. Both of them enabled wind speed measurements that could be potentially provided by LIDAR as inputs to the feed-forward controllers. An adaptive feed-forward controller was proposed based on filtered-x recursive least algorithm (Wang et al., 2012).
Some other advanced design approaches employing LIDAR wind measurements can also be found in recent literature. Model predictive control with LIDAR-based preview wind information was proposed in (Schlipf et al., 2013; Schlipf et al., 2014). A model predictive control method is developed considering LIDAR wind measurements to augment individual pitch control (Mirzaei et al., 2013).
measurements in above rated pitch control could be more beneficial. The feasibility of applying LIDAR into wind turbine control systems needs further investigation. This motivates the work in this paper. In this work, it is attempted
to investigate feed-forward collective pitch control
performance on an industrial 5MW wind turbine model in above rated conditions. Due to the lack of real LIDAR measurement data, pseudo-LIDAR data are produced for simulation study.
The rest of the paper is organized as follows. In Section 2, firstly LIDAR wind measurement data processing is briefly introduced. Then the production of pseudo-LIDAR wind speed data using Bladed is presented. Section 3 gives the details about the feed-forward controller design in augmentation to a feedback controller. Simulation studies on a 5MW wind turbine model are presented in Section 4. Conclusions are given in Section 5.
2. PSEUDO-LIDAR DATA AND ANALYSIS
2.1 LIDAR Wind Measurement
According to LIDAR measurement mechanisms, raw wind speed data obtained from LIDAR sensor contains errors in wind speed measurement and cannot be used directly to the control system design. Using data processing techniques can exclude the error signals to some extent. Two types of errors introduced by inherent continuous wave LIDAR structure were discussed in (Simley et al., 2011). One is the range weighting error, due to the problem on detecting the wind speed at focal point. The other is the geometry error caused by the line-of-sight measurement of LIDAR. The related issues for pulsed LIDARs and the comparison between errors from these two types of LIDARs can be seen in a recent work (Simley et al., 2014a). Other recent works also presented analysis of errors due to the induction zone and the arrival time from the LIDAR scanning plane to the rotor plane (Simley et al., 2014b; Dunne et al., 2014).
A proper description of wind evolution is another challenging task in this subject area. In most wind speed modelling, the Taylor‘s hypothesis (Taylor, 1938) is assumed, in which the wind turbulence is considered as frozen. This means that the wind field including the turbulence does not change when moving on. In such a case, the wind speed fluctuation over a time period between the turbine rotor plane and the LIDAR measurement plane is kept the same except for a time delay caused by the distance between the two planes. Nevertheless, Taylor‘s hypothesis is not valid in reality. Indeed, the turbulence will change when the wind field is moving and this change is called wind evolution. Research on modelling the process of wind evolution can be seen in (Simley et al., 2012; Bossanyi, 2012).
2.2 PSEUDO-LIDAR Wind Speed Data Production
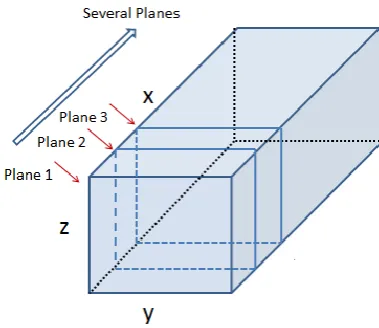
[image:2.595.323.513.77.241.2]Due to the lack of real LIDAR wind speed data, the wind speed data used in this research are generated from the Bladed. Bladed can generate a 3D turbulent wind field, which contains a number of point wind speeds.
Fig. 1. Wind turbulence model illustration in Bladed
As shown in Fig. 1, the wind turbulence model defined in Bladed is a cubic frozen model, it has 3 directions x, y and z. The model consists of several y-z planes (such as plane 1, 2, 3 in Fig. 1) along the x direction. Each plane has a number of points, which contains point wind speed information. The y-z plane 1 refers to the rotor plane and it is covered by a grid which consists of a number of points, which can be set up in the Bladed user interface. If a point is selected in plane 1, then the point speed information in each y-z plane (plane 1, 2, 3 and so on) along the x direction will be obtained from the Bladed. These point speed variations in the x direction are regarded as the time domain speed variations of the selected point in the y-z plane 1. Therefore, several point speed information with time domain variations in the rotor plane can be established. Essentially the wind turbulence model in the Bladed is a spatial model, but pseudo-time variations are introduced by taking the point wind speed in x axis as time variations. However, in this case the turbulence model is frozen where the wind evolution processes from different locations along the x direction to the rotor plane are not modelled. Thereby, to describe the wind evolution process as in LIDAR measurement, a data sampling approach is developed in the following.
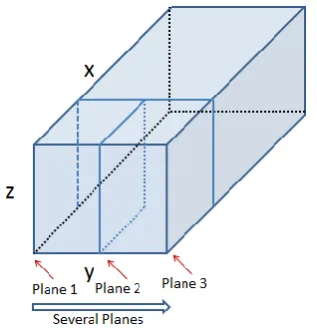
In the Bladed, this wind turbulence model is generated using the Veers method (Veers, 1988). The turbulence model is isotropic. That is to say, a point A has the same correlation with two other points which are located in different orientations but have the same distances between them and the point A. According to this assumption, a data sampling strategy is developed, in which the left x-z plane in Fig. 1 is regarded as the rotor plane, as shown in Fig. 2.
The wind evolution process from each plane to the rotor plane can then be modelled by using these wind speed data.
Fig. 2. A sampling strategy of the data in Bladed
[image:3.595.304.535.336.431.2]To simulate the LIDAR wind speed measurements, 8 sampling points are selected in the Bladed interface along the y direction. These points are regarded as representing LIDAR measurements planes. The cross power spectrum between the wind speed in rotor plane and those in each LIDAR measurement plane is then calculated to examine the relationship between planes. A wind model describing the wind evolution process could also be developed based on these time series wind speed data in different LIDAR measurement planes.
Fig. 3. Cross power spectrum between sampling planes (16 m/s mean wind speed with a 10% turbulence intensity)
As shown in Fig. 3, the cross power spectrums are plotted between the wind speed in rotor plane and each LIDAR measurement plane. For instance, the blue line is the cross power spectrum between the wind speed in the LIDAR measurement plane with a distance of 14.2857 m to the rotor plane.
As it can be seen, in the low frequency range, which is of modelling interests, the cross power spectral density (PSD) is getting lower when the distance between the LIDAR
measurement plane and the rotor plane is longer. This is valid in real case. A wind evolution model can be further established by utilising these data in the future.
3. FEED-FORWARD CONTROLLER DESIGN
3.1 Baseline Controller
[image:3.595.51.270.441.612.2]A standard baseline wind turbine controller normally consists of two parts. One is the torque controller which accounts for below rated operation, and the other is the pitch controller which accounts for above rated operation. In below rated condition, torque demand is employed to ensure the tracking of the maximum power coefficient so that the maximum energy capture is achieved. In above rated condition, pitch demand is employed to assure the generated power is maintained not to exceed its rated value. The pitch angles are set to different values according to the wind speed variations See (Leithead and Connor, 2000a; Chatzopoulos, 2011) for more information. A simplified diagram of the pitch control system is shown in Fig. 4 which is taken as the baseline controller. In this research, the feed-forward controller is employed to augment the baseline pitch control.
Fig. 4. Diagram of the baseline control system
3.2 Feed-forward Controller Design
The feed-forward controller is designed based on linear wind turbine model. The wind turbine model used in this work is generated from the SgurrControlBox control design toolbox in a state-space format. It can be easily transferred into an input-output transfer function model and get discretised for controller design. The diagram of the feedback control system structure with linearised turbine model is shown in Fig. 5.
Fig. 5. Feedback control diagram based on linearized turbine model (v is the wind speed, 𝛽 is the pitch demand, 𝜔𝑔_𝑒 is the
[image:3.595.314.544.583.718.2]The linearized turbine model contains two transfer functions,
𝐺ωg_e𝛽 represents the transfer function from pitch demand to
generator speed error; and 𝐺ωg_e𝜈 represents the transfer
function from wind speed to generator speed error.
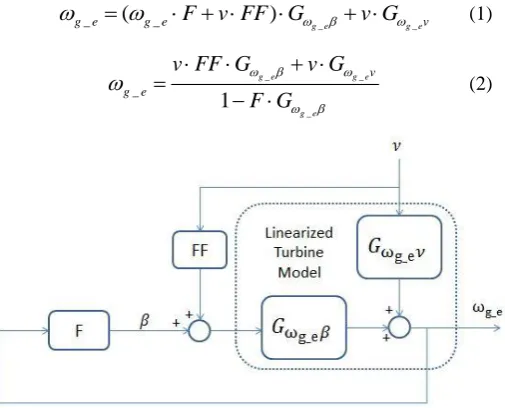
Subsequently, a feed-forward controller is designed based on a model-inverse method (Schlipf and Kühn, 2008; Dunne et al., 2011) to compensate the effect that wind speed disturbance imposes on the generator speed error. This is shown in Fig. 6, in which F represents the feedback controller and FF represents the feed-forward controller, and there is
_ _
_
(
_)
g e g eg e g e
F
v FF
G
v G
v
(1)_ _
_
_
1
g e g e
g e v g e
v FF G
v G
F G
[image:4.595.44.297.216.420.2]
(2)Fig. 6. Feed-forward controller with linearized turbine model
The control objective is to keep the generator speed error to be zero, i.e.,
g e_
0
. Thus the transfer function of FF is obtained through_ _
0
g e g ev
v FF G
v G
(3)to be
_ _
1
g e g ev
FF
G
G
(4)The calculated result of the feed-forward controller from (4) cannot be directly used in the control system because the transfer function 𝐺ωg_e𝛽 contains non-minimum phase zeros.
If 𝐺ωg_e𝛽 is inversed, the non-minimum phase zeros will become poles that cause the system to be unstable. To deal with the non-minimum phase zeros, in this work, a method called non-minimum phase zero ignore (NPZ-ignore) (Butterworth et al., 2008) is employed.
4. SIMULATION STUDY
4.1 Wind Turbine Model and Feed-forward Controller
A 5 MW Supergen Exemplar wind turbine model developed in Strathclyde University is used in this research. This is a non-linear model that is constructed in Simulink. It contains 3 main parts, the pitch mechanism, aero-rotor and drive train
model. The main turbine parameters are listed in Table 1. More details can be found in (Leithead and Connor, 2000b; Chatzopoulos, 2011). A matched 5 MW Supergen feedback controller is used here as the baseline controller.
Table 1. Turbine Parameters
Hub Height Rotor
Radius
Cut-in Wind Speed
Cut-out Wind Speed
90 m 63 m 4 m/s 25 m/s
Minimum Generator Speed Maximum Generator Speed Gearbox Ratio Rated Power
70 rad/s 120 rad/s 97 5 MW
In this simulation, the wind turbine model is linearized at a high wind speed of 16 m/s. As mentioned before, the transfer function model is discretised for controller design. The result of 𝐺ωg_e𝜈, 𝐺ωg_e𝜈 and FF are then given as follows, the
sampling time is 0.01s.
11 10 9
8 7 6
5 4 3
2
12 11 10 9 8
7 _
(1.072 e 05) (4.892 e 05) 0.0004293 0.009205 0.0006005 0.000548 0.001168 0.000752 0.0001848 (2.662 e 06) (5.345 e 06) (1.211 21)
9.208 38.61 98.05 169.3
211.6
g ev
z z z
z z z
z z z
z z e
z z z z z
z
G
6 5 4
3 2
198.1 140.1 73.52
27.01 6.17 0.6549 (4.86 19)
z z z
z z z e
(5)
11 10 9 8
7 6 5 4
3 2
12 11 10 9 8
7 6 5 4
3 2
_
0.7397 5.273 15.33 21.52
8.944 17.61 33.3 26.86
11.97 2.855 0.2825 (6.022 11)
9.208 38.61 98.05 169.3
211.6 198.1 140.1 73.52
27.01 6.17 0.6549
g e
z z z z
z z z z
z z z e
z z z z z
z z z z
z z
G
z(4.86e19)
(6)
11 10 9
8 7 6
5 4 3
2
11 10 9
(1.072 e 05) (4.892 e 05) 0.0004293 0.009205 0.0006005 0.000548 0.001168 0.000752 0.0001848 (2.662 e 06) (5.345 e 06) (1.211 21)
(1.1288 e 06) (4.8009 e 06) (7.9907 e 06) (6
z z z
z z z
z z z
z z e
z z z
FF
8 7 6
.4478 e06)z (2.4836 e06)z (3.5426 e07)z
(7)
This feed-forward controller is of a high order which is inconvenient for tuning. A reduced-order feed-forward controller is used instead in this work as shown in equation. In order to fine tune the reduced-order controller, a tuning factor kFF is introduced in the transfer function of FF. This tuning function can also address modelling uncertainty to some extent.
4.2 Simulation Study
The simulation is conducted at a 16 m/s mean wind and the wind speed fluctuations are modelled by a set of small step signals added to the mean wind speed. The influences of the feed-forward controller are examined through plots of pitch demand, tower fore-aft acceleration, out-of-plane rotor torque and the gererated power.
[image:4.595.306.554.295.535.2]2.336e-04. A decrease in the pitch angle demand variations not only saves driving energy but also helps to expand lifetime of pitch actuators.
Fig. 7. Comparison of the pitch angle demand between baseline controller and feed-forward controller
A reduction of the tower fore-aft acceleration fluctuations can be seen in Fig. 8. Since the fore-aft tower acceleration is reduced, the oscillation of the tower is reduced and thereby the lifetime of the tower could be expanded. Moreover, the load that propagates from tower to drive train can also be reduced.
Fig. 8. Comparison of the tower acceleration between baseline controller and feed-forward controller
[image:5.595.47.272.119.292.2]In the wind turbine model, the aerodynamic torque which acts on the rotor is modelled as a combination of in-plane and out-of-plane rotor torque. Fig. 9 shows the reduction of the out-of-plane torque. This indicates that the load which propagates from the aerodynamic load to drive train is reduced. The comparison of the generated power, as an important indicator to the wind turbine system, is calculated as shown in Fig. 10. It can be seen that the generated power does not change significantly after adding the feed-forward controller into the baseline controller.
[image:5.595.309.532.301.478.2]Fig. 9. Comparison of the out-of-plane rotor torque between baseline controller and feed-forward controller
Fig. 10. Comparison of the generated power between baseline controller and feed-forward controller
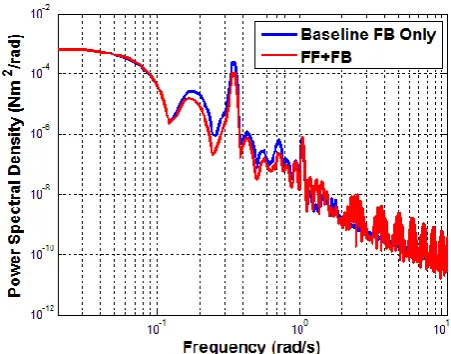
[image:5.595.47.272.424.598.2] [image:5.595.309.535.530.707.2]As a significant supplement, the characteristic of pitch angle demand in frequency domain is also presented in Fig. 11. In low frequency range, which is the most significant part for controller design, the reduction of the PSD of the pitch demand can be seen. This clearly reflects a better performance of the designed control system.
In summary, the simulation study shows that the feed-forward controller combing with the baseline feedback controller has achieved improved performance on reducing the pitch angle demand variation, tower fore-aft acceleration fluctuations and out-of-plane rotor torque without degrading the generated power.
5. CONCLUSIONS
In this work, we introduce a method on generating pseudo-LIDAR wind speed measurements via the Bladed. A feed-forward controller is designed to be combined with a baseline feedback controller by using a model-inverse method based on a 5 MW wind turbine model. A high wind speed is used in evaluating the performance of the feed-forward controller, and several improvements can be observed from the simulation study.
This is only a preliminary study with an attempt to introduce LIDAR-based measurement into wind turbine control. To integrate LIDAR information into controller design, a model describing wind evolution from LIDAR measurement plane to rotor plane needs to be developed. With a proper wind evolution model, there will be wider opportunities for advanced controller design to compensate wind disturbance.
REFERENCES
Bossanyi, E. (2012) Un-freezing the turbulence: improved wind field modelling for investigating Lidar-assisted
wind turbine control. Proc. EWEA Copenhagen,
Denmark.
Butterworth, J. A., Pao, L. Y. and Abramovitch, D. Y. (2008) The effect of nonminimum-phase zero locations on the performance of feedforward model-inverse control techniques in discrete-time systems. Proc. American Control Conf. Seattle, Washington, USA. Chatzopoulos, A. P. (2011) Full Envelope Wind Turbine
Controller Design for Power Regulation and Tower Load Reduction. Dept. of Electronic and Electrical Engineering. University of Strathclyde.
Dunne, F., Pao, L. Y., Schlipf, D. and Scholbrock, A. K. (2014) Importance of Lidar Measurement Timing
Accuracy for Wind Turbine Control. Proc.
American Control Conf. Portland, OR, USA. Dunne, F., Pao, L. Y., Wright, A. D., Jonkman, B. and
Kelley, N. (2011). Adding feedforward blade pitch control to standard feedback controllers for load mitigation in wind turbines. Mechatronics, 21, 682-690.
Harris, M., Hand, M. and Wright, A. (2006) Lidar for turbine control. Golden, CO, NREL.
Leithead, W. and Connor, B. (2000a). Control of variable speed wind turbines: design task. Int. J. Contr.,73, 1189-1212.
Leithead, W. and Connor, B. (2000b). Control of variable speed wind turbines: dynamic models. Int. J. Contr., 73, 1173-1188.
Mirzaei, M., Soltani, M., Poulsen, N. K. and Niemann, H. H. (2013) An MPC approach to individual pitch control
of wind turbines using uncertain LIDAR
measurements. ECC. Zurich, IEEE.
Schlipf, D., Fischer, T., Carcangiu, C. E., Rossetti, M. and Bossanyi, E. (2010) Load analysis of look-ahead
collective pitch control using LIDAR. Proc.
DEWEK. Bremen, Germany.
Schlipf, D., Grau, P., Raach, S., Duraiski, R., Trierweiler, J. and Cheng, P. W. (2014) Comparison of linear and nonlinear model predictive control of wind turbines
using LIDAR. Proc. ACC Conf. Portland, USA,
IEEE.
Schlipf, D. and Kühn, M. (2008) Prospects of a collective pitch control by means of predictive disturbance compensation assisted by wind speed measurements.
Proc. DEWEK. Bremen, Germany.
Schlipf, D., Kapp, S., Anger, J., Bischoff, O., Hofsäß, M., Rettenmeier, A. and Kühn, M. (2011) Prospects of optimization of energy production by lidar assisted
control of wind turbines. Proc. EWEA Conf.
Brussels, Belgium.
Schlipf, D., Schlipf, D. J. and Kühn, M. (2013). Nonlinear model predictive control of wind turbines using
LIDAR. Wind Energy,16, 1107-1129.
Simley, E., Pao, L. Y., Frehlich, R., Jonkman, B. and Kelley, N. (2011) Analysis of wind speed measurements using continuous wave lidar for wind turbine control. Proc. AIAA. Meet. Orlando, Florida, AIAA. Simley, E., Pao, L. Y., Frehlich, R., Jonkman, B. and Kelley,
N. (2014a). Analysis of light detection and ranging wind speed measurements for wind turbine control.
Wind Energy,17, 413-433.
Simley, E., Pao, L. Y., Gebraad, P. and Churchfield, M. (2014b) Investigation of the impact of the upstream induction zone on LIDAR measurement accuracy for wind turbine control applications using large-eddy simulation. JPCS. IOP Publishing.
Simley, E., Pao, L. Y., Kelley, N., Jonkman, B. and Frehlich, R. (2012) LIDAR wind speed measurements of evolving wind fields. Proc. AIAA. Meet.
Taylor, G. I. (1938). The spectrum of turbulence. P. Roy. Soc. Lond. A Mat.,164, 476-490.
Veers, P. S. (1988) Three-dimensional wind simulation.
Sandia Report. Calfornia, USA.
Wang, N., Johnson, K. E. and Wright, A. D. (2012). FX-RLS-based feedforward control for LIDAR-enabled wind turbine load mitigation. IEEE Trans. Control Syst. Technol.,20, 1212-1222.
Wang, N., Johnson, K. E. and Wright, A. D. (2013). Comparison of strategies for enhancing energy capture and reducing loads using LIDAR and
feedforward control. IEEE Trans. Control Syst.