3D Diffusion-Weighted
129
Xe MRI for Whole
Lung Morphometry
Ho-Fung Chan, Neil J. Stewart
, Graham Norquay,
Guilhem J. Collier, and Jim M. Wild*
Purpose: To obtain whole lung morphometry measurements from129Xe in a single breath-hold with 3D multiple b-value129Xe diffusion-weighted MRI (DW-MRI) with an empirically optimized diffusion time and compressed sensing for scan acceleration.
Methods:Prospective three-fold undersampled 3D multiple b-value hyperpolarized 129Xe DW-MRI datasets were acquired, and the diffusion time (D) was iterated so as to provide diffusive length scale (LmD) estimates from the stretched exponential model (SEM) that are comparable to those from 3He. The empirically optimized 129Xe diffusion time was then imple-mented with a four-fold undersampling scheme and was pro-spectively benchmarked against3He measurements in a cohort of five healthy volunteers, six ex-smokers, and two chronic obstructive pulmonary disease patients using both SEM-derived LmDand cylinder model (CM)-derived mean chord length (Lm).
Results:Good agreement between the mean 129Xe and3He LmD(mean difference, 2.2%) and Lm (mean difference, 1.1%) values was obtained in all subjects at an empirically optimized 129Xe
D¼8.5 ms.
Conclusion:Compressed sensing has facilitated single-breath 3D multiple b-value129Xe DW-MRI acquisitions, and results at 129Xe
D¼8.5 ms indicate that129Xe provides a viable alterna-tive to3He for whole lung morphometry mapping with either the SEM or CM. Magn Reson Med 000:000–000, 2017.
VC 2017 The Authors Magnetic Resonance in Medicine
pub-lished by Wiley Periodicals, Inc. on behalf of International Society for Magnetic Resonance in Medicine. This is an open access article under the terms of the Creative Com-mons Attribution License, which permits use, distribution and reproduction in any medium, provided the original work is properly cited.
Key words: hyperpolarized 129Xe; lung morphometry; com-pressed sensing; stretched exponential model; hyperpolarized 3
He
INTRODUCTION
The apparent diffusion coefficient (ADC) calculated from hyperpolarized 3He diffusion-weighted MRI (DW-MRI) has been shown to be sensitive to changes in lung micro-structure (1,2). The non-Gaussian diffusion behavior of the gas in the lungs results in a non-monoexponential signal attenuation with increasing b-value (3). The signal decay is determined by experimental and physiological factors including gas diffusivity, diffusion gradient strengths and timings, and the complexity of alveolar microstructure, which together influence the measure-ment of ADC (4,5). Theoretical diffusion models, such as the cylinder model (CM) (6,7), stretched exponential model (SEM) (8), and q-space analysis (9), have been proposed to model this non-Gaussian diffusion behavior and derive estimates of alveolar length scales (i.e., mor-phometry) from multiple b-value DW-MRI acquisitions. Compressed sensing (CS) has enabled multiple b-value
3He DW-MRI for 3D whole lung morphometry mapping
in a single breath-hold (10) for quantitative regional assessment of lung microstructure.
With the limited availability of3He gas (11),129Xe pro-vides a more cost-effective alternative for pulmonary MRI, and with advancements in polarization levels (12,13), recent studies have shown that comparable ventilation and microstructural information can be obtained using both nuclei (14–17). DW-MRI with129Xe is, however, inherently more challenging due to the lower diffusivity and gyro-magnetic ratio of 129Xe compared with 3He, resulting in
longer diffusion gradient times, longer sequence echo time (TE) and repetition time (TR), and lower image SNR. Despite these challenges, theoretical models have been proposed for interpreting the 129Xe DW-MRI signal from multiple b-value acquisitions (18), and estimates of alveo-lar length scales have been derived from healthy subjects and chronic obstructive pulmonary disease (COPD) patients (19–21). However, the multiple b-value interleaves in previous studies were acquired using noncontiguous, relatively thick 2D slices without whole lung coverage— and in some cases in separate breath-holds—due to the associated long scan times. Furthermore, to our knowl-edge, no direct comparison of alveolar length scales derived from application of theoretical diffusion models of
3He and129Xe in vivo have yet been presented.
In this study, compressed sensing acceleration meth-ods developed for3He (10) were adapted for 3D multiple b-value 129Xe DW-MRI in a single breath-hold, and 3D
morphometric maps of mean diffusive length scale (LmD)
were generated using the SEM. Results were compared against equivalent 3D 3He LmD morphometric maps
acquired with CS, and an optimal129Xe diffusion time of
POLARIS, Academic Unit of Radiology, University of Sheffield, Sheffield, UK.
Grant sponsor: National Institute for Health Research; Grant number: NIHR-RP-R3-12-027; Grant sponsor: Medical Research Council; Grant number: MR/M008894/1.
The views expressed in this publication are those of the authors and not necessarily those of the National Health Service, the National Institute for Health Research or the Department of Health.
*Correspondence to: Jim M. Wild, Ph.D., Academic Unit of Radiology, Uni-versity of Sheffield, C Floor, Royal Hallamshire Hospital, Glossop Road, Sheffield, S10 2JF, UK. E-mail: [email protected]
Received 15 August 2017; revised 14 September 2017; accepted 19 September 2017
DOI 10.1002/mrm.26960
Published online 00 Month 2017 in Wiley Online Library (wileyonlinelibrary.com).
VC 2017 The Authors Magnetic Resonance in Medicine published by Wiley
Periodicals, Inc. on behalf of International Society for Magnetic Resonance in Medicine. This is an open access article under the terms of the Creative Commons Attribution License, which permits use, distribution and reproduction in any medium, provided the original work is properly cited.
Magnetic Resonance in Medicine 00:00–00 (2017)
D¼8.5 ms was derived empirically. Prospective acquisi-tions with the optimal 129Xe diffusion time were then benchmarked in healthy volunteers, ex-smokers, and COPD patients with both SEM-derived LmD and
CM-derived mean chord length (Lm) measurements.
THEORY
The Stretched Exponential Model
The non-Gaussian signal decay from an imaging voxel can be modeled as the superposition of signals with dif-ferent apparent diffusivities (D):
Sb
S0 ¼
Z D0
0
pðDÞebDdD [1]
whereS0 is the signal whenb¼0,Sb is the signal
corre-sponding to a non-zero b-value,Dare all possible appar-ent diffusivities between 0 and D0 (the free diffusion
coefficient of 3He or 129Xe in air/N2), and pðDÞ is the
probability distribution associated with the apparent dif-fusivities. The non-Gaussian HP gas diffusion signal decay in the lungs can be well described by an SEM fit (Equation [2]) (22).
Sb
S0
¼e½b DDCa
[2]
With3He DW-MRI, the SEM-derived parameters of
distrib-uted diffusivity coefficient (DDC) and heterogeneity index (a) have been shown to be sensitive to changes in lung microstructure and are valid over a range of experimental conditions. DDC is dependent on diffusion time, whilea
has been demonstrated to be insensitive to lung inflation and experimental diffusion time (23). A numerical expres-sion for pðDÞ can be estimated from the SEM-derived parameters using the approach developed by Berberan-Santos et al. (24):
pðDÞ ¼t0 B Dt0ð1a=2Þ=ð1aÞ
exp ð1aÞa a=ð1aÞ
Dt0a=ð1aÞ
fðDÞ;
[3]
wheret0 is 1/DDC, andfðDÞis defined by
fðDÞ ¼ 1=½1þCðDt0Þ d
; d¼að0:5aÞ=ð1aÞ; a0:5;
½1þCðDt0Þd; d¼aða0:5Þ=ð1aÞ; a>0:5; :
(
[4]
The parameters B and C are functions related toa, and parameters at specifica values can be found in Table 1 of Berberan-Santos et al. (24). Interpolation can be used to derive the corresponding parameters B and C for other
a values. The expression for pðDÞ can subsequently be related to a distribution of diffusion length scales pðLDÞ
associated with the different apparent diffusivities through the 1D diffusion equation LD5(2DD)
1=2
(i.e., root mean squared displacements, where D is the diffusion time). ThepðLDÞ distributions should then represent the
distribution of microscopic dimensions of the airways (i.e., the diffusion-restricting boundaries) contained within a given voxel. These distributions can then be used to calculate the mean diffusion length scale (LmD)
as a quantitative estimate of the mean acinar airway dimensions within a given voxel. The LmDmetric should
therefore be analogous to the calculation of mean linear intercept length (Lx) from histology.
This method of calculating LmD differs from the
method used to derive mean chord length (Lm) with the CM. In the CM, the underlying assumptions are that the acinar airways are considered cylindrical objects and thus the HP gas diffusion signal can be described by two anisotropic diffusion coefficients, longitudinal (DL) and
transverse (DT). Phenomenological expressions were
empirically optimized from Monte Carlo simulations to relate DLand DT to the cylindrical lung airway
parame-ters, outer airway radii (R) and alveolar sleeve depth (h) (6,25). Lm is subsequently derived from the alveoli sur-face area and volume based upon the geometrical param-eters of R and h (7).
METHODS
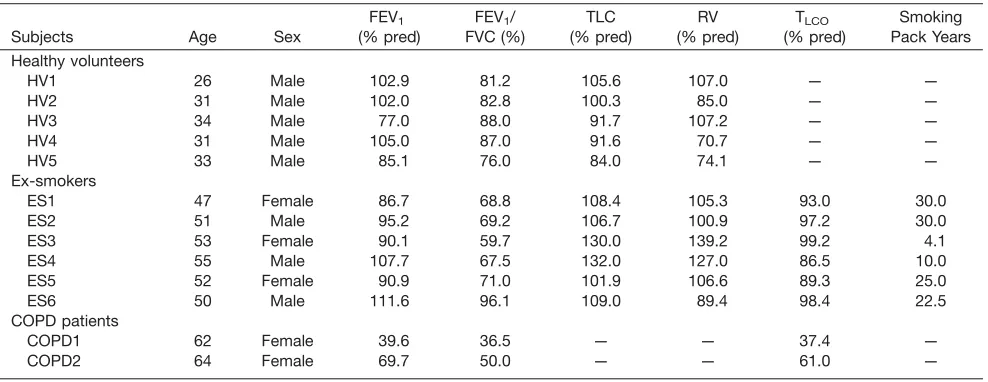
[image:2.612.61.555.95.286.2]All in vivo MRI experiments were performed under the approval of the UK National Research Ethics Committee
Table 1
Summary of Subject Demographics and Pulmonary Function Test Data
Subjects Age Sex
FEV1 (% pred)
FEV1/ FVC (%)
TLC (% pred)
RV (% pred)
TLCO (% pred)
Smoking Pack Years Healthy volunteers
HV1 26 Male 102.9 81.2 105.6 107.0 — —
HV2 31 Male 102.0 82.8 100.3 85.0 — —
HV3 34 Male 77.0 88.0 91.7 107.2 — —
HV4 31 Male 105.0 87.0 91.6 70.7 — —
HV5 33 Male 85.1 76.0 84.0 74.1 — —
Ex-smokers
ES1 47 Female 86.7 68.8 108.4 105.3 93.0 30.0
ES2 51 Male 95.2 69.2 106.7 100.9 97.2 30.0
ES3 53 Female 90.1 59.7 130.0 139.2 99.2 4.1
ES4 55 Male 107.7 67.5 132.0 127.0 86.5 10.0
ES5 52 Female 90.9 71.0 101.9 106.6 89.3 25.0
ES6 50 Male 111.6 96.1 109.0 89.4 98.4 22.5
COPD patients
COPD1 62 Female 39.6 36.5 — — 37.4 —
and the local National Health Service research office. All CS simulations and lung morphometry calculations were implemented in-house using MATLAB (MathWorks, Natick, Massachusetts, USA) software. The signal-to-noise ratio (SNR) for each dataset was computed in the magnitude images (b¼0) by dividing the mean signal of the entire segmented lung region by a region of back-ground noise corrected for Rician distribution bias. It should be noted that SNR calculated from CS images present a biased measure of SNR, due to the denoising process associated with CS reconstruction.
3D Multiple b-Value129Xe DW-MRI with CS
A fully sampled 3D129Xe DW-MRI dataset was acquired from a healthy male volunteer (HV1) on a 1.5 T (GE HDx) MR scanner using a flexible quadrature transmit/receive vest coil (Clinical MR Solutions, Brookfield, Wisconsin, USA) which was tuned to the Larmor frequency of129Xe at
1.5 T (17.66 MHz). All lung imaging was performed at a lung volume of functional residual capacity plus 1L fol-lowing inhalation of a dose of 800 mL enriched Xe [86%
129Xe,30% polarization (12,13)] mixed with 200 mL of
N2. Image acquisition parameters were: 3D spoiled
gradi-ent echo sequence; 2interleaves (b¼0, 12 s/cm2);
elliptical-centric phase encoding; in-plane reso-lution¼6452 (6.25 mm pixel dimension); 18 effective coronal slices (15 mm slice thickness); field of view¼4032.527 cm3; TE/TR¼11.2/14.4 ms; diffu-sion time (D)¼5 ms (diffusion gradient strength¼22.7 mT/m, ramp time¼0.3 ms, plateau time¼3 ms, gap between lobes¼1.4 ms); flip angle¼2.2; and bandwidth¼66.97 KHz.
129Xe
D¼5 ms was first chosen as it corresponds to the diffusion time originally proposed for 129Xe lung morphometry with the CM (18). This time was derived theoretically such that acinar airway geometrical parame-ters from the CM for 129Xe would be the same as those obtained with3He (18), and these values have been
sub-sequently used in 2D129Xe DW-MRI experimental stud-ies (20,21). Retrospective CS simulations of the fully sampled dataset with acceleration factors (AF) between 2 and 5 were implemented using the methodology described previously for3He (10). The Wilcoxon signed-rank test was employed to assess differences in fully sampled and retrospectively reconstructed ADC maps for each AF on a pixel-by-pixel basis.
The optimum k-space sampling pattern for three-fold undersampling was chosen based on the simulation results and was used for prospective acquisition of 3D
129Xe multiple b-value DW-MRI data from four healthy
volunteers (HV1, HV2, HV3, HV4). Prospective data were acquired with an inhaled gas mixture of 750 mL 129Xe
and 250 mL nitrogen, with imaging parameters as for the fully sampled acquisition other than the following: four interleaves (b¼0, 12, 20, 30 s/cm2); TE/TR¼11.7/15.0
ms; D¼5 ms (maximum diffusion gradient strength¼31.9 mT/m, ramp time¼0.3 ms, plateau
time-¼3.5 ms, gap¼0.9 ms); and flip angle¼2.7. The AF of 3 reduces the scan time from 57 to 19 s.129Xe LmDmaps
were calculated using the SEM, and results were com-pared with LmDmaps derived from the same volunteers’
lungs using 3He DW-MRI as described by Chan et al. (10).3He Lm
Dat3HeD¼1.6 ms was chosen for
compari-son because healthy and COPD LmD values derived at
this diffusion time have been demonstrated to match his-tologically derived healthy and COPD mean linear inter-cept values (26).
Empirical Determination of Optimal129Xe Diffusion Time
With the aim of obtaining the best agreement between129Xe and3He lung morphometry results [rather than simply using
the129XeD¼5 ms proposed by Sukstanskii and Yablonskiy (18)], HV1 was imaged at additional diffusion times (D¼5, 7, 8, and 10 ms).129XeD¼10 ms was chosen as it corresponds to the same 1D characteristic free diffusion length ( ffiffiffiffiffiffiffiffiffiffiffiffi2D0D
p
530mm) as experienced in the benchmark3He experiment
(assuming DXe–air0 ¼ 0:14 cm2=s; DHe–air0 ¼ 0:88 cm2=s,
andDHe¼1.6 ms). Each additional scan was acquired with the same gas mixture and b-values as the previous prospec-tive CS acquisitions at129XeD¼5 ms, and Lm
Dmaps were
calculated from each dataset.
Benchmarking of Empirically Optimized
129
Xe Diffusion Time
The empirically optimized diffusion time (129Xe D¼8.5
ms [see Results]) was then benchmarked against 3He equivalent measurements for lung morphometry mapping over different ranges of acinar length scales that are expe-rienced with smoking-related emphysema. Five healthy volunteers (age, 31.063.1 years), six ex-smokers (age, 51.362.7 years), and two COPD patients (age, 63.061.4 years, GOLD II-IV) were recruited for this preliminary study. Subject demographics and pulmonary function test (PFT) data for each subject are summarized in Table 1.
Each subject was imaged with 3D multiple b-value
129Xe DW-MRI, using 750 mL of inhaled 129Xe and the
following imaging parameters: TE/TR¼14.0/17.3 ms; maximum DW gradient strength¼32.6 mT/m; D¼8.5 ms; ramp time¼0.3 ms; plateau time¼2.3 ms; gap¼5.6 ms; and flip angle¼3.1. Using 129Xe D¼8.5 ms, the
duration of three-fold undersampled CS scans was increased by 3 s due to the increased diffusion time. Therefore, four-fold undersampling (AF¼4) was now implemented in the subsequent prospective CS acquisi-tions to further reduce the breath-hold to 16 s, similar to the 15 s acquisition for3He (10), and to demonstrate the clinical viability of this sequence. 3D 3He DW-MRI was
acquired in same-day scan sessions for all subjects (except for HV1–HV3, for whom3He data were acquired
approximately 1 year previously), with experimental parameters described previously (10).129Xe and3He Lm
D
maps were derived and compared in each subject. Finally, the applicability of 129Xe D¼8.5 ms to CM
derivations of lung morphometry parameters was assessed. The129Xe-based CM phenomenological expres-sions are optimized for 129Xe D¼5 ms; however, if the same theoretical free diffusion length is probed with both nuclei (i.e.,DHe¼1.6 ms andDXe¼10 ms), the
origi-nal 3He-based phenomenological expressions should in theory be applicable for derivation of 129Xe lung
129Xe D¼10 ms, suggested that, as with the SEM, more
consistent129Xe lung morphometry results were obtained
with129XeD¼8.5 ms (see Discussion). The 3D multiple
b-value 129Xe DW-MRI data at 129Xe D¼8.5 ms was
therefore analyzed using the3He-based CM
phenomeno-logical expressions (7), and the129Xe mean chord length
(Lm) was hence derived and compared with3He-derived
Lm for each subject in the preliminary study.
RESULTS
3D Multiple b-Value129Xe DW-MRI with CS
The SNR of the fully sampled129Xe DW-MRI dataset was 25. Optimal k-space undersampling patterns for different AFs were determined through CS simulations. Retrospec-tively reconstructed datasets from each optimal under-sampling pattern showed a small increase in mean absolute error (MAE) of normalized signal intensity value for the b¼0 data (from 2.27% at AF¼2 to 4.25% at AF¼5), indicating a good preservation of image details
with increased AF (Fig. 1). Whole lung mean ADC histo-grams and single slice ADC maps generated from the reconstructed CS datasets also demonstrated a good pres-ervation of quantitative information and low MAEADC
(Fig. 2). Wilcoxon signed-rank tests for each AF found no significant differences (P>0.05) between CS-reconstructed and fully sampled ADC maps on a pixel-by-pixel basis, confirming preservation of quantitative information and indicating that CS is suitable for 3D
129Xe multiple b-value DW-MRI.
Prospective 3D 129Xe multiple b-value DW-MRI was acquired in four healthy volunteers with AF¼3 and
129Xe D¼5 ms, and resulting ADC and Lm
D maps were
[image:4.612.76.537.74.174.2]compared with previously calculated lung microstruc-tural maps acquired using 3D3He multiple b-value DW-MRI. Mean SNR for the four prospective 129Xe datasets was 40. The prospective CS whole lung mean129Xe ADC value for volunteer HV1 (0.0329 cm2/s) was very similar (þ1.2% difference) to the fully sampled mean ADC value (0.0325 cm2/s) that was obtained for CS simulations. FIG. 1. CS simulation results for 3D129Xe DW-MRI. Reconstructed magnitude image (b
¼0) for each AF, with corresponding MAE values (AF¼1; fully sampled dataset [SNR¼25]).
FIG. 2. ADC results for 3D129Xe DW-MRI CS simulations. (a) Single-slice ADC maps with the MAE
[image:4.612.77.538.453.723.2]Example129Xe and3He LmDmaps from the comparative
slices in HV1 are shown in Figure 3 and a summary of mean ADC and LmD values for each volunteer is
pro-vided in Table 2. At 129Xe D¼5 ms, mean 129Xe LmD
values for all subjects were50mm smaller than the cor-responding mean3He values.
Empirical Determination of Optimal129Xe Diffusion Time
A strong positive linear correlation (r¼0.998, P<0.001) was established between129Xe Lm
Dand diffusion times,
and atD¼8.5 ms the129Xe LmD value best matched the
volunteer’s3He LmD value (Fig. 4a). In contrast to LmD,
mean 129Xe ADC decreased with increasing diffusion
time; a 12.5% decrease in mean129Xe ADC was observed fromD¼5 ms to 10 ms. The relationship between129Xe ADC and diffusion time was nonlinear, however, and best fitted a logarithmic function (R2¼0.961) (Fig. 4b).
Benchmarking of Empirically Optimized129Xe Diffusion Time
The mean3He and 129Xe SNR of the b¼0 image for all preliminary study subjects was 32 and 65, respectively. A summary of 129Xe Lm
D and corresponding 3He LmD
values are shown in Table 3. An improved matching of mean129Xe and3He LmD was obtained with the
empiri-cally optimized diffusion time, and this is visible in example LmD maps from three representative subjects
(Fig. 5). A difference in LmD of less than 7% was
observed in all subjects, with a mean difference (129Xe 3He) in all subjects of 2.2%. Figure 6a shows a very
strong correlation (r¼0.987, P<0.001) between individ-ual lung3He and129Xe mean LmDvalues in all subjects.
LmD values fall around the line of equality, and this
good agreement was confirmed by Bland-Altman analy-sis (Fig. 6b) of individual lung LmD values, where a
mean bias of2.1% (4.8mm) for129Xe mean Lm Dwith
a 95% confidence interval of 6.7% to 2.5% (14.8 to 5.2mm) was observed.
The mean difference in 129Xe and 3He CM Lm values was þ1.1% (Table 3), demonstrating a similar level of agreement in CM-derived Lm at 129Xe D¼8.5 ms as
SEM-derived LmD. 3He and 129Xe CM single lung Lm
values were also strongly correlated (r¼0.980,P<0.001) (Fig. 6c), and Bland-Altman analysis of mean single lung Lm values indicates a mean bias of þ2.3% in 129Xe Lm values with a 95% confidence interval of 15.2% to 19.9% (Fig. 6d).
DISCUSSION
3D Multiple b-Value129Xe DW-MRI with CS
CS has enabled the acquisition of 3D multiple b-value
129Xe DW-MRI in a single breath-hold for the generation
of whole lung maps of alveolar diffusion length scale with a voxel size of 6.256.2515 mm3. Retrospectively undersampled 129Xe datasets demonstrated good
[image:5.612.191.552.73.298.2]preser-vation of image details and microstructural information
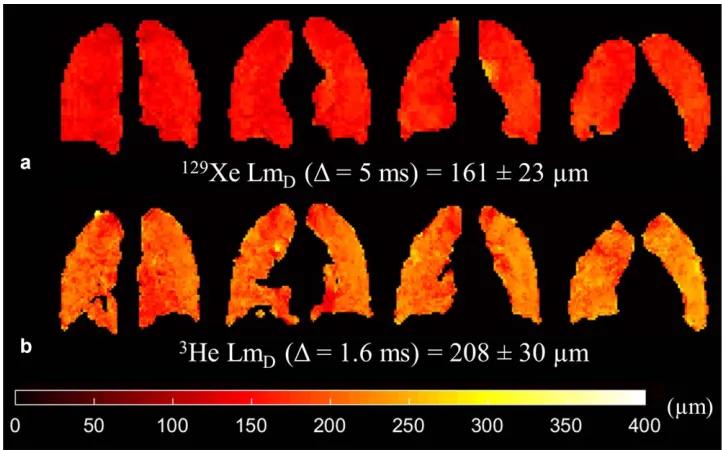
FIG. 3. Prospective CS results for a healthy volunteer (HV1) (SNR¼30). (a) Example 129Xe LmDmaps derived from 3D mul-tiple b-value 129Xe DW-MRI. (b) Example3He Lm
Dmaps in com-parative slices demonstrate the mismatch in LmD values between the two nuclei.
Table 2
Summary of Whole Lung Mean ADC and LmDValues for Four Healthy Volunteers Derived from Prospective 3D Multiple b-Value 129
Xe and3He DW-MRI With CS
Subjects
129Xe ADC (cm2/s) (D¼5 ms)
129Xe Lm D(mm) (D¼5 ms)
3He ADC (cm2/s) (D¼1.6 ms)
3He Lm D(mm) (D¼1.6 ms)
HV1 0.03360.012 161623 0.18260.085 208630
HV2 0.03960.012 176620 0.19660.077 223624
HV3 0.03060.011 157619 0.16660.068 205623
[image:5.612.60.554.685.752.2]with increased undersampling. MAE and MAEADCvalues
from129Xe CS simulations were similar to those reported with 3He (10). The presence of image blurring in the
fully sampled 129Xe images is likely the result of elliptical-centric phase encode ordering used with129Xe
in contrast to sequential encoding used previously with
3He. Elliptical-centric phase encoding maximizes SNR at
the consequence of increased image blurring with a RF depolarizationk-space filter that originates from the cen-ter of k-space (27). The full width at half maximum val-ues of retrospectively undersampled 129Xe ADC histograms decreased with AF; this trend matches the results of 3He CS simulations (10) and demonstrates decreased spatial heterogeneity associated with the de-noising reconstruction process of CS. However, this loss of spatial heterogeneity did not result in a statistically significant difference between fully sampled ADC and undersampled CS ADC maps.
Prospective three-fold undersampled 3D multiple b-value129Xe DW-MRI was acquired in four healthy
volun-teers at D¼5 ms. The difference ofþ1.2% between CS
(0.0329 cm2/s) and fully sampled mean 129Xe ADC (0.0325 cm2/s) for one volunteer (HV1) was similar to the small differences we reported previously between fully sampled and CS undersampled 2D and 3D3He ADC val-ues (10,28). The whole lung mean129Xe ADC value for all four healthy volunteers (0.033 cm2/s) was also consistent with previously reported healthy subject ADC values, with b¼12 s/cm2 at 1.5 T (29). The observed mean LmD
mismatch of approximately 50mm between3He and129Xe suggests that the 129Xe diffusion time of D¼5 ms, previ-ously proposed for in vivo lung morphometry with the CM (18), is not applicable for129Xe lung diffusion length
scale measurements derived from the SEM.
Empirical Determination of Optimal129Xe Diffusion Time
[image:6.612.133.489.74.200.2]Mean129Xe ADC values (at b¼12 s/cm2) decreased non-linearly with increasing diffusion time; a trend observed previously in 3He ADC measurements (4,30). The loga-rithmic relationship observed between 129Xe ADC and diffusion time also matches the trend observed for 3He
FIG. 4. Global mean129Xe Lm
Dand ADC results at different129Xe diffusion times for one healthy volunteer. (a) A strong linear depen-dence in129Xe diffusion time and mean129Xe Lm
Dvalue was observed. At129XeD¼8.5 ms, the129Xe LmDmatches the volunteer’s cor-responding3He Lm
Dvalue. (b) Mean129Xe ADC decreases with increasing diffusion time in a nonlinear logarithmic relationship.
Table 3
Summary of129Xe Whole Lung SEM-Derived LmDand CM-Derived Lm Values for Healthy Volunteers, Ex-smokers, and COPD Patients Acquired With AF¼4 and129XeD
¼8.5 ms and Their Corresponding3He Mean Lung Morphometry Values (AF
¼3,3HeD
¼1.6 ms)
Subjects
Stretched Exponential Model Cylinder Model (3He-based) 129Xe Lm
D(mm) 3He LmD(mm) LmDDifference (%) 129Xe Lm (mm) 3He Lm (mm) Lm Difference (%) Healthy volunteers
HV1 205 208 1.4 183 183 0.0
HV2 218 224 2.7 222 210 þ5.6
HV3 206 205 þ0.5 196 171 þ12.5
HV4 200 210 4.8 173 178 3.1
HV5 192 205 6.3 164 170 3.6
Mean HV 204 210 2.9 188 182 12.3
Ex-smokers
ES1 232 234 0.9 259 222 þ14.3
ES2 230 234 1.7 254 240 þ5.3
ES3 234 236 0.8 266 250 þ6.0
ES4 245 246 0.4 326 335 2.7
ES5 221 231 4.3 222 226 2.1
ES6 217 215 þ0.9 217 201 þ7.2
Mean ES 230 233 1.2 257 246 14.7
COPD patients
COPD1 317 323 1.9 639 671 5.0
COPD2 251 263 4.6 318 381 19.8
Mean COPD 284 293 3.2 478 526 12.4
[image:6.612.59.553.518.753.2]ADC (30). The SEM-derived LmD values exhibited a
strong positive linear dependence withD over the range of 5–10 ms. The dependence of LmD on D reflects the
changes in the theoretical characteristic free diffusion lengths probed for each experiment. AtD¼10 ms, corre-sponding to the characteristic free diffusion length of
129Xe (pffiffiffiffiffiffiffiffiffiffiffiffi2D0D ¼530mm) which is identical to the free
diffusion length of 3He in air for the diffusion times used by Chan et al. (10), a mismatch of LmD values was
still observed in the data from three healthy volunteers (Fig. 7).
This mismatch suggests that even at the same charac-teristic free diffusion length there may be inherent differ-ences in the specific diffusion dephasing regime of the respective gas in the lung alveoli which makes this assumption of Gaussian relation between diffusion length and diffusion time inexact. The differences in dif-fusion dephasing regime stems from intrinsic properties (i.e., gyromagnetic ratio and diffusivity) of each gas, and
thus leads to different mechanisms that contribute to non-Gaussian diffusion signal behaviors that are not accounted for in the calculation of characteristic free dif-fusion length. For example, differences in the difdif-fusional dephasing regime due to microscopic background sus-ceptibility gradients may exist between129Xe and3He at the same field strength due to the smaller gyromagnetic ratio of129Xe. These effects on diffusive length scales are similar to the effect of different B0field strengths on3He
ADC values (5).
Benchmarking of Empirically Optimized
129
Xe Diffusion Time
The decision to further accelerate with four-fold under-sampling was motivated by the need to reduce the breath-hold duration incurred with129Xe diffusion
time-s>5 ms. To verify that good agreement in LmD values
[image:7.612.192.555.69.518.2]was obtained with three- and four-fold undersampling,
FIG. 5. Comparison of129Xe and 3
He example slice LmDmaps for a representative healthy, ex-smoker, and COPD subject. 129
Xe LmD maps derived using 3D multiple b-value 129Xe DW-MRI at an empirically optimized diffusion timeD¼8.5 ms demon-strate good agreement with 3He LmD maps. 3D
129
all five healthy volunteers were imaged with an addi-tional AF¼3 129Xe CS acquisition at129XeD¼8.5 ms. A slice-by-slice comparison of mean LmD values for the
five healthy volunteers was performed, and Bland-Altman analysis confirmed a mean bias of þ1.5% (þ2.9mm) for AF¼4. The 95% confidence interval of
6.9% toþ10.0% (13.4 to 19.3mm) was within typical standard deviation values of lung LmDvalues in healthy
volunteers. This slight increase in mean slice LmDvalues
obtained with AF¼4 is likely the result of CS recon-struction error associated with increased undersampling. In addition, the broad 95% confidence interval range could also be explained by inexact coregistration of image slices due to slight changes in subject position between the AF¼3 and AF¼4 scan sessions. However, the small increase in LmD justifies that implementation
of AF¼4 in prospective acquisitions with 129Xe D¼8.5
ms. The reduction of scan time to within 16 s is more tolerable for a wider range of subjects, therefore AF¼4 will be used in all subsequent 3D multiple b-value129Xe
DW-MRI acquisitions.
Using the empirically optimized diffusion time,129 Xe-derived LmD values demonstrated improved matching
with3He LmDat129XeD¼8.5 ms than at129XeD¼5 ms.
The mean difference between whole lung 129Xe and 3He LmDvalues across all subjects was2.2%, and the mean
bias in individual lung 129Xe LmD values was 2.1%. 129XeD¼8.5 ms was derived from preliminary data, and
this small bias may suggest that a different optimal diffu-sion time (slightly longer thanD¼8.5 ms) could be used
to bring the bias toward 0%. ConsideringD¼8.5 ms LmD
for HV1, a129Xe D¼9.1 ms was found to match the
vol-unteer’s3He LmD value (Fig. 7). Additionally, when the
previous 129Xe D¼5 and 8.5 ms results for HV2 and
HV3 are considered in conjunction with an additional acquisition at 129Xe D¼10 ms, a similar optimal
[image:8.612.116.500.72.336.2]diffu-sion time of around 9 ms was obtained as well (Fig. 7).
FIG. 7. Mean129Xe Lm
D results at different 129Xe diffusion times for three healthy volunteers. A strong linear dependence in129Xe diffusion time and mean129Xe Lm
D value was obtained for HV1 (r¼0.98, P¼0.015). When the D¼8.5 ms results for HV1 was considered, the diffusion time D¼9.1 ms corresponded to the subject’s 3He Lm
[image:8.612.327.539.527.675.2]Nevertheless, the observed bias of 2.1% is equivalent to the same-day reproducibility error (2.1%) (31) of Lm values calculated from multiple b-value 3He DW-MRI
using the CM. This indicates that any mismatch between
3He and 129Xe Lm
D values at the129Xe D¼8.5 ms is of
the order of same-day reproducibility error, and we con-clude that comparable lung morphometry maps can be obtained with129Xe.
One limitation of this study is that the129Xe diffusion time was optimized based upon the LmD results from
healthy volunteers only. In subjects with emphysema-tous changes to alveolar length scales, a different rela-tionship between 129Xe LmD and diffusion time may
exist. However, the strong agreement between129Xe and
3He Lm
Dresults from the subsequent prospective
acquis-itions in healthy volunteers, ex-smokers, and COPD patients suggests that 129Xe D¼8.5–9 ms is valid across a range of alveolar sizes subject to age and smoking-related emphysema.
The empirically optimized 129Xe D¼8.5 ms used in
our study is significantly longer than the diffusion time used in other 129Xe lung morphometry studies. In Suk-stanskii and Yablonskiy (18),129XeD¼5 ms was chosen and CM phenomenological expressions for acinar airway geometrical parameters were also recalibrated for 129Xe such that lung morphometry results matched those of
3He. However, it was noted that if the same theoretical
free diffusion length is probed with both nuclei, the3
He-based phenomenological expressions can be applied to derive 129Xe lung morphometry parameters (18). In a small subset of the preliminary study cohort (HV1–HV4), the assumption that, like the SEM, the CM will yield more comparable lung morphometry results at 129Xe
D¼8.5 ms than with 129Xe D¼10 ms was explored. 129Xe
D¼8.5 and 10 ms data were analyzed with 3 He-based CM parameters, and derived Lm was compared with3He-derived Lm values. A mean difference of 4.3% was obtained between129XeD¼8.5 ms Lm and3He Lm,
whereas at 129Xe D¼10 ms the difference was larger (11.5%). These results, albeit in a small subset of sub-jects, support the implementation of the 3He-based CM with129Xe DW-MRI at129XeD¼8.5 ms.
The mean 3He Lm values for healthy volunteers (180mm), ex-smokers (250mm), and COPD patients (500mm) were consistent with previously reported3He Lm values (7,32,33). The mean129Xe Lm for ex-smokers
(with129Xe D¼8.5 ms) are also in agreement with
previ-ous129Xe Lm values reported at 3 T obtained with129Xe
D¼5 ms (20,21). The 129Xe Lm for the GOLD II COPD subject (318mm) is also comparable to the 129Xe Lm (350mm) reported in COPD patients (GOLD I-III) (20,21). When 129Xe Lm from the 129Xe D¼8.5 ms data
was evaluated with 3He-based CM, an overall mean dif-ference of þ1.1% and þ2.3% was obtained for whole lung and individual lung 129Xe and 3He Lm values, respectively. This small bias is of a similar magnitude as that observed with SEM-derived LmD and therefore
sug-gests that129Xe lung morphometry results obtained with
129Xe D¼8.5 ms are comparable to 3He results analyzed
with both the cylinder and stretched exponential models.
CONCLUSIONS
With limited availability of3He, there is a strong
motiva-tion to evaluate funcmotiva-tional and structural informamotiva-tion that can be derived from the readily available and cheaper129Xe gas isotope. Compressed sensing has facili-tated acquisition of single-breath 3D multiple b-value
129Xe DW-MRI for whole lung morphometry mapping.
SEM-derived LmD demonstrated a linear dependence
with diffusion time, and the best agreement between
129Xe and3He Lm
D results was obtained with an
empiri-cally optimized129XeD¼8.5 ms. Prospective CS
acquisi-tions were used to validate 129Xe D¼8.5 ms in healthy
volunteers, ex-smokers, and COPD patients, and a strong agreement (mean LmD bias of 2.2%) in129Xe and 3He
LmD values was obtained. A similar level of agreement
(mean Lm bias ofþ1.1%) was obtained with CM-derived Lm, indicating that 129Xe DW-MRI acquired with 129Xe
D¼8.5 ms is a viable alternative to 3He for 3D whole lung morphometry assessment with both cylinder and stretched exponential models.
ACKNOWLEDGMENTS
We thank Juan Parra-Robles for useful discussions of preliminary results.
REFERENCES
1. Saam BT, Yablonskiy DA, Kodibagkar VD, Leawoods JC, Gierada DS, Cooper JD, Lefrak SS, Conradi MS. MR imaging of diffusion of 3He gas in healthy and diseased lungs. Magn Reson Med 2000;44:174– 179.
2. Salerno M, Altes TA, Brookeman JR, de Lange EE, Mugler 3rd JP. Dynamic spiral MRI of pulmonary gas flow using hyperpolarized (3)He: preliminary studies in healthy and diseased lungs, Magn Reson Med 2001;46:667–677.
3. Ajraoui S, Parra-Robles J, Deppe M, Teh K, Parnell SR, Owers-Bradley J, Wild JM. Experimental Investigation of Non-Gaussian Dif-fusion in Hyperpolarized 3He MRI of Lungs. In Proceedings of the 17th Annual Meeting of ISMRM, Honolulu, Hawaii, USA, 2009. p. 2178.
4. Fichele S, Paley MN, Woodhouse N, Griffiths PD, van Beek EJ, Wild JM. Investigating 3He diffusion NMR in the lungs using finite differ-ence simulations and in vivo PGSE experiments. J Magn Reson 2004; 167:1–11.
5. Parra-Robles J, Ajraoui S, Marshall H, Deppe MH, Xu X, Wild JM. The influence of field strength on the apparent diffusion coefficient of 3He gas in human lungs, Magn Reson Med 2012;67:322–325. 6. Yablonskiy DA, Sukstanskii AL, Leawoods JC, Gierada DS, Bretthorst
GL, Lefrak SS, Cooper JD, Conradi MS. Quantitative in vivo assess-ment of lung microstructure at the alveolar level with hyperpolarized 3He diffusion MRI, Proc Natl Acad Sci U S A 2002;99:3111–3116. 7. Yablonskiy DA, Sukstanskii AL, Woods JC, Gierada DS, Quirk JD,
Hogg JC, Cooper JD, Conradi MS. Quantification of lung microstruc-ture with hyperpolarized 3He diffusion MRI. J Appl Physiol (1985) 2009;107:1258–1265.
8. Parra-Robles J, Marshall H, Hartley R, Brightling CE, Wild J. Quantifi-cation of Lung Microstructure in Asthma Using a 3He Fractional Dif-fusion Approach. In Proceedings of the 22nd Annual Meeting of ISMRM, Milan, Italy, 2014, p. 3529.
9. Shanbhag DD, Altes TA, Miller GW, Mata JF, Knight-Scott J. q-Space analysis of lung morphometry in vivo with hyperpolarized 3He spec-troscopy, J Magn Reson Imaging 2006;24:84–94.
10. Chan HF, Stewart NJ, Parra-Robles J, Collier GJ, Wild JM. Whole lung morphometry with 3D multiple b-value hyperpolarized gas MRI and compressed sensing, Magn Reson Med 2017;77:1916–1925.
12. Norquay G, Parnell SR, Xu X, Parra-Robles J, Wild JM. Optimized production of hyperpolarized 129Xe at 2 bars for in vivo lung mag-netic resonance imaging, J Appl Phys 2013;113:044908.
13. Norquay G, Collier GJ, Rao M, Maunder A, Rodgers OI, Stewart NJ, Wild JM. Large-Scale Production of Highly-Polarized 129Xe. In Pro-ceedings of the 25th Annual Meeting of ISMRM, Honolulu, Hawaii, USA, 2017. p. 2140.
14. Kirby M, Ouriadov A, Svenningsen S, Owrangi A, Wheatley A, Etemad-Rezai R, Santyr GE, McCormack DG, Parraga G. Hyperpolar-ized 3He and 129Xe magnetic resonance imaging apparent diffusion coefficients: physiological relevance in older never- and ex-smokers. Physiol Rep 2014;2:e12068.
15. Kirby M, Svenningsen S, Kanhere N, Owrangi A, Wheatley A, Coxson HO, Santyr GE, Paterson NA, McCormack DG, Parraga G. Pul-monary ventilation visualized using hyperpolarized helium-3 and xenon-129 magnetic resonance imaging: differences in COPD and relationship to emphysema. J Appl Physiol (1985) 2013;114:707–715. 16. Kirby M, Svenningsen S, Owrangi A, et al. Hyperpolarized 3He and
129Xe MR imaging in healthy volunteers and patients with chronic obstructive pulmonary disease. Radiology 2012;265:600–610. 17. Svenningsen S, Kirby M, Starr D, Leary D, Wheatley A, Maksym GN,
McCormack DG, Parraga G. Hyperpolarized (3) He and (129) Xe MRI: differences in asthma before bronchodilation. J Magn Reson Imaging 2013;38:1521–1530.
18. Sukstanskii AL, Yablonskiy DA. Lung morphometry with hyperpolar-ized 129Xe: theoretical background. Magn Reson Med 2012;67:856–866. 19. Ruppert K, Quirk JD, Mugler III JP, Altes TA, Wang C, Miller GW, Ruset IC, Mata JF, Hersman FW, Yablonskiy DA. Lung Morphometry Using Hyperpolarized Xenon-129: Preliminary Experience. In Pro-ceedings of the 20th Annual Meeting of ISMRM, Melbourne, Victoria, Australia, 2012, p. 3152.
20. Ouriadov A, Farag A, Kirby M, McCormack DG, Parraga G, Santyr GE. Lung morphometry using hyperpolarized (129) Xe apparent diffu-sion coefficient anisotropy in chronic obstructive pulmonary disease, Magn Reson Med 2013;70:1699–1706.
21. Ouriadov A, Farag A, Kirby M, McCormack DG, Parraga G, Santyr GE. Pulmonary hyperpolarized Xe morphometry for mapping xenon gas concentrations and alveolar oxygen partial pressure: proof-of-concept demonstration in healthy and COPD subjects. Magn Reson Med 2015;74:1726–1732.
22. Parra-Robles J, Ajraoui S, Wild JM. Modelling Non-Gaussian 3He Dif-fusion Signal Behaviour Using a Fractional Dynamics Approach. In
Proceedings of the 18th Annual Meeting of ISMRM, Stockholm, Swe-den, 2010. p. 2538.
23. Parra-Robles J, Marshall H, Wild JM. Characterization of 3He Diffu-sion in Lungs Using a Stretched Exponential Model. In Proceedings of the 21st Annual Meeting of ISMRM, Salt Lake City, Utah, USA, 2013. p. 820.
24. Berberan-Santos MN, Bodunov EN, Valeur B. Mathematical functions for the analysis of luminescence decays with underlying distributions 1. Kohlrausch decay function (stretched exponential). Chem Phys 2005;315:171–182.
25. Sukstanskii AL, Yablonskiy DA. In vivo lung morphometry with hyperpolarized 3He diffusion MRI: theoretical background. J Magn Reson 2008;190:200–210.
26. Woods JC, Choong CK, Yablonskiy DA, Bentley J, Wong J, Pierce JA, Cooper JD, Macklem PT, Conradi MS, Hogg JC. Hyperpolarized 3He diffusion MRI and histology in pulmonary emphysema. Magn Reson Med 2006;56:1293–1300.
27. Wild JM, Paley MN, Viallon M, Schreiber WG, van Beek EJ, Griffiths PD. k-space filtering in 2D gradient-echo breath-hold hyperpolarized 3He MRI: spatial resolution and signal-to-noise ratio considerations, Magn Reson Med 2002;47:687–695.
28. Ajraoui S, Lee KJ, Deppe MH, Parnell SR, Parra-Robles J, Wild JM. Compressed sensing in hyperpolarized 3He lung MRI. Magn Reson Med 2010;63:1059–1069.
29. Kaushik SS, Cleveland ZI, Cofer GP, et al. Diffusion-weighted hyper-polarized 129Xe MRI in healthy volunteers and subjects with chronic obstructive pulmonary disease. Magn Reson Med 2011;65:1154–1165. 30. Gierada DS, Woods JC, Bierhals AJ, et al. Effects of diffusion time on short-range hyperpolarized (3)He diffusivity measurements in emphy-sema. J Magn Reson Imaging 2009;30:801–808.
31. Quirk JD, Chang YV, Yablonskiy DA. In vivo lung morphometry with hyperpolarized (3) He diffusion MRI: reproducibility and the role of diffusion-sensitizing gradient direction. Magn Reson Med 2015;73: 1252–1257.
32. Quirk JD, Lutey BA, Gierada DS, Woods JC, Senior RM, Lefrak SS, Sukstanskii AL, Conradi MS, Yablonskiy DA. In vivo detection of aci-nar microstructural changes in early emphysema with (3)He lung morphometry. Radiology 2011;260:866–874.
![FIG. 1. CS simulation results for 3D (AF129Xe DW-MRI. Reconstructed magnitude image (b ¼ 0) for each AF, with corresponding MAE values ¼ 1; fully sampled dataset [SNR ¼ 25]).](https://thumb-us.123doks.com/thumbv2/123dok_us/7737782.164305/4.612.77.538.453.723/simulation-results-reconstructed-magnitude-corresponding-values-sampled-dataset.webp)