ABSTRACT
CHO, BUHYUNG. The Effect of Technology Driven Mergers and Acquisitions on Firm Performance in the U.S. Textile Industry. (Under the direction of Dr. Nancy Cassill and Dr. Marguerite Moore).
Today, technological innovation is pivotal to the success in the textile industry. In order to keep up with the pace of innovation, a growing number of textile companies are strategically acquiring technology assets through mergers and acquisitions (M&As). For the first time, this study examines the effect of technology driven M&As on firm performance in the U.S. textile industry between 1980 and 2015. The dataset is constructed by merging multiple sources including SDC Thomson One Bankers, The Center for Research in Security Prices (CRSP) database, and Compustat. To distinguish technology driven from non-technology driven M&As, target companies’ patent ownership is used as a primary factor. The sample includes 526 M&A
transactions, among which 192 transactions classified as technology driven M&As and 334 transactions classified as non-technology driven M&As. The analysis indicates that technology driven M&As are more active in terms of industry diversification and require significantly larger investment compared to non-technology driven M&As.
To compare the technology driven M&As’ stock performance with the non-technology driven M&As’ stock performance, traditional market model and Fama-French Three Factor
Model are applied in the short and long-term analysis, respectively. The results suggest that technology driven M&As enjoy a significant improvement in the stock performance immediately following the M&A announcement. Whereas non-technology driven M&As generate
acquiring firms’ financial profitability and operating efficiency after the M&A announcement.
However, the decline is more statistically significant among the acquiring firms involved in the non-technological M&As.
The Effect of Technology Driven Mergers and Acquisitions on Firm Performance in the U.S. Textile Industry
By Buhyung Cho
A dissertation submitted to the Graduate Faculty of North Carolina State University
in partial fulfillment of the requirements for the degree of
Doctor of Philosophy
Textile Technology Management
Raleigh, North Carolina 2019
APPROVED BY:
_______________________________ _______________________________ Dr. Nancy Cassill Dr. Marguerite Moore
Committee Co-Chair Committee Co-Chair
DEDICATION To my parents, JM Jo & YH Kim
and to my husband,
BIOGRAPHY
Buhyung Cho was born in 1989 in Seoul, South Korea. She graduated from Darlington School in Rome, Georgia in 2008. She went on to study at Boston College in Chestnut Hill, Massachusetts and graduated with a Bachelor of Science in Accounting in 2012. She also studied at Hong Kong University of Science and Technology for a semester in 2010 while on a study abroad program. She then moved to Seoul, South Korea and worked for J.P. Morgan Securities. In 2013, she successfully passed the Uniform CPA (Certified Public Accountants) Examination. Buhyung returned to the United States in 2015 to pursue her doctorate degree in Textile
ACKNOWLEDGEMENTS
TABLE OF CONTENTS
LIST OF TABLES ... vii
LIST OF FIGURES ... viii
INTRODUCTION ...1
Purpose of the Study ...2
Significance of the Research ...3
LITERATURE REVIEW ...5
U.S. Textile Industry ...5
Mergers and Acquisitions ...7
Technology Driven Mergers and Acquisitions ...9
Innovation Indicators ...11
Event Study Methodology ...13
METHODOLOGY ...15
Data Collection ...15
Analysis ...18
Research Objective One (RO1) ...18
Research Objective Two (RO2) ...20
Research Objective Three (RO3) ...25
RESULTS ...27
Sample Description ...27
Research Objective One (RO1) ...30
Target Firm Variables ...30
Acquiring Firm Variables ...33
M&A Deal Type Variables ...34
Research Objective Two (RO2) ...37
Short-term Analysis ...37
Long-term Analysis ...41
Research Objective Three (RO3) ...44
Financial Profitability Analysis ...44
Operating Efficiency Analysis ...49
CONCLUSIONS ...54
Implications ...56
Limitations ...58
REFERENCES ...62
APPENDICES ...71
Appendix A: Variable definitions ...72
Appendix B: Technological vs. Non-Technological M&A cases (1980-2015) ...73
Appendix C: Sample description by acquiring company’s primary SIC codes ...74
Appendix D: TOP 10 Most active acquiring companies by M&A count ...75
Appendix E: Target firm ownership type ...75
Appendix F: List of M&A transactions (private target firms) ...76
Appendix G: Technological M&A cases identified in media search ...77
Appendix H: Cross-border M&A cases: target firm country of origin (1980-2015) ...77
Appendix I: List of target firm country of origin by M&A count ...78
Appendix J: Industry diversification - TOP 20 ...79
LIST OF TABLES
Table 3 - 1. Criteria for selecting M&A case samples ... 16
Table 3 - 2. List of Variables by Firm and M&A Deal Characteristics ... 19
Table 4 - 1. Sample Distribution Sorted by M&A Announcement Year (1980-2015)... 29
Table 4 - 2. Distribution of target firm characteristic variables ... 32
Table 4 - 3. Chi-squared test results: Target firm characteristic ... 32
Table 4 - 4. T-tests results: Acquiring firm characteristics ... 34
Table 4 - 5. T-tests results: M&A Deal Characteristics (Value of Transaction) ... 35
Table 4 - 6. Chi-square tests results: M&A Deal Characteristics ... 36
Table 4 - 7. T-tests results: M&A Deal Characteristics (Deal attitude & Consideration Type) ... 36
Table 4 - 8. T-tests for Short-Term Stock Performance (Traditional Market Model) ... 38
Table 4 - 9. T-tests for Long-Term Stock Performance (Fama-French Three Factor Model) ... 42
Table 4 - 10. Mean value of financial profitability measures pre and post M&A ... 45
Table 4 - 11. Two-sample t-test of financial profitability measures ... 46
Table 4 - 12. Mean value of financial profitability measures (-5 to +5 years) ... 47
Table 4 - 13. Mean value of operating efficiency measures: pre and post M&A ... 50
Table 4 - 14. Two-sample t-test of operating efficiency measures ... 51
LIST OF FIGURES
Figure 3 - 1. Technological & Non-technological M&A Classification Flowchart ... 18
Figure 4 - 1. Technological & Non-Technological M&A Classification Results ... 27
Figure 4 - 2. Number of M&A cases in the U.S. Textile Industry (1980-2015) ... 28
Figure 4 - 3. Short-term Stock Performance (-1 to 10 Days)... 40
Figure 4 - 4. Short-term Stock Performance (-1 to 120 Days)... 40
Figure 4 - 5. Long-term Stock Performance (-12 to 60 Months) ... 43
Figure 4 - 6. Financial Profitability: ROA, ROE, and OCF (-5 to +5 years) ... 48
INTRODUCTION
The effect of mergers and acquisitions (M&As) on firm performance of the acquiring company is one of the most researched areas in financial management. Traditionally, M&A research focuses on the antecedents (e.g., motives) and outcomes (e.g., profitability) of M&As among diverse industries. However, recent M&A research is limited in both frequency and scope, particularly related to its consideration of outcomes in contemporary markets increasingly driven by technology and innovation. In 2017, Deloitte reported that M&As in the U.S. achieved their highest annual level with a total of 15,000 cases. The same report suggests that technology acquisition is a primary motive for engaging in M&A activities among U.S. firms.
The U.S. textile industry weakened significantly during the second half of the twentieth century due to globalization and related post-industrial forces and is commonly depicted as an industry in decline. However, niches within the industry that managed to innovate survived this decline and remain viable in global markets (e.g., smart textiles, carbon fibers, and wearable technology) (Tao, 2001). Additionally, recent government efforts to revitalize domestic textile manufacturing suggests a new emphasis on the industry which is likely to be driven by new technologies and innovation.
From a strategic point of view, technology acquisition through M&As are advantageous due to their efficiency and effectiveness for expanding technological capabilities compared to conventional in-house R&D (Bower, 2001). In fact, industries outside of textiles such as chemicals and high-tech indicate success creating wealth through technology-driven M&As (Ahuja and Katila, 2001). In order to understand the potential value of innovation in M&A activities among U.S textile firms, this study provides a tool for measuring financial
performances of identifying their impact on company performance through firm’s financial performance.
Purpose of the Study
The purpose of the study is to provide a comprehensive empirical analysis on the effect of technology-driven mergers and acquisitions on the value of acquiring firms within the U.S. textile industry. The following research objectives are stated to address the research purpose: Research Objective I (RO1): To examine the characteristics of technological M&As in the U.S. textile industry including consideration of target and acquiring firm, and M&A deal
characteristic variables.
Research Objective II (RO2): To examine effect of technological versus non-technological M&A on acquiring firms’ stock performance based on short and long-term cumulative abnormal
returns (CARs).
Significance of the Research
This industry-focused empirical analysis is unique and meaningful in two primary aspects: First, the research places emphasis on technology in the textile industry which is
commonly regarded for its lack of technological advancement. M&A related studies are actively conducted in other industries such as pharmaceutical and high-tech industries to understand their strategic impact. However, despite the growing interest and investment in new technologies in the textile sector, research into the impacts of these technologies on short and long-term financial performance in the industry are not keeping up with the pace of innovation. By exploring how acquiring firms’ financial performance and the stock market behave regarding new technologies and innovations using extensive secondary data, this study provides a comprehensive overview of technological M&A activities among firms in the U.S. textile industry.
The second primary feature of this research arises from its scope. A comprehensive sample-period covering all U.S. textile M&As from 1980 to 2015 is implemented for the research. This approach provides an understanding of past M&A activities as well as recent M&A activities.
The inclusion of recent M&A cases in the sample reflects current trends in technological M&A activities while the historical data provides a basis for comparison. According to Sudarsanam (2003), M&As in the twenty-first century possess significantly different characteristics compared to the M&As prior to 2000. Deloitte (2017) notes that recent M&A transactions focus on
technology and innovation opposed to past M&A transactions that focus on economies of scale and market expansion.
more informed M&A decision-making and integration of technology. Specifically, the findings will provide insight into unique target firm characteristics (e.g., ownership type, country of origin), acquiring firm characteristics (e.g., total assets, ROA), and M&A deal characteristics (e.g., the total value of the transaction, payment method) among technological M&As with positive financial outcome. Further, the research links technological versus non-technological M&As to acquiring firm’s financial performance in the textile industry for the first time. Similarly, potential investors can also benefit from the outcomes of this study by making better-informed investment decisions.
LITERATURE REVIEW
U.S. Textile Industry
The history of the textile industry in the United States provides a frequently used example of the vulnerabilities of labor-intensive manufacturing in the global economy (G. Harrison, 2004; Minchin, 2012; Parrish, Erin D., 2016). For much of the twentieth century, the U.S. textile industry was an important part of the nation’s economy and a significant contributor to
manufacturing output. However, the dissemination of global supply chains supported by low-cost labor in developing nations strongly contributed to the migration of textile manufacturing to countries outside of the U.S. (Minchin, 2012; Parrish, Erin, Berdine, Cassill, & Oxenham, 2008; Singletary & Winchester Jr, 1998). To date, the U.S. consumer market is heavily reliant on inexpensive textile and apparel imports from China as well emerging supplier countries with low-wage labor such as Bangladesh, Vietnam, and Cambodia (G. Harrison, 2004).
However, in recent years, the economists and business practitioners are observing the changing dimensions of global textile manufacturing. The cost of manufacturing in China and other South Asian countries increased significantly along with their respective economic
development. Also, though the U.S. continues to rely on the global supply chain for textiles that are marketed in mass, examples of domestic companies with niche products or advanced
Researchers have long agreed that innovation is critical to the future viability of the U.S. textile industry (Lohr, 2016). Singletary (1998) and Parrish et al. (2008) support this view by reporting that competitive advantages in the U.S. textile industry arise from high-quality products based on intensive R&D activities, marketing, and customer service. Unlike other sectors of the industry such as apparel and retail, the textile sector is more capital intensive and highly automated which makes innovation and new technology crucial (Nordas, 2004). Also, U.S. production of technical textiles, which requires advanced technological processes, typically generates higher profit margins and enjoys higher barriers to competition (Carrigg & Alarid, 2016).
With continued emphasis on new technology and innovation and governmental support, the U.S. textile industry has entered into the new chapter of revitalization after the long years of mass imports and off-shoring. In fact, in 2017, the value of U.S. man-made fiber and filament, textile, and apparel shipments totaled an estimated $77.9 billion which is an increase of 16 percent since 2009 and the investment in capital assets (e.g., textile machinery) has more than doubled from $960 million in 2009 and $2.1 billion in 2016 (U.S. Census Bureau, 2017) (Appendix K). Also, U.S. textile producers are gradually reshoring manufacturing given the advantages of being closer to the headquarter offices, major consumer markets and advanced automation systems with comparably low energy cost. Beyond U.S.-based firms reshoring, a number of foreign-based textile firms (e.g., Keer Group and Sun Fiber) recognize the advantages of operating plants in the U.S. and have already invested or in the process of doing so in
manufacturing is slowing moving away from activities which overlap with low-wage countries and moving towards activities that are more consistent with U.S. comparative advantages.
In order to achieve innovation, firms may develop capabilities in-house, or they may pursue other paths such as mergers and acquisitions. In the following section, the strategic outcomes of M&A as they relate to innovation (i.e., technology-driven M&A) are considered based on empirical inputs from industries outside of textiles and apparel that demonstrate these impacts.
Mergers and Acquisitions
Mergers and Acquisitions (M&As) refer to business transactions between two companies where the merger is a legal consolidation of the two entities into one entity, and acquisition is a corporate action when one entity takes the ownership of another entity’s stock, equity interest, or
response for both acquiring and target companies during the announcement period and which also lead to improvement in operating performance.
Other researchers, however, assert that M&A activities do not positively influence acquiring firm’s performance, but rather create risk (Cartwright & Schoenberg, 2006; King,
Dalton, Daily, & Covin, 2004; Ravenscraft & Scherer, 1989). Agrawal and Jaffe (2000) argue that shareholders in acquiring companies are more likely to experience stock underperformance after the announcement of M&A. Similarly, Mitchell and Stafford (2001) examined 2,068 M&A transactions announced between 1961 and 1993 and indicated significantly negative monthly abnormal returns for a three-year window, using calendar-time abnormal returns based on the Fama-French three-factor model. Andre et al. (2004) examined the long-term performance of 267 Canadian M&A cases that take place between 1980 and 2000 and concluded that the three-year post-M&A returns for Canadian acquirers underperform significantly on an equal-weighted basis. Also, Schoenberg (2006) points out that only 44-56 percent of M&A cases are judged to be successful when considering different variables (e.g., cumulative abnormal returns and managers’ assessment).
Some researchers also studied the outcome of cross-border M&A cases. Black et al. (2001) noted a significantly negative abnormal returns to US-based acquirers during the three and five years following the cross-border M&A announcement. Likewise, Gugler et al. (2003) indicated that cross-border M&A tends to lead a significant decrease in the market value of the acquiring firm over the five post-M&A window period.
In terms of target firm’s ownership type, Capron and Shen (2007), after surveying 92
tend to provide more value-creating opportunities for exploiting private information. Since the U.S. textile industry is also experiencing the increasing number of private target firms involved in M&A activities (Appendix E), an analysis relates to target firm’s organization type will contribute to existing literature and benefit business practitioners for a better understanding of the currents trends of technological M&As in the U.S. textile industry.
To date, the impact of M&A on company financial performance has been studied extensively in various industries. In 2007, Hassan et al. examined 405 M&A cases within the U.S. pharmaceutical industry between 1981-2004 and concluded that M&A positively impacts wealth creation for acquiring company shareholders in the pharmaceutical industry with the evidence of short and long-term abnormal returns. Likewise, Laabs and Schiereck (2010) analyzed 230 M&A cases in the automotive supply industry between 1981-2007 and reported significantly positive short-term returns for the acquiring companies after the announcement. Pharmaceutical and high-tech industries are most often used as a sample industry to study M&A activities due to their extensive involvement in M&A and their global presence (Hassan, Patro, Tuckman, & Wang, 2007). In contrast to the other industries, only a limited number of studies focus the impact of M&A in the global textile industry, with no evidence of inquiry into the relevant behaviors of U.S. firms.
Technology Driven Mergers and Acquisitions
consumption, these technology impact the whole economy (Kengelbach et al., 2017). In order to quickly adopt new technologies and advance current operations, an increasing number of
companies purchase innovativeness outright, rather than develop this asset within the company over time. In 2008, Tsai and Wang conducted empirical analysis on 341 Taiwanese
manufacturing firms from 1998 to 2002 and reported a significantly positive correlation between external technology acquisition and the level of internal R&D efforts.
Reflecting current M&A trends, the interest for technology-oriented targets has significantly increased among acquiring firms (Cristerna et al., 2017; Deloitte, 2017). In fact, technology-driven M&A cases represent more than 30 percent of completed global M&A transactions during 2016 ($2.5 trillion total) and are expected to continue to increase in 2017 (Kengelbach et al., 2017).
According to Rebera and Kirca (2012), increases in new technology development and innovation positively impacts firm value and overall financial position. This finding is
pronounced among larger firms, firms that invest more in advertising, and firms in high-tech industries. Similarly, Hult et al. (2004) found that innovativeness is an important determinant of business performance and company success and is robust to market turbulence using a cross-sectional survey of U.S. firms (N=181).
whereas smaller firms are more likely to engage in M&A as an exit strategy in response to financial trouble. Therefore, non-technology driven M&As logically do not focus on
innovativeness and research capability among targets and likewise do not expect improvement in innovative outputs following the transaction (Ahuja & Katila, 2001).
In recent years, many researchers and business practitioners recognize that accelerated technological development leads to shorter product life cycles (Wu, Aytac, Berger, &
Armbruster, 2006). From a financial standpoint, this rapid rate of innovation introduces greater risk when firms obtain new technologies through M&As.
Innovation Indicators
In order to measure a firm’s knowledge base and its innovative orientation, academic researchers use various measures. Hagedoorn and Cloodt (2003) list R&D expenditures, patent counts, patent citations, and new product announcements as major indicators of company innovation performance and point out that these indicators are often used individually or combined to measure innovation performance.
Among the innovation indicators listed in Hadgedoorn and Cloodt’s study, R&D and patent data are the two most popular and widely accepted metrics used to measure the
innovativeness of a firm for both academic and practical purposes (Kleinknecht, Van Montfort, & Brouwer, 2002).
year) under current financial systems, and 2) inclusiveness of firm growth, employment, profit and current technology performance (Hagedoorn & Cloodt, 2003; Kleinknecht et al., 2002).
Patent data, the innovation indicator used in this study, also presents significant
advantages and disadvantages. Similar to R&D expenditures, patent data can be easily obtained and accessed through various public resources such as the United States Patent and Trademark Office (USPTO). In addition, Ernst (2003) argues that patent data reflects the timely recognition of technological changes which allows users to easily assess a firm’s technology portfolio and
the attractiveness of its technologies, to identify external sources for knowledge generation, and to evaluate important market partners. Therefore, patent data should be highly regarded as a meaningful innovation indicator from both strategic and technological perspectives.
By contrast, the disadvantages of using patent data as an innovative indicator include, as Kleinknecht (2002) suggested, the patent’s failure to capture any non-patentable inventions and innovations as some types of technology is not patentable by its nature. Also, every patent carries different economic and commercial value which vary greatly based on firm size and industry sector (Cohen & Levin, 1989; Griliches, 1998; Kleinknecht et al., 2002) According to Arundel and Kabla’s (1998) survey of 1,993 industrial firms in Europe, larger firms and firms in
to be used in research whereby disadvantages are minimized by limiting the research scope to a single or closely-related industry (Basberg, 1987; Cohen & Levin, 1989; Griliches, 1991).
Event-Study Methodologies
An event-study refers to the empirical analysis on stock prices which experienced a significant event. The examples for those events include M&As, earnings announcements, new debt or equity issues and repurchases, and macro announcements (e.g., GDP). The purpose of an event-study is to assess the impact of events on the value of firm’s security by estimating the abnormal return of a company. Ball and Brown (1968) defined ‘abnormal return’ as the difference between the actual return and the normal return. Specifically, the abnormal return refers to the return generated by a given stock or portfolio over a period of time which is higher than the return generated by its benchmark model or the return predicted by an equilibrium model such as capital asset pricing model (CAPM) (Ball & Brown, 1968).
Unlike short-term analysis, long-term event studies have a number of methodological concerns raised by many researchers (Andrade et al., 2001; Barber & Lyon, 1997; Fama, 1998). After an extensive simulation analysis of multi-year abnormal returns, Kothari and Warner (1997) indicated that long-term abnormal returns around firm-specific event are severely mis-specified and requires extreme caution when implemented. According to Kothari and
Warner(1997)’s simulation results, the rejection frequencies using parametric tests exceed 30 percent when the significance level of the test is 5 percent. Likewise, Brav (2000) insisted that abnormal return measures are incompetent to be applied in long-term event studies due to its lack of independence and normal distribution characteristic. Therefore, many long-term analysis models including Fama-French Three-factor model are inconsistent with the results and not statistically reliable. Given the methodological shortcomings, long-term expected returns can only be roughly estimated which then also reduces the preciseness of abnormal return
estimations for long-term event studies.
METHODOLOGY
A secondary data analysis comprised of inputs from various sources addresses the study’s objectives. The sections below present the approaches to data collection organized by objective and relevant data sources. Following the data descriptions, analytical methods and measures for each objective are presented.
Data Collection
To address research objectives, M&A specific data for the study are accessed from the Thomson ONE Banker’s SDC Platinum database for the 35-year period (1980-2015). The
Thomson One Banker database includes records of M&A activities for U.S. companies in both domestic and international markets. The database considers the announcement date of a merger as its origin and the effective date as its culmination. For the purposes of this research,
announcement date records are used to identify relevant M&A cases in order to mark the point in time that may have influenced company’s financial performance. We further require that the M&A transaction is completed, and the acquiring firm is a U.S. publicly traded company listed on the Center for Research in Security Prices (CRSP) and Compustat databases during the event window.
Except Cellulosic (2824), and Chemicals and Chemical Preparations (2899) (Appendix C). In addition to the primary Textile Mill Products SIC codes (2200-2299), three additional codes from the Chemical Sector are added to the sample because they include chemical-based textile firms which use different SIC codes (e.g., The DowChemical, Dupont). To ensure that selected firms among the SIC codes outside of Textile Mill Products (2200-2299) are textile related firms, a text filter on ‘Acquiror full business description’ in the database is applied to reflect one of the following keywords: fiber, polymer, textile, yarn, woven, and non-woven.
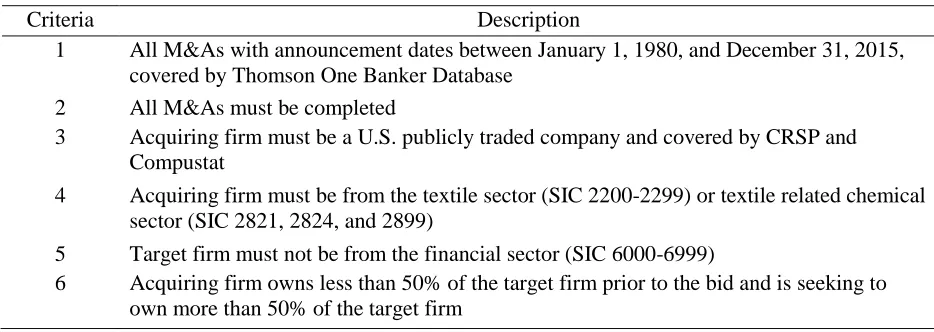
Table 3 - 1. Criteria for selecting M&A case samples
Criteria Description
1 All M&As with announcement dates between January 1, 1980, and December 31, 2015, covered by Thomson One Banker Database
2 All M&As must be completed
3 Acquiring firm must be a U.S. publicly traded company and covered by CRSP and Compustat
4 Acquiring firm must be from the textile sector (SIC 2200-2299) or textile related chemical sector (SIC 2821, 2824, and 2899)
5 Target firm must not be from the financial sector (SIC 6000-6999)
6 Acquiring firm owns less than 50% of the target firm prior to the bid and is seeking to own more than 50% of the target firm
exclusively on patent data from the U.S. system for its consistency, reliability, and
comparability. Initially, records are classified as technological if the target firm granted any patent during the five years preceding the acquisition announcement date. All patent records are accessed and hand-collected from The National Bureau of Economics (NBER) for patents filed between 1980 and 1999 and Google Patent Search for patents filed after 2000. The five-year period for the patent search is based on direction from past research which suggests that knowledge capital tends to depreciate significantly and commonly loses its value within five years (Argote, 2012).
Additionally, relevant news contents and archives on US Newsstream database are examined to determine whether the acquiring firm reported technology as a motivating factor for the acquisition, or whether the technology was a part of the transferred assets. The records are then classified as technological if the relevant news article confirms. The consulted media sources include Wall Street Journal, Chemical Week, Business Wire, and PR Newswire (Appendix G).
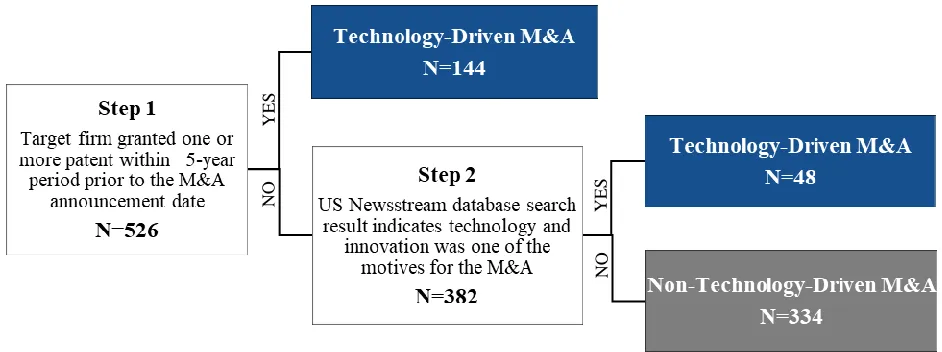
Figure 3 - 1. Technological & Non-technological M&A Classification Flowchart
Analysis
Research Objective One (RO1). For a better understanding of technology driven M&As in the U.S. textile industry, the study contrasts technological versus non-technological M&As based on three categories of variables: target firm (A), acquiring firm (B), and deal
characteristics (C) (Table 3.2). The study employs t-tests to measure the differences in
technological versus non-technological M&As for continuously measured variables, while chi-square tests measure the differences in technological versus non-technological M&As for nominal variables.
YE
S
YES
NO
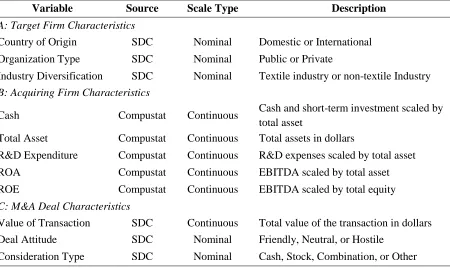
Table 3 - 2. List of Variables by Firm and M&A Deal Characteristics
Variable Source Scale Type Description
A: Target Firm Characteristics
Country of Origin SDC Nominal Domestic or International
Organization Type SDC Nominal Public or Private
Industry Diversification SDC Nominal Textile industry or non-textile Industry B: Acquiring Firm Characteristics
Cash Compustat Continuous Cash and short-term investment scaled by
total asset
Total Asset Compustat Continuous Total assets in dollars
R&D Expenditure Compustat Continuous R&D expenses scaled by total asset
ROA Compustat Continuous EBITDA scaled by total asset
ROE Compustat Continuous EBITDA scaled by total equity
C: M&A Deal Characteristics
Value of Transaction SDC Continuous Total value of the transaction in dollars
Deal Attitude SDC Nominal Friendly, Neutral, or Hostile
Consideration Type SDC Nominal Cash, Stock, Combination, or Other
H0: μ1 = μ2 Ha: μ1 ≠ μ2
μ1 is the mean of target firm, acquiring firm, and deal characteristic variables of technological
M&As and μ2 is the mean of target firm, acquiring firm, and deal characteristic variables of non-technological M&As.
Research Objective Two (RO2). RO2 examines shareholder gains among acquiring firms for both technological and non-technological M&A categories and identifies whether one group suggests significant gains over the other, in both short and long-term. Shareholder gains are measured using estimated ‘abnormal returns’ which are traditionally applied to estimate value creation (or destruction) resulting from an M&A in finance research (Andrade et al., 2001; Brown & Warner, 1985; Moeller et al., 2003). An abnormal return refers to the excess return that cannot be explained by expected return models, such as the Capital Asset Pricing Model
(CAPM) or any other accepted factor models (Binder, 1998; Boehmer, Masumeci, & Poulsen, 1991).
In order to measure the immediate stock market reaction to an M&A announcement (short-term effect), the traditional market model (Equation 3.1) with a value-weighted market index is applied in this study. The traditional market model is generally used as a single
benchmark model in modern event studies (e.g., M&As, IPOs). Unlike long-term analysis where event window is in years, rather than days, minimal differences in results are recognized across different factor models because expected returns are virtually zero regardless of which model of expected return is applied. The traditional market model to estimate abnormal returns is
𝑅𝑖,𝑡 = 𝑎̂𝑖 + 𝛽̂𝑖𝑅𝑚,𝑡+ 𝜀𝑖,𝑡
Equation 3.1: Traditional Market Model to estimate abnormal return
𝑅𝑖,𝑡 is the return for the firm i on day t and 𝑅𝑚,𝑡 refers to return from the CRSP value-weighted
market index. The error term in the regression is denoted by 𝜀𝑖,𝑡.
When using any factor model to estimate abnormal returns, the following underlying assumptions are made: 1) the market is efficient in the sense that stock price impact of an event (M&A) should be immediate, with no abnormal returns appearing in later, 2) the event is
unexpected, any anticipated component of the event will lead to an underestimation of an impact, and 3) the normal expected returns from the traditional market model is at an appropriate level.
Following Hassan et al. (2007), two event windows are constructed for the short-term analysis: one window that occurs immediately before and after the announcement and another longer-term window that provides adequate data for normal expected returns. Specifically, the first window occurs one-day before and after the announcement date (-1, +1). The second, longer window begins 281 days prior and ends 30 days prior to the announcement (-281, -30) which establishes a normal expected returns parameter for the market model (Equation 3.1).
Then, the abnormal return for each day for each firm is obtained in Equation 3.2.
𝐴𝑅𝑖,𝑡 = 𝑅𝑖,𝑡− (𝑎̂𝑖 + 𝛽̂𝑖𝑅𝑚,𝑡)
Equation 3.2: Abnormal return equation for each day of the event
𝑎̂𝑖 and 𝛽̂𝑖 are estimated value from Equation 1 using data from the parameter window previously
Then, abnormal returns are averaged for each day across firms (where t=0 is the announcement day), and cumulative abnormal returns (CARs) are calculated by summing average abnormal returns for the entire event window in Equation 3.3. For short-term stock performance analysis, six event windows are constructed and examined: 1) one day before the announcement date to one day after the announcement date (-1, +1) 2) the announcement date to one day after the announcement date (0, +1) 3) the announcement date to ten days after the announcement date (0, +10) 4) one day after the announcement date to thirty days after the announcement date (+1, +30) 5) one day after the announcement date to one hundred twenty days after the announcement date (+1, +120) 6) thirty one days after the announcement date to one hundred twenty days after the announcement date (+31, +120).
𝐶𝐴𝑅𝑖 = ∑ 𝐴𝑅𝑖𝑡 𝑡
Equation 3.3: Cumulative abnormal return equation for each from over the entire event window
According to McKinlay (1997), CARs are regarded as one of the most unbiased
assessment measures when identifying the impact of an event on firm’s market value. In contrast to Hassan’s methodology, in instances that an overlapping event (M&A announcement) is
identified during the parameter window (-281, -30), the case will be excluded from the sample to mitigate potential bias. Also, in order to minimize the influence of outliers and improve the statistical efficiency, the winsorization technique is applied in this analysis. This technique replaces mean which exceed the 99th percentile with the mean value of the 99th percentile.
years, rather than days. Therefore, consistent with previous M&A research, the study also considers the long-term effects of M&As on shareholder value. However, there are a number of methodological concerns with long-term event studies related to statistical reliability and the assumption that abnormal returns are independent across firms (Andrade et al., 2001; Barber & Lyon, 1997; Fama, 1998). Despite the uncertainty, buy-and-hold abnormal returns and calendar time portfolio approaches are the two most generally accepted methods in modern studies (Lyon, Barber, & Tsai, 1999). Between the two approaches, the calendar time portfolio approach
(Equation 3.4), introduced by Jaffe (1974) and advocated by Mitchell and Stafford (2001) and Fama (1998), is selected for the long-term analysis (RO3) in this study due to its utility for controlling cross-sectional dependence problems.
The Fama-French Three Factor model is presented in Equation 3.4.
𝑅𝑝,𝑡 − 𝑅𝑓,𝑡 = 𝑎̂𝑖 + 𝛽̂𝑖(𝑅𝑚,𝑡− 𝑅𝑓,𝑡) + 𝑠(𝑝)𝑆𝑀𝐵𝑡+ ℎ(𝑝)𝐻𝑀𝐿𝑡+ 𝜀𝑖,𝑡
Equation 3.4: Fama-French Three Factor Model
𝑅𝑝,𝑡 − 𝑅𝑓,𝑡 refers to the portfolio excess return at time t where 𝑅𝑝,𝑡 is the monthly return on the
calendar-time portfolio from the value-weighted index, and 𝑅𝑓,𝑡 is the monthly return on
three-month Treasury bills. 𝑅𝑚,𝑡 is the return on a value-weighted market index. 𝑆𝑀𝐵𝑡 is the
difference in the returns of value weighted portfolios of small-firm stocks and big-firm stocks,
𝐻𝑀𝐿𝑡 is the difference in the returns of value-weighted portfolios of high book-to-market stocks
and low book-to-market stocks. The regression yields parameter estimates of 𝑎̂𝑖, 𝛽̂𝑖, 𝑠(𝑝), and ℎ(𝑝). The error term in the regression is denoted by 𝜀𝑖,𝑡. Statistical significance is tested by
For the long-term analysis, a portfolio for each period must be first constructed for individual firms during the event window. The event window for this study is constructed over a six year period, one year before and five years after the M&A announcement date, and, unlike the short-term analysis, portfolios are constructed on a monthly basis (Fama, 1998). The Eventus software provided by Wharton Research Data Services (wrds) is applied in the long-term
analysis to perform long-term event studies using Fama-French Three Factor Model and CRSP stock databases (Cowan, 2007). For long-term stock performance analysis, six event windows are constructed and examined: 1) twelve months before the announcement date to one month before the announcement date (-12, -1) 2) the announcement date to one month after the announcement date (0, +1) 3) the announcement date to twelve months after the announcement date (0, +12) 4) the announcement date to twenty-four months after the announcement date (0, +24) 5) one month after the announcement date to sixty months after the announcement date (+1, +60) 6) thirty months after the announcement date to sixty months after the announcement date (+30, +60). Unlike the short-term analysis, overlapping M&A cases are not eliminated in the analysis. Since the event window for long-term analysis (6-year period) is significantly longer than the event window applied in the short-term analysis (121-day period), the elimination of all overlapping cases may result in insufficient number of cases. Therefore, biases and
Research Objective Three (RO3). To address RO3, the study examines the effect of M&A activity (technological vs. non-technological) on financial profitability and operating efficiency associated with the acquiring firm after the M&A transaction. This portion of the analysis is designed to identify specific financial components that benefit or decline after the M&A transaction. Firms’ annual financial data are accessed from the Compustat database. For
the purpose of both financial profitability and operating efficiency analysis, two separate period windows are constructed to compare pre-and-post M&A performance of the acquiring firms: five years before (pre-M&A performance) and five years after (post-M&A performance) the
announcement date.
Following Hassan et al. (2007), traditional accounting measures are selected for financial profitability analysis: return on assets (ROA), return on equity (ROE), and operating cash flow (OCF). The two period windows constructed for each transaction are analyzed using a two-sample t-test to compare profitability measures. The null hypothesis (𝐻𝑜) for each test is that the mean level for the pre-M&A period is not significantly different from the mean for the post M&A period.
H0: μ1 = μ2 Ha: μ1 ≠ μ2
μ1 is the mean of financial profitability of pre-M&A period and μ2 is the mean of financial
profitability of post-M&A period.
RESULTS
Sample Description
The sample includes 526 M&A transactions, among which 192 meets at least one of the two criteria (Table 3.1) to be classified as technological M&As. Accordingly, the remaining cases (334) are classified as non-technological M&As (Figure 4.1 & Appendix B).
Figure 4 - 1. Technological & Non-Technological M&A Classification Results
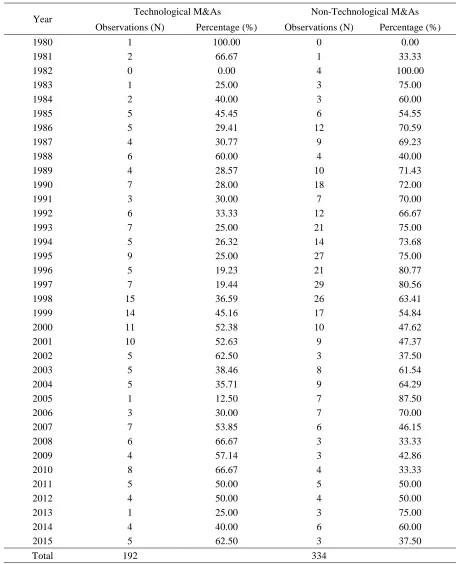
Among the 192 technological M&A transactions (36.5%), 144 transactions are confirmed as technological M&As during the first phase of the identification process. In other words, 144 target firm granted one or more patent during the five years preceding the M&A announcement date. Additional 48 M&A cases are included in the technological M&A category during the second phase of the identification process thorough media search. Table 4.1 and Figure 4.2 shows the number of M&A cases by year.
YES
YES
NO
Table 4 - 1. Sample Distribution Sorted by M&A Announcement Year (1980-2015)
Year Technological M&As Non-Technological M&As
Observations (N) Percentage (%) Observations (N) Percentage (%)
1980 1 100.00 0 0.00
1981 2 66.67 1 33.33
1982 0 0.00 4 100.00
1983 1 25.00 3 75.00
1984 2 40.00 3 60.00
1985 5 45.45 6 54.55
1986 5 29.41 12 70.59
1987 4 30.77 9 69.23
1988 6 60.00 4 40.00
1989 4 28.57 10 71.43
1990 7 28.00 18 72.00
1991 3 30.00 7 70.00
1992 6 33.33 12 66.67
1993 7 25.00 21 75.00
1994 5 26.32 14 73.68
1995 9 25.00 27 75.00
1996 5 19.23 21 80.77
1997 7 19.44 29 80.56
1998 15 36.59 26 63.41
1999 14 45.16 17 54.84
2000 11 52.38 10 47.62
2001 10 52.63 9 47.37
2002 5 62.50 3 37.50
2003 5 38.46 8 61.54
2004 5 35.71 9 64.29
2005 1 12.50 7 87.50
2006 3 30.00 7 70.00
2007 7 53.85 6 46.15
2008 6 66.67 3 33.33
2009 4 57.14 3 42.86
2010 8 66.67 4 33.33
2011 5 50.00 5 50.00
2012 4 50.00 4 50.00
2013 1 25.00 3 75.00
2014 4 40.00 6 60.00
2015 5 62.50 3 37.50
Research Objective One (RO1)
In this section, the characteristics of technology-driven M&As are analyzed based on multiple variables, including target firm characteristics, acquiring firm characteristics, and M&A deal type characteristics, using t-tests and chi-square tests.
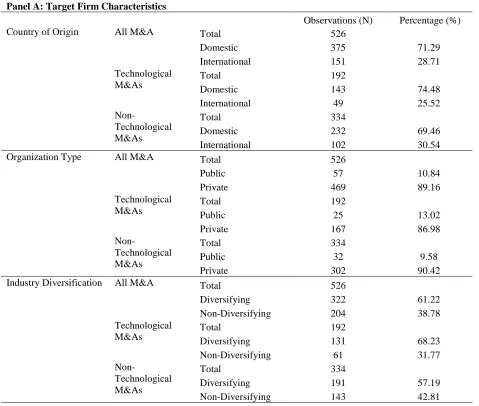
Target Firm Variables. Table 4.2 and Table 4.3 present the chi-square test results based on three target firm variables: country of origin, organization type, and industry diversification. In terms of target firm’s country of origin, the analysis suggests the number of domestic M&A
cases (N=375) is much larger than the number of international M&A cases (N=151) for both technological and non-technological M&As. The analysis suggests that over seventy percent M&A transactions in the U.S. textile industry are between the domestic firms and this ratio is similar in both technological and non-technological M&A cases. The chi-squares test also suggests no significant association exists between the target firm’s country of origin and types M&A (x2=1.5, p-value, 0.221). In the case of cross-border M&As, popular target firm origin includes United Kingdom, Germany and France (Appendix H & I). The chi-square test using organization type variable suggests there is no statistically significant association between the target firm’s organization type and the different types of M&A cases (x2=1.493, p-value, 0.222).
Approximately ninety percent (N=469) of the total M&A cases (N=526) acquired private target companies (Appendix F), whereas ten percent of the M&A cases (N=57) acquired publicly traded companies (Table 4.2). This organization type ratio is similar in both technological and non-technological M&A cases.
cases (68.23%) acquired a target firm with non-textile product related SIC codes. The sample includes target companies from a diverse industry such as pharmaceutical, plastic, biology, and electronic industry (Appendix J). The non-technological M&As also had a higher number of industry diversifying case compared to non-diversifying cases. Among 334 non-technological M&A cases, 191 cases (57.19%) acquired a target firm outside of textile industry. However, the industry diversification ratio is higher among the technological M&A cases than the
Table 4 - 2. Distribution of target firm characteristic variables Panel A: Target Firm Characteristics
Observations (N) Percentage (%)
Country of Origin All M&A Total 526
Domestic 375 71.29
International 151 28.71
Technological M&As
Total 192
Domestic 143 74.48
International 49 25.52
Non-Technological M&As
Total 334
Domestic 232 69.46
International 102 30.54
Organization Type All M&A Total 526
Public 57 10.84
Private 469 89.16
Technological M&As
Total 192
Public 25 13.02
Private 167 86.98
Non-Technological M&As
Total 334
Public 32 9.58
Private 302 90.42
Industry Diversification All M&A Total 526
Diversifying 322 61.22
Non-Diversifying 204 38.78
Technological M&As
Total 192
Diversifying 131 68.23
Non-Diversifying 61 31.77
Non-Technological M&As
Total 334
Diversifying 191 57.19
Non-Diversifying 143 42.81
Table 4 - 3. Chi-squared test results: Target firm characteristic Chi-squared test results: Target Firm Characteristics
df p<|t| x2
Country of Origin 1 0.221 1.500
Organization Type 1 0.222 1.493
Industry Diversification 1 0.012 6.263**
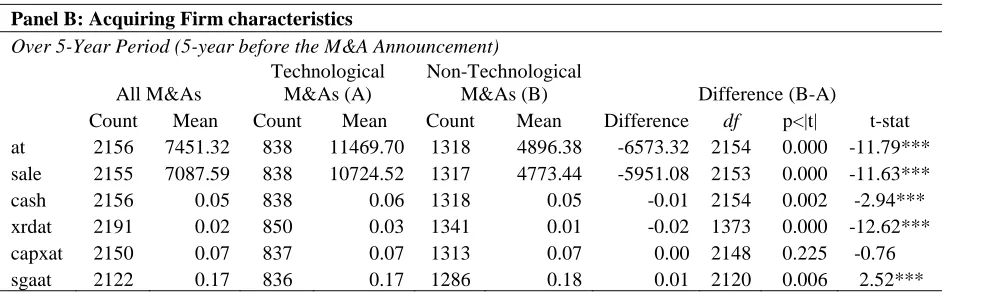
Acquiring Firm Variables. Table 4.4 presents the results of the t-tests applied to the acquiring firm characteristic variables including total assets, sales, cash, R&D expenditures, capital expenditures, and SG&A expenditures for the 5-yeare period prior to the M&A
announcement. All variables used in this analysis are continuously measured and accessed from the Compustat database. The results indicate that a statistically significant difference exists between the two groups, acquiring firms engaged in technological and non-technological M&As, for four of the five dependent financial variables used in this analysis. More specifically, the acquiring firms engaged in technological M&As indicate a significantly larger mean value for total assets (at), net sales (sale), total cash (cash), and R&D expenditures (xrdat). For the total assets (at) and net sales (sale) variables, the difference is statistically significant with a large negative t-statistics and p-value less than one percent significance level (at: t, -11.79, p, 0.000, sale: t, -11.63, p, 0.000).
All remaining variables, cash (cash), R&D expenditures (xrdat), capital expenditures (capxat), and SG&A expenditures (sgaat), are calculated in ratio form rather than using the original figures. For example, instead of using the face value of R&D expenditure, R&D expenditure-to-total asset ratio is used in order to reduce the possible bias which can originate due to different firm sizes. The results indicate that the acquiring firms engaged in technological M&As had a higher cash (cash) and R&D expenditures (xrdat) to total asset ratio compared to that of acquiring firms engaged in non-technological M&As. The R&D expenditure-to-total asset ratio (xrdat) indicates the most significant difference between the two groups (t, -12.62, p,
has a significantly higher SG&A expenditure-to-total asset ratio (mean, 0.179) compared to firms engaged in the technological M&As (mean, 0.168).
Table 4 - 4. T-tests results: Acquiring firm characteristics Panel B: Acquiring Firm characteristics
Over 5-Year Period (5-year before the M&A Announcement)
All M&As
Technological M&As (A)
Non-Technological
M&As (B) Difference (B-A)
Count Mean Count Mean Count Mean Difference df p<|t| t-stat
at 2156 7451.32 838 11469.70 1318 4896.38 -6573.32 2154 0.000 -11.79*** sale 2155 7087.59 838 10724.52 1317 4773.44 -5951.08 2153 0.000 -11.63***
cash 2156 0.05 838 0.06 1318 0.05 -0.01 2154 0.002 -2.94***
xrdat 2191 0.02 850 0.03 1341 0.01 -0.02 1373 0.000 -12.62***
capxat 2150 0.07 837 0.07 1313 0.07 0.00 2148 0.225 -0.76
sgaat 2122 0.17 836 0.17 1286 0.18 0.01 2120 0.006 2.52***
Notes: The measure counts represent the number of observations of each acquiring firm for the entire event window (5 year). Firms with missing data are excluded from the analysis. Winzorization applied. Definitions of the variables are provided in the Appendix A. The symbols *, **, and *** denote statistical significance at the 0.10, 0.05, 0.01 levels, respectively.
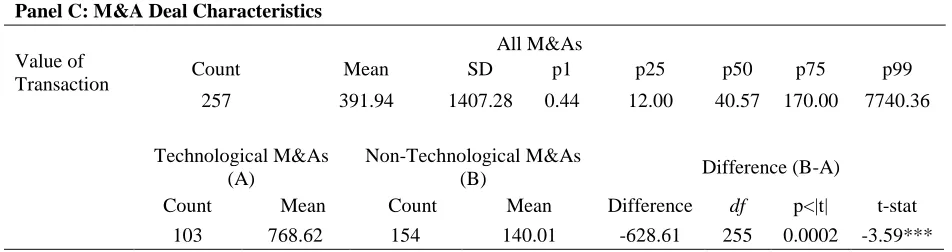
M&A Deal Type Variables. Tables 4.5, 4.6, and 4.7 presents the results of M&A deal characteristics analysis using the following variables: value of transaction, deal attitude, and consideration type. The mean value of the transaction for technological M&A cases (mean, 768.62) is approximately five times larger than the mean value for transaction among the non-technological M&A cases (mean, 140.01). Based on the t-test results, the difference between the two group is statistically significant (t, -3.59, p, 0.0002).
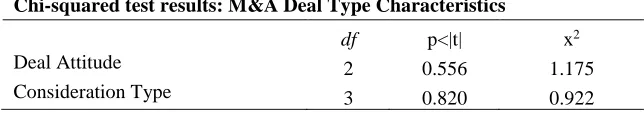
(N=71) of the non-technological M&As are paid in cash only. Despite the similarities in the distribution percentage, no statistically significant association exists between the deal attitude (𝑥2=1.175, p-value, 0.556) and consideration variables (𝑥2=0.922, p-value, 0.82) and the
different types of M&A cases.
Table 4 - 5. T-tests results: M&A Deal Characteristics (Value of Transaction) Panel C: M&A Deal Characteristics
Value of Transaction
All M&As
Count Mean SD p1 p25 p50 p75 p99
257 391.94 1407.28 0.44 12.00 40.57 170.00 7740.36
Technological M&As (A)
Non-Technological M&As
(B) Difference (B-A)
Count Mean Count Mean Difference df p<|t| t-stat
103 768.62 154 140.01 -628.61 255 0.0002 -3.59***
Table 4 - 6. Chi-square tests results: M&A Deal Characteristics Panel C: M&A Deal Characteristics
Observations (N) Percentage (%)
Deal Attitude All M&As Total 525
Friendly 518 98.67
Neutral 5 0.95
Hostile 2 0.38
Technological M&As
Total 191
Friendly 189 98.95
Neutral 2 1.05
Hostile 0 0.00
Non-Technological M&As
Total 334
Friendly 329 98.50
Neutral 3 0.90
Hostile 2 0.60
Consideration Type All M&As Total 430
Cash Only 114 26.52
Stock Only 25 5.81
Combination 28 6.51
Other 263 61.16
Technological M&As
Total 151
Cash Only 43 28.48
Stock Only 10 6.62
Combination 10 6.62
Other 88 58.28
Non-Technological M&As
Total 279
Cash Only 71 25.45
Stock Only 15 5.38
Combination 18 6.45
Other 175 62.72
Notes: M&A transactions with missing data are excluded from the analysis (Deal attitude: 1 technological M&A transaction is excluded & Consideration type: total 96 transactions are excluded – 41 technological M&As and 55 non-technological M&As).
Table 4 - 7. T-tests results: M&A Deal Characteristics (Deal attitude & Consideration Type)
Chi-squared test results: M&A Deal Type Characteristics
df p<|t| x2
Deal Attitude 2 0.556 1.175
Research Objective Two (RO2)
In this section, the t-test results from the stock performance analysis which follows the event-study methodology are presented.
Short-term Analysis. Table 4.8 presents the results for short-term stock performance based on the traditional market model (Equation 3.1) using the value-weighted market index. Results are organized as follows: all M&A transactions (Panel A), technological M&A transactions only (Panel B) and non-technological M&A transactions only (Panel C). Due to missing daily stock price information from the CRSP database, 80 M&A transactions (15.2%) are eliminated from the analysis (17 technological M&As and 63 non-technological M&As). The results indicate that M&A activities, both technological and non-technological, suggest
Table 4 - 8. T-tests for Short-Term Stock Performance using Traditional Market Model
Event Window (Days)
Number of
Observation Mean (CAR) Median (CAR)
Standard
Deviation p<|t| t-stat
Panel A: All Mergers and Acquisitions
(-1, +1) 446 0.006 0.002 0.047 0.010 2.593**
(0, +1) 446 0.007 0.002 0.041 0.000 3.732***
(0, +10) 446 0.009 0.002 0.080 0.018 2.374**
(+1, +30) 446 -0.012 -0.008 0.120 0.034 -2.129**
(+1, +120) 446 -0.029 -0.017 0.291 0.036 -2.105**
(+31, +120) 446 -0.017 -0.020 0.253 0.158 -1.415
Panel B: Technological Mergers and Acquisitions
(-1, +1) 175 0.008 0.004 0.047 0.037 2.104**
(0, +1) 175 0.011 0.005 0.044 0.002 3.205***
(0, +10) 175 0.021 0.014 0.077 0.000 3.657***
(+1, +30) 175 -0.002 -0.001 0.116 0.840 -0.202
(+1, +120) 175 -0.008 0.014 0.287 0.704 -0.381
(+31, +120) 175 -0.006 0.010 0.260 0.742 -0.329
Panel C: Non-Technological Mergers and Acquisitions
(-1, +1) 271 0.005 0.000 0.047 0.104 1.632
(0, +1) 271 0.005 0.001 0.039 0.034 2.133**
(0, +10) 271 0.001 -0.004 0.082 0.812 0.238
(+1, +30) 271 -0.019 -0.012 0.123 0.012 -2.522**
(+1, +120) 271 -0.042 -0.036 0.294 0.018 -2.378**
(+31, +120) 271 -0.024 -0.028 0.248 0.117 -1.573
Notes: M&A transactions with missing data are excluded from the analysis (Total 80 transactions are excluded – 17 technological M&As and 63 non-technological M&As). Winzorization applied. The symbols *, **, and *** denote statistical significance at the 0.10, 0.05, 0.01 levels, respectively.
cumulative abnormal returns of technological M&A transactions. The event-window, from the announcement date (day 0) to 10 days after the announcement date (+10 days), for technological M&As suggests the biggest improvement in terms of the stock performance (t, 3.657, p.>, 0.000) (Figure 4.2).
For the longer event windows (+1 to +120 days), CAR for technological M&As suggest a non-significant decline of 0.8 percent (t, -0.381, p.>, 0.704), while CAR for non-technological M&As suggest a significant decline to 4.2 percent (t, -2.378, p.>, 0.018). The results for windows (+1, +30) and (+31, +120) suggest similar findings with a negative, non-significant t-statistic for technological M&As and a negative, significant t-t-statistic for non-technological M&As.
As shown in Table 4.8 and Figure 4.2 & 4.3, technological M&A transactions experience a significantly positive stock price reaction immediately after the M&A announcement date (0 to +10 days), then return to the original stock price approximately 7 days following the
Figure 4 - 3. Short-term Stock Performance (-1 to 10 Days)
Long-term Analysis. Table 4.9 and Figure 4.4 present the results for long-term stock performance analysis based on Fama-French Three Factor Model (Equation 3.4). Results are organized as follows: all M&A transactions (Panel A), technological M&A transactions only (Panel B), and non-technological M&A transactions only (Panel C). Due to the longer event window (six-year period) required for the long-term analysis, the volume of missing data was larger compared to the short-term analysis. In total, 165 M&A transactions (31.37 %) are eliminated from the analysis due to a lack of complete information covering up to 60 months following the M&A announcement (46 technological M&As and 119 non-technological M&As). The results suggest that M&A activities in the U.S. textile industry lead to a statistically
window (+1 to +60 months, mean, -0.343, t, -6.906), sixty months following the M&A announcement.
Table 4 - 9. T-tests for Long-Term Stock Performance using Fama-French Three Factor Model
Event Window (Months) Number of Observation Mean (CAR) Median (CAR) t-stat
Panel A: All Mergers and Acquisitions
(-12, -1) 393 -0.012 -0.028 -0.762
(0, +1) 393 0.005 -0.008 0.841
(0, +12) 393 -0.059 -0.062 -3.713***
(0, +24) 393 -0.111 -0.061 -5.039***
(+1, +60) 393 -0.173 -0.010 -5.068***
(+30, +60) 361 -0.068 -0.034 -2.757***
Panel B: Technological Mergers and Acquisitions
(-12, -1) 160 0.018 0.002 0.856
(0, +1) 160 0.016 -0.001 1.918**
(0, +12) 160 -0.003 -0.041 -0.123
(0, +24) 160 0.008 0.002 0.279
(+1, +60) 160 0.074 0.101 1.583*
(+30, +60) 146 0.046 -0.002 1.373*
Panel C: Non-Technological Mergers and Acquisitions
(-12, -1) 233 -0.032 -0.048 -1.439*
(0, +1) 233 -0.002 -0.025 -0.266
(0, +12) 233 -0.098 -0.082 -4.229***
(0, +24) 233 -0.193 -0.079 -6.028***
(+1, +60) 233 -0.343 -0.118 -6.906***
(+30, +60) 215 -0.145 -0.063 -4.063***
Research Objective Three (RO3)
In this section, financial profitability and operating efficiency among acquiring firms are analyzed by comparing multiple variables between the technological M&As and the
non-technological M&As over the ten-year period, five years before and after the announcement. The variables used in this analysis include ROA, ROE, and operating cash flow for financial
profitability and total asset turnover (TAT), fixed asset and capital asset turnover (FACE), R&D expenditures (RDE), and selling, general and administrative expenditures (SGAE) to examine operating efficiency.
Financial Profitability Analysis. Tables 4.10 and Table 4.11 present the results for acquiring firms’ financial profitability analysis. The acquiring firms in both types of M&As, technological and non-technological, experienced a decline for all financial profitability measures (ROA, ROE, and OCF). Comparing pre and post M&A financial profitability performance for acquiring firms, the two-sample t-test results indicate statistically significant differences between technological and non-technological M&As (Table 4.11). However, in term of the mean difference, the acquiring firms involved in non-technological M&As experience a larger decline following the M&A compared to the firms involved in the technological M&As for all financial profitability measures (Figure 4.6).
acquiring firm’s ROA after the M&A announcement regardless of M&A type and the decline is
more significant among the non-technological M&As.
The result for the profitability analysis using ROE and operating cash flow (OCF) indicates no improvement after the M&A announcement for both technological and
non-technological M&As. But unlike the result of ROA analysis, the acquiring firms involved in the technological M&As had a significantly larger ROE (t, 3.601, p, 0.000) and operating cash flow (OCF) (t, 1.833, p, 0.000) during the 5-year period prior to the M&A announcement compared to that of firms involved in the non-technological M&As. The t-test result for the post-M&A period is similar. The acquiring firms involved in non-technological M&As experience a more
significant decline in ROE (t, -5.707, p, 0.000) and OCF (t, -10.554, p, 0.000) compared to the technological M&As (ROE: t, -3.327, p, 0.001, OCF: t, -5.294, p, 0.000).
Table 4 - 10. Mean value of financial profitability measures pre and post M&A Financial Profitability Analysis
Pre-M&A (A) Post-M&A (B) Difference (B-A)
ROA: Mean value of ROA pre and post M&A
Technological 0.176 0.150 -0.026***
Non-Technological 0.176 0.136 -0.040***
Difference 0.000 0.014***
ROE: Mean value of ROE pre and post M&A
Technological 0.265 0.223 -0.042***
Non-Technological 0.220 0.155 -0.065***
Difference 0.045*** 0.068***
OCF: Mean value of Operating Cash Flow pre and post M&A
Technological 0.117 0.104 -0.013***
Non-Technological 0.113 0.088 -0.025***
Difference 0.005** 0.017***
Table 4 - 11. Two-sample t-test of financial profitability measures
Notes: Definitions of the variables are provided in the Appendix A. Winzorization applied. The symbols *, **, and *** denote statistical significance at the 0.10, 0.05, 0.01 levels, respectively.
Two-Sample t-test of financial profitability measures
(1) Pre- vs. post-M&As
Difference df p<|t| t-stat
ROA
All M&As -0.035 3439 0.000 -15.306***
Technological -0.026 1350 0.000 -7.848***
Non-Technological -0.040 2087 0.000 -13.275***
ROE
All M&As -0.055 3433 0.000 -6.468***
Technological -0.042 1346 0.001 -3.327***
Non-Technological -0.065 2085 0.000 -5.707***
OCF
All M&As -0.020 3433 0.000 -11.589***
Technological -0.013 1348 0.000 -5.294***
Non-Technological -0.025 2083 0.000 -10.554***
(2) Technological vs. Non-technological M&As
ROA
Pre-M&A 0.000 1774 0.508 -0.020
Post-M&A 0.014 1663 0.000 4.662***
ROE
Pre-M&A 0.045 1768 0.000 3.601***
Post-M&A 0.068 1663 0.000 5.726***
OCF
Pre-M&A 0.005 1773 0.034 1.833**
Table 4 - 12. Mean value of financial profitability measures (-5 to +5 years)
Mean value of financial profitability measures (-5 to +5 years)
Period (Year) ROA ROE OCF
A: Technology Driven M&As
-5 0.180 0.257 0.119
-4 0.177 0.251 0.118
-3 0.175 0.271 0.115
-2 0.176 0.270 0.118
-1 0.173 0.276 0.117
0 0.166 0.248 0.113
1 0.154 0.219 0.107
2 0.148 0.212 0.099
3 0.147 0.234 0.102
4 0.153 0.230 0.107
5 0.149 0.223 0.108
B: Non-technology Driven M&As
-5 0.180 0.242 0.113
-4 0.180 0.231 0.113
-3 0.179 0.216 0.113
-2 0.172 0.192 0.113
-1 0.172 0.223 0.112
0 0.162 0.196 0.104
1 0.146 0.178 0.094
2 0.141 0.198 0.093
3 0.132 0.129 0.086
4 0.132 0.135 0.084
5 0.126 0.122 0.080
Operating Efficiency Analysis. Table 4.13 and 4.14 present the results for acquiring firms’ operating efficiency analysis. The t-test results suggest that acquiring firms in both types of M&As, technological and non-technological, experienced a statistically significant decline for total asset turnover ratio (TAT), fixed asset and capital expenditure ratio (FACE), and R&D expenditure ratio (RDE) after the M&A announcement (Figure 4.7). For selling, general and administrative expenditure (SGAE) measures, the acquiring firms engaged in the technological M&As experienced a statistically significant decline (t, 3.178, p, 0.000) after the M&A
announcement. However, the acquiring firms engaged in non-technological M&As experienced a minimal increase after the M&A announcement, but the t-test result indicated that the increase is statistically insignificant (Table 4.14).
In addition, the total asset turnover and R&D expenditure ratio for the acquiring firms engaged in technological M&As were already significantly larger than ratios for the firms engaged in non-technological M&As (TAT: t, -9.932, p, 0.000, RDE: t, 7.815, p, 0.000). The result indicates that the large operating efficiency gap between technological and
Table 4 - 13. Mean value of operating efficiency measures: pre and post M&A Operating Efficiency Analysis
Pre-M&A (A) Post-M&A (B) Difference (B-A)
TAT: Mean value of total asset turnover pre and post M&A
Technological 1.137 1.031 -0.106***
Non-Technological 1.323 1.220 -0.103***
Difference 0.187*** 0.189***
FACE: Mean value of fixed asset capital expenditure pre and post M&A
Technological 0.070 0.056 -0.014***
Non-Technological 0.068 0.053 -0.015***
Difference -0.002 -0.003
RDE: Mean value of R&D expenditure pre and post M&A
Technological 0.036 0.031 -0.005***
Non-Technological 0.028 0.022 -0.006***
Difference -0.008*** -0.009***
SGAE: Mean value of SG&A expenditure pre and post M&A
Technological 0.164 0.151 -0.013***
Non-Technological 0.179 0.180 0.001
Difference 0.015*** 0.029***
Table 4 - 14. Two-sample t-test of operating efficiency measures (1) Pre vs. Post M&As
Difference df p<|t| t-stat
TAT
All M&As 0.106 3484 0.000 7.299***
Technological -0.106 1366 0.000 5.419***
Non-Technological -0.103 2116 0.000 5.233***
FACE
All M&As 0.015 3477 0.000 11.572***
Technological -0.014 1365 0.000 7.286***
Non-Technological -0.015 2110 0.000 9.022***
RDE
All M&As 0.005 2228 0.000 6.108***
Technological -0.005 1107 0.000 3.931***
Non-Technological -0.006 1119 0.000 4.887***
SGAE
All M&As 0.005 3436 0.107 1.614
Technological -0.013 1364 0.001 3.345***
Non-Technological 0.001 2070 0.708 -0.375
(2) Technological vs. Non-technological M&As
TAT
Pre-M&A 0.186 1820 0.000 -9.072***
Post-M&A 0.189 1662 0.000 -9.286***
FACE
Pre-M&A -0.002 1817 0.340 0.954
Post-M&A -0.003 1658 0.123 1.541
RDE
Pre-M&A -0.008 1155 0.000 7.059***
Post-M&A -0.009 1071 0.000 8.874***
SGAE
Pre-M&A 0.015 1792 0.000 -3.639***
Post-M&A 0.029 1642 0.000 -6.914***