© 2014, IJCSMC All Rights Reserved 908 Available Online atwww.ijcsmc.com
International Journal of Computer Science and Mobile Computing
A Monthly Journal of Computer Science and Information Technology
ISSN 2320–088X
IJCSMC, Vol. 3, Issue. 3, March 2014, pg.908 – 914
RESEARCH ARTICLE
Energy Saving in Wireless Sensor Network
using Attribute Based Dynamic Routing
G.Subha
1, M.Nava Bharathy
21
Department of Embedded System Technologies, Anna University, India
2
Department of Computer Science and Engineering, Anna University, India
Abstract-- In wireless sensor networks the sensor nodes are deployed in various environments for monitoring temperature, pressure and some other purposes. Theses sensor nodes have limited energy and cannot be reenergized easily. So to utilize the energy efficiently, this project proposes an attribute based energy saving mechanism. Here the information sensed by the sensors are aggregated based on packet attribute which is inspired by the concept of pheromone in ant colony optimization. The data sensed by the sensors are sent to sink by various path based on potential based dynamic routing protocol. Thus it reduces the redundant information produced by the adjacent sensors and also provides the information with accuracy. If the sensor nodes are compromised or the information is modified by an adversary then it will be critical for the user to use that information. So the data must be encrypted and then send to the base station.
Keywords-- Attribute, encryption, Potential field, dynamic routing, aggregation
I. INTRODUCTION
A wireless sensor network is a collection of large number of nodes. These nodes sense the physical quantities such as temperature, pressure and humidity into electrical quantity. The electrical signal which is an analog signal is then converted into digital signal by an Analog to Digital converter circuit. The digital signal is then processed and sent to Receiver. The Receiver side has a Digital to Analog converter which converts the digital signal backs to an Analog signal and then sends to base station. The sensor nodes are very small electronic devices produce a measurable response with respect to change in environmental conditions. The energy for these sensor nodes are supplied by the limited power source of less than 0.5-2 ampere per hour and 1.2-3.7 volts.
© 2014, IJCSMC All Rights Reserved 909
millions depends on the application. The production cost includes the total cost involved in creating the whole sensor Network. The data fusion is a technique to aggregate the data from multiple sources. This technique is used in single application wireless sensor networks where the sensor nodes measure the data from homogeneous sensors. The proposed mechanism uses attribute based data aggregation to group the data available from heterogeneous sensors. The mechanisms used for data aggregation are sum, average, maximum, minimum, median and mode. The wireless sensor network consists of thousands of nodes. The data sensed by the adjacent sensor nodes are mostly correlated both in temporal and spatial. So if these sensed packets are send directly to sink, it increases the WSN traffic with packet redundancy and leads to wastage of energy. So the packets are aggregated at some intermediate nodes and then sent to sink. It decreases the redundancy and Network traffic.
Based on the aggregation the Network can be classified as hierarchical and flat Network. In flat network all the sensor nodes are assumed to be the equal energy nodes. Thus sink floods the query to all nodes in sensor networks. The nodes which have the matching content with that of query send the response back to sink. Here the energy is very must wasted. Examples of this type of Networks are Spin, Directed Diffusion, Roumar Routing, Gradient Based Routing, CADR, ACQIRE and Energy Aware Routing. In hierarchical network the data aggregation is done at some intermediate cluster heads and then the data is transmitted to sink. Thus it reduces network traffic and wastage of energy compared with that of flat network. The Hierarchical Network is further classified into static and dynamic. The examples of hierarchical Networks are LEACH, PEGASIS, TEEN, APTEEN and Energy Aware Routing for Cluster Based Sensor Network.
II. RELATED WORK AND MOTIVATION
A. Related Work
The data fusion technique is used in existing system to perform aggregation operations such as average, sum, minimum, maximum etc in homogeneous environment whereas to aggregate data in heterogeneous environment attribute based aggregation is proposed. Hue et al. [5] proposed an optimized scheduling mechanism. This mechanism is based on centralized feedback timing control in which the base station calculates the maximum time interval between successive aggregations. Fan et al. [4] proposed a scheme in which waiting time for each aggregation is random. Younis et al. [3] proposed LEACH (Low Energy Adaptive Clustering Hierarchy) Algorithm for data aggregation. This method is suitable for controlling the network based on current network status and energy level. The randomly selected cluster head aggregates the data that arrives from multiple sensor nodes. It uses Time division/Code division multiple access to reduce inter/intra collisions.
Heinzelman et al. [1] proposed HEED (Hybrid Energy Efficient Distributed Protocol). Here it uses residual energy as a primary parameter and other factors such as node degree and distant to neighbors are considered as a secondary parameters. Lindsey et al. [2] proposed chain based data aggregation scheme known as PEGASIS (Power Efficient Gathering in Sensor Information Systems). Here the node which is far away from sink initiates the chain using greedy algorithm. The nodes which have shorter distance from the sink find its neighbor and send the aggregated result. This is continued until the data reaches the sink or base station. Park et al. [8] proposed a hybrid routing protocol which combines both the concept of clustering and shortest path tree. Here the clustering head performs aggregation and then the shortest path is found out to reach the sink.
B. Motivation
© 2014, IJCSMC All Rights Reserved 910
path. Since if the deposited pheromone is not evaporated then the entire ant will use the same path without considering whether the path is longer or shorter, optimal or not.
In our proposed scheme, the packets are considered as ants and packet attribute is related to pheromone. The packet attribute is left on nodes when packets of heterogeneous environment are passed through the node. The attribute is different for each application. Here the odor is more if more number of packets with same attribute passed through that path. To update the routing table efficiently it inject extra packets into networks like forward ants and backward ants in ant colony and also distribute the status information such as neighbor node, node density into network routing table. Here one potential field is based on network topology to ensure the entire packet to reach the sink. The other potential field is based on pheromone to attract the packets with same attribute. Combining these fields a virtual hybrid potential field is developed to support our dynamic routing ADA scheme. The packet driven timing algorithm and potential based dynamic routing is used converge the packets both in temporal and spatial. It simplifies the packet meet at each other at some node for data aggregation.
III. METHODS FOR CONSTRUCTING ADA AND PBDR
A. Attribute Based Data Aggregation
The ADA scheme design considers the depth, neighbor and attribute. The depth specifies the number of hops from sensor node to base station. The neighbor field specifies the immediate neighbor node from each node. The attribute field is different for each application. The identifiers are provided for specifying the different attribute to measure the various types of signals.
B. Potential Based Dynamic Routing
In potential field model, the potential is like a bowl located at bottom and the water is flow down to bowl. Similarly the packet reaches sink located at some distance. Attribute potential field is created to collect packets with same attribute together. The potential difference acting on two neighbor node is calculated by
( ) ( ) (1)
Depth potential field is calculated by
( ) ( ) (2)
It is used to ensure the entire packet to reach the sink correctly. Pheromone potential field is calculated by
( ) ( ) ( ) (3)
The pheromone potential field is used to group the packets with same attribute together.
The hybrid potential field is calculated by
( ) ( ) ( ) (4)
The hybrid potential field is used to group the packets more spatially and temporally. The data generated by two different applications in a heterogeneous environment cannot be aggregated together.
C. Adaptive Packet driven timing Algorithm
The packets which are travelling through the same path have to meet at each other for aggregation in a particular time based on the number of hops from source node to sink. The relationship between delay and hop is used to calculate the waiting time. It is denoted by .
© 2014, IJCSMC All Rights Reserved 911
h represents hop count and shd represents delay. After waiting for this particular waiting time the nodes aggregate the packets and send the aggregated data to sink.
The neighbor nodes have same or large depth is not selected as the next hop by PBDR. This can be selected by ( ) ( ) (6)
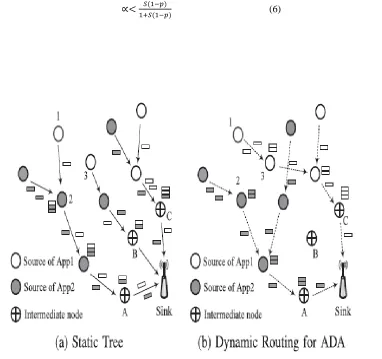
Fig 1 Static and Dynamic Routing In ADA Scheme
© 2014, IJCSMC All Rights Reserved 912
D. Flow Diagram:
Route Selection
Network Creation
Attribute Collection
Network Clustering
Select Source Node
Update Pheromone Field
Aggregate the packets
Select Next Router
If sink
Yes No
Aggregated data collection
Send data through this path
Find Waiting Time for Each Node
© 2014, IJCSMC All Rights Reserved 913
E. Stages Involved In Designing The Project
1) Network Creation: Here the sensor nodes are established based on several topologies or in an ad hoc manner.
The sensor nodes are located within 10 feet and the node density may be 20 nodes/ .
2) Attribute Collection: Different types of attributes such as temperature, pressure or traffic used to monitor
heterogeneous environment is collected and the natural numbers are used as an identifier for specifying the type of an attribute.
3) Network Clustering: The sensor nodes are clustered based on the application of the sensors. For example, nodes
measuring temperature quantity is clustered.
4) Routing Selection: The route is selected dynamically based on the concept of ant colony optimization
algorithm.
5) Update Pheromone: The packet attribute which is considered as a pheromone in ant colony is updated to
perform dynamic routing.
6) Find Waiting Time: The nodes need to wait some time before transmitting the packets. It is calculated based on
the concept of adaptive packet driven timing algorithm.
7) Aggregation: The cluster head aggregates the data, encrypt it and then send to sink.
8) Integrity Verification: The Sink decrypts the data with the corresponding key and then check for Integrity.
F. Performance Considerations
1) Transmission rate: It is the ratio of total number of transmission occurs at the network to the total number of
packets reaches the sink successfully.
2) Aggregation count: If more packets reaches the sink, then aggregation count is small otherwise the aggregation
count is large.
3) Network Life time: It is the number of aggregation rounds completed when some of its sensors lose its energy
completely.
IV. SECURITY IN WSN
The main challenge in wireless sensor network is to maintain confidentiality and integrity of data since the adversary may drop or modify the packets, compromise the secrets or injecting unwanted data to packets. So the security is provided based on two schemes such as Link to Link Encryption and End to End Encryption.
In Link to Link Encryption, each link is equipped with an encryption device. So all the traffic over the link is secure. But here the packet is decrypted at each node to read the packet header to forward the packet. In End to End Encryption scheme, the encryption process is carried at both end of the device. The source encrypts the data and then the packet is transmitted to sink without any alteration. Here the packet is not encrypted so it not necessary to decrypt the packet at each node. By using this anyone of the encryption mechanism security is provided.
After the cluster heads aggregate all packets with same attribute it encrypts the packet. After encryption the plaintext is converted into cipher text. The key for encryption is provided by the base station. So each node shares a secret key with the base station. The key may be symmetric or asymmetric. In symmetric key cryptography, it uses a single key. Our proposed scheme uses asymmetric cryptography. Here two keys are involved such as private key and public key. After encrypting the plaintext with the key the hash code is generated. At the Receiver side, the sink decrypts the packet with the corresponding key. Thus the integrity of the message of the message is checked.
V. CONCLUSION
© 2014, IJCSMC All Rights Reserved 914
REFERENCES
[1] W.R.Heinselman, A.Chandrakasan, and H.Balakrishnan,”Application Specific protocol Architecture for Wireless Networks,” IEEE Transactions on Wireless Communication, vol.1, no. 4, page.660-670, October 2002
[2] S.Lindsey, C.Raghavendra, and K.M.Sivalingam,”Data Gathering Algorithms in Sensor Networks Using Energy Metrics,” IEEE Transactions on Parallel and Distributed Systems, vol. 13, no. 9, page. 924-935, September 2002.
[3] O.Younis and S.Fahmy,”HEED: A Hybrid, Energy-Efficient, Distributed Clustering Approach for Ad Hoc Sensor networks,” IEEE Transactions on Mobile Computing, vol.3, no.4, page. 336-379, December 2004. [4] K.Fan, S. Liu and P.Sinha, ”On the Potential of Structure-Free Data Aggregation in Sensor
Networks,”Proceedings of IEEE INFOCOM, pp.1-12, April 2006.
[5] F.Hu, X.Cao, and C.May, “Optimized Scheduling for Data Aggregation in Wireless Sensor Networks,” Proc. Int’l Conf. Information Technology: Coding and Computing (ITCC’05), pp.156-168, 2005.
[6] Theraulz and E.Bonabeau,”A Brief HistoryStigmery,”Artificial Life, vol.5, no 2, page 66-71, 2003
[7] W.Pu, D.Rui, and I.Akyildiz,”Collaborative Data Compression Using Clustered Source Coding for Wireless Multimedia Sensor Networks,”Proc.IEEE INFOCOM, pp.1-9, 2010
[8] S.J. Park and R.Sivakumar, “Energy Efficient Correlated Data Aggregation for Wireless Sensor Networks”, International Journal on Distributed Sensor Networks, vol.9, no.1, pp.317-365, 1998.
[9] G.D. Caro and M. Dorigo, “AntNet: Distributed Stigmergetic Control for Communication Networks,” J.Artificial Intelligence Research, vol.9, no.1, pp.317-365, 1998