Testing semantic similarity measures for extracting synonyms from a corpus
Olivier Ferret
CEA, LIST, Vision and Content Engineering Laboratory, Fontenay-aux-Roses, F-92265, France.
Abstract
The definition of lexical semantic similarity measures has been the subject of lots of works for many years. In this article, we focus more specifically on distributional semantic similarity measures. Although several evaluations of this kind of measures were already achieved for determining if they actually catch semantic relatedness, it is still difficult to determine if a measure that performs well in an evaluation framework can be applied more widely with the same success. In the work we present here, we first select a semantic similarity measure by testing a large set of such measures against the WordNet-based Synonymy Test, an extended TOEFL test proposed in (Freitag et al., 2005), and we show that its accuracy is comparable to the accuracy of the best state of the art measures while it has less demanding requirements. Then, we apply this measure for extracting automatically synonyms from a corpus and we evaluate the relevance of this process against two reference resources, WordNet and the Moby thesaurus. Finally, we compare our results in details to those of (Curran and Moens, 2002).
1.
Introduction
This article takes place in the field of what is called
lexi-cal semantic similarity or even more generally lexilexi-cal se-mantic relatedness. The objective of the work done in this
field is to determine how close two words are from a se-mantic viewpoint and if their similarity is high enough, the type of the semantic relation they share. A part of this work is dedicated to the design of similarity measures that exploit more or less structured sources of knowledge, such as dictionaries or lexical networks (see (Zesch and Gurevych, 2010) for an overview). In this article, we fo-cus more particularly on corpus-based approaches. Most of them rely on the distributional hypothesis, according to which words found in similar contexts tend to have simi-lar meanings (Firth, 1957). Following (Grefenstette, 1994) and (Lin, 1998), this hypothesis is generally implemented by collecting co-occurrences from a large corpus and char-acterizing each term T from the corpus by the vector of its co-occurrents. These co-occurrents, also considered as features, are weighted according to the strength of their link with T. Finally, the semantic similarity of two terms is eval-uated by applying a similarity measure between their vec-tors. This perspective was adopted for instance by (Curran and Moens, 2002) and (Weeds, 2003), where a wide set of similarity measures and feature weighting functions were tested.
Some works propose variants of this basic schema but with-out changing the core principles of the distributional ap-proach. One of these variants is based on a probabilistic viewpoint: each term is characterized by a probability dis-tribution over its co-occurrents and the semantic similarity of two terms is evaluated by a distance between their prob-ability distributions (Weeds, 2003). The application of di-mensionality reduction techniques to the co-occurrent vec-tors covers another set of variants in which the semantic similarity between terms is evaluated in the semantic space resulting from the dimensionality reduction. The Latent
Se-mantic Analysis from (Landauer and Dumais, 1997) and the Random Indexing from (Salgren, 2006) are the most
signif-icant representatives of this trend.
Works about lexical semantic similarity can also be char-acterized through the way they evaluate the semantic mea-sures they propose. One common way to perform this eval-uation is to apply these measures to a set of TOEFL syn-onym questions, as initially proposed by (Landauer and Du-mais, 1997). Each question consists in a headword and a set of 4 words among which a synonym of the headword has to be identified. After the results for the TOEFL ques-tions had reached a high level (Turney et al., 2003), several extensions of this evaluation approach were proposed, ei-ther by using questions from similar tests such as the ESL test (Moraliyski and Dias, 2007), building larger sets of questions by relying on a resource such as WordNet (Fre-itag et al., 2005; Piasecki et al., 2007) or extending the kind of relations covered by the test as with the presence of analogies in the SAT test (Turney, 2008).
Another common way to evaluate semantic measures is to compare their results to a gold standard. Human judgments about the similarity of couples of words are sometimes used as a direct gold standard (Weeds, 2003) but this kind of resources are rare and small. As a consequence, a more indirect evaluation is generally performed (Lin, 1998; Cur-ran and Moens, 2002): the semantic measures to test are used for finding the most similar neighbors of a headword and these neighbors are evaluated against a reference set of synonyms or related words for this headword taken from resources such as WordNet (Miller, 1990) or the Roget’s thesaurus (Roget, 1911).
Context similarity measure Feature weighting function
Cosine
P
iwgt(xi)·wgt(yi)
√P
jwgt(xj)2·Pjwgt(yj)2 Pointwise Mutual Information (pmi)
log(p(px()x,f·p()f))
Jaccard P
imin(wgt(xi),wgt(yi)) P
jmax(wgt(xj),wgt(yj)) T-test
p(x,f√)−p(x)·p(f)
p(x)·p(f)
Jaccard† Pimin(wgt(xi),wgt(yi)) P
imax(wgt(xi),wgt(yi)) Tf.Idf N(x, f)·log(
Nx
Nx,f)
Dice 2· P
imin(wgt(xi),wgt(yi)) P
jwgt(xj)+Pjwgt(yj)
Dice† 2·Pimin(wgt(xi),wgt(yi)) P
iwgt(xi)+wgt(yi)
Lin
P
iwgt(xi)+wgt(yi) P
jwgt(xj)+Pjwgt(yj)
Table 1: Tested similarity measures for contexts and weighting functions for features6
window size 1 3 5
frequency threshold 1 3 5 1 3 5 1 3 5
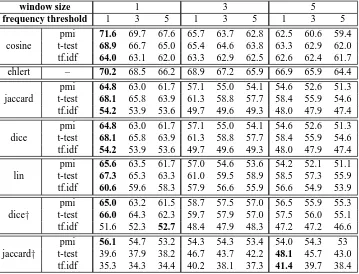
pmi 71.6 69.7 67.6 65.7 63.7 62.8 62.5 60.6 59.4 cosine t-test 68.9 66.7 65.0 65.4 64.6 63.8 63.3 62.9 62.0 tf.idf 64.0 63.1 62.0 63.3 62.9 62.5 62.6 62.4 61.7
ehlert – 70.2 68.5 66.2 68.9 67.2 65.9 66.9 65.9 64.4
pmi 64.8 63.0 61.7 57.1 55.0 54.1 54.6 52.6 51.3 jaccard t-test 68.1 65.8 63.9 61.3 58.8 57.7 58.4 55.9 54.6 tf.idf 54.2 53.9 53.6 49.7 49.6 49.3 48.0 47.9 47.4
pmi 64.8 63.0 61.7 57.1 55.0 54.1 54.6 52.6 51.3 dice t-test 68.1 65.8 63.9 61.3 58.8 57.7 58.4 55.9 54.6 tf.idf 54.2 53.9 53.6 49.7 49.6 49.3 48.0 47.9 47.4
pmi 65.6 63.5 61.7 57.0 54.6 53.6 54.2 52.1 51.1 lin t-test 67.3 65.3 63.3 61.0 59.5 58.9 58.5 57.3 55.9 tf.idf 60.6 59.6 58.3 57.9 56.6 55.9 56.6 54.9 53.9
pmi 65.0 63.2 61.5 58.7 57.5 57.0 56.5 55.9 55.3 dice† t-test 66.0 64.3 62.3 59.7 57.9 57.0 57.5 56.0 55.1 tf.idf 51.6 52.3 52.7 48.4 47.9 48.3 47.2 47.2 46.6
pmi 56.1 54.7 53.2 54.3 54.3 53.4 54.0 54.3 53 jaccard† t-test 39.6 37.9 38.2 46.7 43.7 42.2 48.1 45.7 43.0
tf.idf 35.3 34.3 34.4 40.2 38.1 37.3 41.4 39.7 38.4
Table 2: Evaluation of semantic similarity measures
Ehlert’s accuracies. For these measures, T-test is the best
weighting function, which is compatible with (Curran and Moens, 2002), while Tf.idf is the worst. Jaccard†is clearly the worst choice as a context similarity measure. Finally, our best measure compares favorably with (Broda et al., 2009), which uses the nouns of WBST for evaluation as in our case but relies on syntactic co-occurrences collected from the British National Corpus, a 100 million word cor-pus. For nouns with frequency >10, its best accuracy is equal to 68.04%.
6i: index on shared features ofxandy;j: index on all
fea-tures ofxory;N(x, c): frequency ofcas a co-occurrent ofx;
Nx: number of words; Nx,c: number of words havingcas
co-occurrent.
3.
Applying a lexical similarity measure for
extracting synonyms and similar words
3.1. PrinciplesResults from the previous section show that we have built a distributional semantic similarity measure that performs at least as well as state of the art measures on a standard benchmark for evaluating semantic similarity. We now ex-amine in this section to what extent this measure can be used to extract synonyms and similar words.
freq. ref. # words #target syno.
#found syno.
R-prec. MAP P@1 P@5 P@10 P@100
>10 W 10,473 29,947 7,374 0.082 0.098 0.117 0.051 0.034 0.007
(all) M 9,216 460,923 43,950 0.067 0.032 0.241 0.164 0.130 0.048
# 14670 WM 12,243 473,833 46,656 0.077 0.056 0.225 0.140 0.108 0.038
>1000 W 3,690 13,509 3,826 0.111 0.125 0.171 0.077 0.051 0.010
# 4378 M 3,732 258,836 29,426 0.102 0.049 0.413 0.280 0.219 0.079
WM 4,164 263,216 30,375 0.110 0.065 0.413 0.268 0.208 0.073
100< W 3,732 9,562 2,733 0.104 0.125 0.136 0.058 0.037 0.007
≤1000 M 3,306 136,467 12,664 0.064 0.031 0.187 0.131 0.104 0.038
# 5175 WM 4,392 140,750 13,844 0.092 0.073 0.209 0.123 0.093 0.031
≤100 W 3,051 6,876 815 0.021 0.033 0.026 0.012 0.009 0.003
# 5117 M 2,178 65,620 1,860 0.012 0.005 0.025 0.015 0.015 0.008
WM 3,687 69,867 2,437 0.021 0.024 0.033 0.017 0.015 0.007
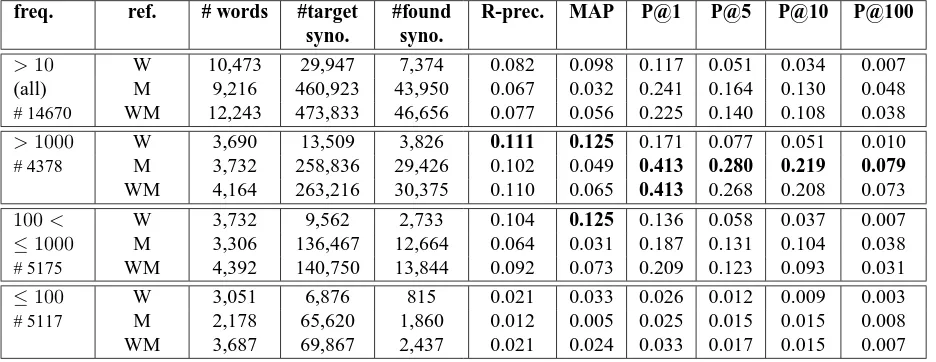
Table 3: Evaluation of synonym extraction
these words are sorted according to their similarity value and only the firstN, which is equal to 100 in our experi-ments, of them are kept7. As we use the Cosine measure for evaluating the semantic similarity of words, we could use techniques such the ones described in (Bayardo et al., 2007) to face the scalability problem of our basic approach for retrieving the nearest neighbors of a word. (Pantel et al., 2009) also addresses this problem for huge sets of data.
3.2. Results and evaluation
Table 3 shows the results of the application of the best sim-ilarity measure of the previous section to the extraction of synonyms and similar words. Two well-known resources were taken as reference: WordNet, more precisely its ver-sion 3.0, and the Moby thesaurus (Ward, 1996). As we fo-cus on the ability of a semantic similarity measure to extract reliable synonyms more than on the coverage of these re-sources, we filtered these two references by removing from them all the words that weren’t part of the set of mono-term nouns of the AQUAINT 2 corpus for which our distribu-tional data were collected. We also built a third reference (WM) by merging the data coming from WordNet (W) and the Moby thesaurus (M).
In distributional approaches, the frequency of words related to the size of the corpus is an important factor. Hence, we give our results globally but also for three ranges of frequencies that split our vocabulary into roughly equal parts (see first column of Table 3): high frequency nouns (frequency> 1000), middle frequency nouns (100 < fre-quency≤1000) and low frequency nouns (10<frequency
≤100). The third column of Table 3 gives for each resource the number of words for which the evaluation was actually performed. This number is lower than the number of nouns of the first column as some nouns of the AQUAINT 2 pus have no entry in our resources. The fourth column cor-responds to the number of synonyms and similar words in our reference resources that have to be found for the nouns of the AQUAINT 2 corpus while the fifth column gives the
7
It was performed approximately in 4 hours on 48 cores of a cluster.
number of synonyms and similar words that were actually found among the first 100 semantic neighbors of each tar-get word of our distributional base. As these neighbors are ranked according to their similarity value with their target word, the evaluation measures can be taken from the In-formation Retrieval field by replacing documents with syn-onyms and queries with target words (see the three last columns of Table 3). The R-precision (R-prec.) is the pre-cision after the first R neighbors were retrieved, R being the number of reference synonyms; the Mean Average Pre-cision (MAP) is the average of the prePre-cision value after a reference synonym is found; precision at different cut-offs is given for the 1, 5, 10 and 100 first neighbors.
The results of Table 3 are globally low in spite of the good results on the WBST test of the similarity measure we have used. This weakness concerns both the recall of synonyms (around 25% for WordNet and 10% for the Moby the-saurus) and their rank among semantic neighbors (see R-precision, MAP and P@1,5,10,100). This observation goes beyond our particular experiments as the similarity measure we relied on is not specific to our framework. However, the situation is somewhat different depending on the fre-quency range of target words: the best results are obtained for high-frequency words and evaluation measures signif-icantly decrease for words whose frequency is less than 100 occurrences. More globally, the ability for a distribu-tional approach to catch the semantic relatedness of words seems to be closely correlated with the frequency of these words in the corpus from which distributional data are col-lected. While this is an argument in favor of the use of larger and larger corpora, as illustrated by (Pantel et al., 2009), it doesn’t invalidate the idea that rare words may have a different distributional behavior that should be taken into account specifically.
Olivier Ferret. 2004. Discovering word senses from a network of lexical cooccurrences. In 20th Interna-tional Conference on ComputaInterna-tional Linguistics (COL-ING 2004), pages 1326–1332, Geneva, Switzerland.
John R. Firth, 1957. Studies in Linguistic Analysis, chapter A synopsis of linguistic theory 1930-1955, pages 1–32. Blackwell, Oxford.
Dayne Freitag, Matthias Blume, John Byrnes, Edmond Chow, Sadik Kapadia, Richard Rohwer, and Zhiqiang Wang. 2005. New experiments in distributional repre-sentations of synonymy. In Ninth Conference on
Com-putational Natural Language Learning (CoNLL), pages
25–32, Ann Arbor, Michigan, USA.
Gregory Grefenstette. 1994. Explorations in automatic
thesaurus discovery. Kluwer Academic Publishers.
Thomas K. Landauer and Susan T. Dumais. 1997. A so-lution to Plato’s problem: the latent semantic analysis theory of acquisition, induction, and representation of knowledge. Psychological review, 104(2):211–240. Dekang Lin. 1998. Automatic retrieval and clustering
of similar words. In 17thInternational Conference on Computational Linguistics and 36thAnnual Meeting of the Association for Computational Linguistics (ACL-COLING’98), pages 768–774, Montréal, Canada.
George A. Miller. 1990. WordNet: An On-Line Lexical Database. International Journal of Lexicography, 3(4). Rumen Moraliyski and Gaël Dias. 2007. One sense per
discourse for synonym detection. In 5th International Conference Recent Advances in Natural Language Pro-cessing (RANLP 2007), Borovets, Bulgaria.
Patrick Pantel, Eric Crestan, Arkady Borkovsky, Ana-Maria Popescu, and Vishnu Vyas. 2009. Web-scale dis-tributional similarity and entity set expansion. In 2009
Conference on Empirical Methods in Natural Language Processing, pages 938–947, Singapore, August.
Maciej Piasecki, StanisBaw Szpakowicz, and Bartosz Broda. 2007. Extended similarity test for the evaluation of semantic similarity functions. In Language
Technol-ogy Conference (LTC).
Peter Roget. 1911. Thesaurus of English words and phrases. Longmans, Green and Co., London, UK.
Magnus Salgren. 2006. The Word-space model. Ph.D. the-sis, Stockholm University.
Helmut Schmid. 1994. Probabilistic part-of-speech tag-ging using decision trees. In International Conference
on New Methods in Language Processing.
Peter D. Turney, Michael L. Littman, Jeffrey Bigham, and Victor Shnayder. 2003. Combining independent mod-ules to solve multiple-choice synonym and analogy prob-lems. In 4th International Conference on Recent Ad-vances in Natural Language Processing (RANLP 2003),
pages 482–489, Borovets, Bulgaria.
Peter D. Turney. 2008. A uniform approach to analo-gies, synonyms, antonyms, and association. In COLING
2008, pages 905–912.
Lonneke van der Plas and Gosse Bouma. 2004. Syntac-tic contexts for finding semanSyntac-tically related words. In Ton van der Wouden, Michaela Poß, Hilke Reckman, and Crit Cremers, editors, Computational Linguistics in
the Netherlands 2004, Selected Papers from the Fifteenth CLIN Meeting, Leiden, Netherlands.
Grady Ward. 1996. Moby thesaurus. Moby Project. Julie Weeds. 2003. Measures and Applications of
Lexi-cal Distributional Similarity. Ph.D. thesis, Department
of Informatics, University of Sussex.
Torsten Zesch and Iryna Gurevych. 2010. Wisdom of crowds versus wisdom of linguists - measuring the se-mantic relatdness of words. Natural Language
Engi-neering, 16(1):25–59.
Maayan Zhitomirsky-Geffet and Ido Dagan. 2009. Boot-strapping distributional feature vector quality.