
Study of muons in extensive air showers from ultra-high energy cosmic rays
measured with the Telescope Array experiment
R.Takeishi1,∗for the Telescope Array Collaboration
1Department of Physics, Sungkyunkwan University, Jang-an-gu, Suwon, Korea
Abstract. The origin of ultra-high energy cosmic rays (UHECRs) has been a long-standing mystery. One of the uncertainties in UHECR observation derives from the hadronic interaction model used for air shower Monte-Carlo (MC) simulations. The number of muons observed at ground level from UHECR induced air showers is expected to depend upon the composition of primary cosmic rays. The MC prediction also depends on hadronic interaction models. One may test the hadronic interaction models by comparing the measured number of muons with the MC prediction. The Telescope Array (TA) is the largest experiment in the northern hemisphere observing UHECR in Utah, USA. It aims to reveal the origin of UHECR by studying the energy spectrum, mass composition and anisotropy of cosmic rays by utilizing an array of surface detectors (SDs) and fluorescence detectors. We studied muon densities in the UHE extensive air showers by analyzing the signal of TA SD stations for highly inclined showers which should have high muon purity. A high muon purity condition is imposed that requires the geometry of the shower and relative position of the given station and implies that muons dominate the signal. On condition that the muons contribute about 65% of the total signal, the number of particles from air showers is typically 1.88±0.08(stat.)±0.42(syst.) times larger than the MC prediction with the QGSJET II-03 model for protons. The same feature was also obtained for other hadronic models, such as QGSJET II-04.
1 Introduction
The origin of ultra-high energy cosmic rays (UHECRs) has been a long-standing mystery of astrophysics. The Telescope Array (TA) experiment [1] located in Utah, USA is the largest experiment in the northern hemisphere observing UHECRs. It aims to reveal the origin of UHE-CRs by studying the energy spectrum, anisotropy and mass composition of cosmic rays. A UHECR entering the atmosphere interacts with atmospheric nuclei and gener-ates the particle cascade, which is called an air shower. Observed signals of air shower particles and the air shower Monte Carlo (MC) simulation provide information of pri-mary cosmic rays.
The energy range of UHECRs are beyond accelerator experiments, so UHECR air showers are not fully under-stood. The maximum target-frame energy of hadronic
in-teractions accessible at accelerators at present is 1017 eV
measured at the CERN LHC. The MC for cosmic rays in
the energies above 1018 eV uses the extrapolated values
of hadronic interaction parameters, such as cross section
and multiplicity. The values of these parameters differ
between hadronic interaction models, due to the uncer-tainty of modeling pion or kaon generation at the early stage of the air shower development. Thus inferences of UHECR composition from air shower measurements are model-dependent [2, 3], which is important to understand
∗e-mail: [email protected]
the origin of UHECRs since cosmic rays are deflected in the galactic and extragalactic magnetic fields.
Moreover, the Pierre Auger Observatory, which is located in Mendoza, Argentina, reported [4] a model-dependent deficit of muons in simulations of 30–80%
rel-ative to the data, 1019 eV. The Auger group also reported
that the observed hadronic signal in UHECR air showers
is 1.33±0.16 (1.61±0.21) times larger than the
post-LHC MC prediction values for EPOS-post-LHC [5] (QGSJET II-04 [6]), including statistical and systematic errors [7].
The analysis of air shower components is important to obtain a realistic air shower model. The number of muons from a UHECR on the ground depends on the mass com-position of primary cosmic rays. The MC prediction de-pends also on hadronic interaction models since it has in-formation about the shower development at an early stage. One may test the hadronic interaction models by compar-ing the measured number of muons with the MC predic-tion. Furthermore, the lateral distribution of muons con-tains information about the hadronic interaction. In this
work, we study the difference in the number of muons
be-tween experimental data and the MC. The difference as a
2 Telescope Array experiment
The TA experiment measures air shower particles on the ground with the SDs and fluorescence light generated by the air shower with the fluorescence detectors (FDs). The TA SD array consists of 507 scintillation counters, lo-cated on a square grid with 1.2 km spacing, and covers
700 km2 [8]. Each TA SD is composed of two layers of
plastic scintillator with two photomultiplier tubes (PMTs),
one for each layer. The detector has an area of 3 m2 and
each scintillator layer has 1.2 cm thickness. The scintilla-tors and PMTs are contained in a stainless steel box which is mounted under a 1.2 mm thick iron roof to protect the detector from large temperature variations. The SD sta-tion is solar-powered and data are collected by a Wire-less Local-Area Network (WLAN) system. The station measures air shower particles by collecting photons gen-erated in scintillators through wavelength shifting fibers and detecting them with PMTs. The air shower events are triggered when at least three adjacent counters detect
en-ergy deposits equivalent to ≥ 3 minimum ionizing
parti-cles (MIPs) within 8 microseconds. The readout system
then records SD signals equivalent to0.3 MIP detected
within±32 microseconds of the trigger time. The trigger
efficiency is greater than 97% for primary particle energies
above 1019 eV [8]. The calibration is performed every 10
minutes by monitoring histograms of signals from single atmospheric muons and comparing them with simulated distributions of energy deposition [8]. The correlation be-tween the FADC values and the energy deposition is de-termined by the calibration.
The three TA FD stations are located around the SD array and view the sky above the array [9]. The stations consist of 38 telescopes with spherical mirrors. The fluo-rescence light from air showers is collected by the mirror and detected by PMTs. The trigger electronics select a track pattern of triggered PMTs in real time and record air shower tracks.
The TA SD event reconstruction consists of the fol-lowing steps [10]: First, SD signals that are related to air shower events are selected by determining a cluster which is contiguous in space and time. Signals less than about 1.4 Vertical Equivalent Muon (VEM) are excluded from the cluster. This process reduces background signals from the random atmospheric muons, which occur uniformly in space and time at a rate of 0.05 per station within one event
time period (±32 microseconds). Second, shower arrival
time distributions of the SDs are fitted to determine the geometry of cosmic ray air showers. Third, a fit of the lateral distribution of charged particle densities at the SDs is performed using the lateral distribution function from
the AGASA experiment [11, 12]. S800 is determined by
the fit, which is the density of shower particles at a lat-eral distance of 800 m from the air shower axis. The en-ergy of the cosmic ray is estimated by using a look-up
table inS800 and the shower zenith angle. The table is
obtained by a large statistics MC simulation using COR-SIKA [13] and the QGSJET II-03 hadronic model [14]. Finally, the reconstructed energy is scaled to the energy measured by the TA FD, which is determined using
calori-metric detection of an air shower energy deposition in the atmosphere [9, 15, 16] with less hadronic interaction de-pendence than the SD. The energy and angular resolutions
for a primary energy within 1018.5eV<E<1019.0eV are
29% and 2.1◦, respectively [17]. Those for energies above
1019eV are 19% and 1.4◦, respectively. The resolution of
the distance from a shower axis is about 70-80 m within 1018.8eV<E<1019.2eV.
For the MC, we use CORSIKA v6.960, and QGSJET II-03 as a reference model for high energy hadronic inter-actions. The MCs for other models are also generated us-ing the same MC procedure. We also use FLUKA2008.3c [18, 19] to model low energy hadronic interactions and EGS4 [20] to model electromagnetic interactions. The thinning [21] and ”de-thinning” [22] techniques are used to reduce the computation time. The detector simulation is performed by using the Geant4 [23] toolkit.
The simulated cosmic ray energies range from 1016.55
to 1020.55 eV. The simulated zenith angle is isotropically
distributed from 0◦ to 60◦. The azimuth angle and core
position are randomly distributed within the SD array. We applied the same reconstruction procedure as experimental data for the MC dataset.
3 Analysis
We use the TA SD 7 years’ dataset recorded from 11 May 2008 through 11 May 2015, and the events re-constructed by the same method as the TA spectrum
anal-ysis [24] with an energy range 1018.8eV<E <1019.2eV.
In this energy range, the mass composition of the primary cosmic rays is consistent with a light component within
statistical and systematic errors as determined by Xmax
measurement using the TA FD [2, 3, 15, 25], whereXmaxis
the depth in the atmosphere of air shower maximum. Thus we use the MC for proton primaries. We used the energy scale corrected by the FD (reconstructed energy scale) for the experimental data and the scale not corrected by the FD (thrown energy scale) for the MC. The experimental data are compared with the MC using the hadronic models QGSJET II-03, QGSJET II-04, Epos 1.99 [26] and Sibyll 2.1 [27].
The TA SD, made of plastic scintillators [8], is sensi-tive to the electromagnetic (EM) component (electrons and gammas) that are the predominant part of secondary parti-cles from the air showers. The conversion rate of gammas
to electrons in the TA SD is∼20% at 1 GeV. To use the
SD signals dominated by muons, we define the condition
of the highmuon purityusing the MC. Then we compare
the observed signal size from air shower particles with the MC prediction under the high muon purity condition.
2 Telescope Array experiment
The TA experiment measures air shower particles on the ground with the SDs and fluorescence light generated by the air shower with the fluorescence detectors (FDs). The TA SD array consists of 507 scintillation counters, lo-cated on a square grid with 1.2 km spacing, and covers
700 km2[8]. Each TA SD is composed of two layers of
plastic scintillator with two photomultiplier tubes (PMTs),
one for each layer. The detector has an area of 3 m2 and
each scintillator layer has 1.2 cm thickness. The scintilla-tors and PMTs are contained in a stainless steel box which is mounted under a 1.2 mm thick iron roof to protect the detector from large temperature variations. The SD sta-tion is solar-powered and data are collected by a Wire-less Local-Area Network (WLAN) system. The station measures air shower particles by collecting photons gen-erated in scintillators through wavelength shifting fibers and detecting them with PMTs. The air shower events are triggered when at least three adjacent counters detect
en-ergy deposits equivalent to ≥ 3 minimum ionizing
parti-cles (MIPs) within 8 microseconds. The readout system
then records SD signals equivalent to0.3 MIP detected
within±32 microseconds of the trigger time. The trigger
efficiency is greater than 97% for primary particle energies
above 1019eV [8]. The calibration is performed every 10
minutes by monitoring histograms of signals from single atmospheric muons and comparing them with simulated distributions of energy deposition [8]. The correlation be-tween the FADC values and the energy deposition is de-termined by the calibration.
The three TA FD stations are located around the SD array and view the sky above the array [9]. The stations consist of 38 telescopes with spherical mirrors. The fluo-rescence light from air showers is collected by the mirror and detected by PMTs. The trigger electronics select a track pattern of triggered PMTs in real time and record air shower tracks.
The TA SD event reconstruction consists of the fol-lowing steps [10]: First, SD signals that are related to air shower events are selected by determining a cluster which is contiguous in space and time. Signals less than about 1.4 Vertical Equivalent Muon (VEM) are excluded from the cluster. This process reduces background signals from the random atmospheric muons, which occur uniformly in space and time at a rate of 0.05 per station within one event
time period (±32 microseconds). Second, shower arrival
time distributions of the SDs are fitted to determine the geometry of cosmic ray air showers. Third, a fit of the lateral distribution of charged particle densities at the SDs is performed using the lateral distribution function from
the AGASA experiment [11, 12]. S800 is determined by
the fit, which is the density of shower particles at a lat-eral distance of 800 m from the air shower axis. The en-ergy of the cosmic ray is estimated by using a look-up
table inS800 and the shower zenith angle. The table is
obtained by a large statistics MC simulation using COR-SIKA [13] and the QGSJET II-03 hadronic model [14]. Finally, the reconstructed energy is scaled to the energy measured by the TA FD, which is determined using
calori-metric detection of an air shower energy deposition in the atmosphere [9, 15, 16] with less hadronic interaction de-pendence than the SD. The energy and angular resolutions
for a primary energy within 1018.5eV<E<1019.0eV are
29% and 2.1◦, respectively [17]. Those for energies above
1019 eV are 19% and 1.4◦, respectively. The resolution of
the distance from a shower axis is about 70-80 m within 1018.8eV<E<1019.2eV.
For the MC, we use CORSIKA v6.960, and QGSJET II-03 as a reference model for high energy hadronic inter-actions. The MCs for other models are also generated us-ing the same MC procedure. We also use FLUKA2008.3c [18, 19] to model low energy hadronic interactions and EGS4 [20] to model electromagnetic interactions. The thinning [21] and ”de-thinning” [22] techniques are used to reduce the computation time. The detector simulation is performed by using the Geant4 [23] toolkit.
The simulated cosmic ray energies range from 1016.55
to 1020.55 eV. The simulated zenith angle is isotropically
distributed from 0◦ to 60◦. The azimuth angle and core
position are randomly distributed within the SD array. We applied the same reconstruction procedure as experimental data for the MC dataset.
3 Analysis
We use the TA SD 7 years’ dataset recorded from 11 May 2008 through 11 May 2015, and the events re-constructed by the same method as the TA spectrum
anal-ysis [24] with an energy range 1018.8eV<E <1019.2eV.
In this energy range, the mass composition of the primary cosmic rays is consistent with a light component within
statistical and systematic errors as determined by Xmax
measurement using the TA FD [2, 3, 15, 25], whereXmaxis
the depth in the atmosphere of air shower maximum. Thus we use the MC for proton primaries. We used the energy scale corrected by the FD (reconstructed energy scale) for the experimental data and the scale not corrected by the FD (thrown energy scale) for the MC. The experimental data are compared with the MC using the hadronic models QGSJET II-03, QGSJET II-04, Epos 1.99 [26] and Sibyll 2.1 [27].
The TA SD, made of plastic scintillators [8], is sensi-tive to the electromagnetic (EM) component (electrons and gammas) that are the predominant part of secondary parti-cles from the air showers. The conversion rate of gammas
to electrons in the TA SD is∼20% at 1 GeV. To use the
SD signals dominated by muons, we define the condition
of the highmuon purityusing the MC. Then we compare
the observed signal size from air shower particles with the MC prediction under the high muon purity condition.
The secondary particles generated in the atmosphere are attenuated by the interaction with atmospheric parti-cles and they decay before reaching the ground. The EM components experience greater attenuation than muons over the same path length, because the EM compo-nents largely lose their energy by pair production and bremsstrahlung in the shower development but muons can penetrate the atmosphere down to the ground before de-caying. Hence the ratio of the energy deposit of air shower
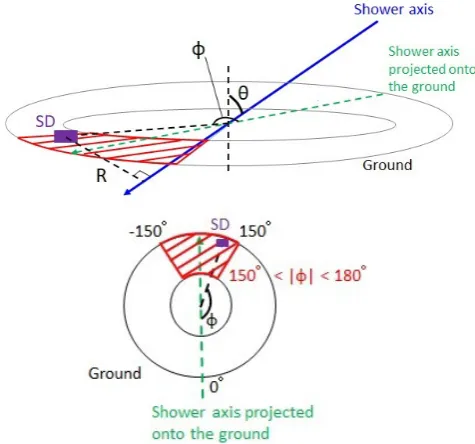
Figure 1. (top) Geometry definition of the muon analysis. An SD location on the ground is selected byφandRto reduce the EM background. The muon purity in the SD signal is calculated in each (φ,R) bin. There are six bins forφand 18 bins forRfrom 500 to 4500 m. The red shaded region in the figure shows the bin for 150◦ < |φ|<180◦ where the distance from the particle
generation points on the shower axis is relatively larger than other φbins, which is expected to be the least EM background bin. (bottom) Top view for theφdefinition.
muons to that of all particles, which consist of air shower and background components, in SD signals (hereafter this ratio is described as the muon purity) is expected to be larger for SDs more distant from secondary particle gen-eration points on the shower axis. We classify the detector
hits in the air shower events of the dataset using θ(the
zenith angle),φ(the azimuth angle relative to the shower
arrival direction projected onto the ground), andR(the
dis-tance from a shower axis). The geometry definition is
de-scribed in Figure 1. Whenθ,|φ|orRvalues become large,
the path length of air shower particles increases, then the muon purity in SD signals is expected to be high.
The integrated FADC is calculated for each SD par-ticipating in the event. The FADC count, converted to VEM units, is entered in the histogram of the
correspond-ing (θ, φ,R) bin. An SD which has no signal is assigned to
the 0 VEM bin of the histogram. Figure 2 shows the lat-eral distributions of SD signals and the muon purity. The muon purity is mainly 60-70% on the high muon purity
condition (30◦ < θ < 45◦,150◦ < |φ| < 180◦, 2000 m
< R <4000 m). We use these conditions to select high
muon purity events for comparison of the data with the MC.
The statistical error of the average signal cannot be
simply calculated for R 1500 m because the fraction
of SDs with no hit signals is too large to determine lower and upper errors of the histogram. We assume the Poisson
distributionf(x)=Nxe−N/x!;Nis the average value of the
Figure 2. Lateral distributions of the air showers [29] (top) The air shower average signal of the MC with QGSJET II-03 for 30◦ < θ < 45◦,150◦ < |φ| < 180◦, 500 m< R <4500
m. The red, green, blue, yellow, magenta and black represent gamma, electron, muon, other shower components, atmospheric muon background and the total of them, respectively. The verti-cal error bar shows the standard deviation. (bottom) The muon purity. The violet and orange show calculations with and without the atmospheric muon background, respectively.
distribution and xis the variable for the signal size
distri-bution. We calculated the average signal by the following
equation: n0/nall = f(0) = e−N. Here n0 andnall are the
entries of 0 VEM bin and the whole distribution,
respec-tively. The probability that zero values appearn0times in
nall samples follows the binomial distribution, hence the
standard deviation of n0 is calculated as nallp(1−p),
wherepisn0/nall.
4 Results
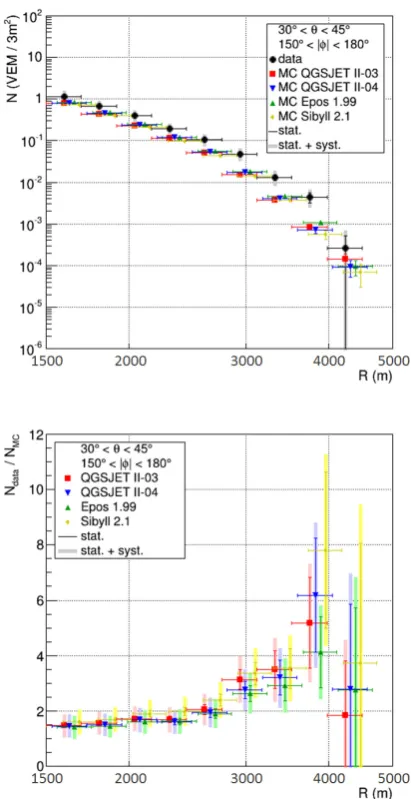
Figure 3. Lateral distributions of air showers of the data and the MCs for 30◦ < θ < 45◦,150◦ <|φ|<180◦, 1500 m<R<
4500 m [29]. (top) Lateral distributions of the average signal size assuming the histograms follow the Poisson distribution. The black, red, blue, green and yellow represent data, QGSJET II-03, QGSJET II-04, Epos 1.99 and Sibyll 2.1, respectively. To make error bars easy to see, the plots for the latter three models are shifted to the right. (bottom) The average ratio of the data to the MC.
interaction models; QGSJET II-03, QGSJET II-04, Epos 1.99 and Sibyll 2.1. The ratios of the data to the MC
with QGSJET II-03 are 1.72±0.10(stat.)±0.37(syst.) at
1910 m< R <2160 m and 3.14±0.36(stat.)±0.69(syst.) at
2760 m<R <3120 m. The observed lateral distribution
falls down slower than the MCs for all hadronic models used in the analysis. The data becomes closer to the MCs
atR 4000 m, since the atmospheric muon background
dominates the SD signals at the distance.
We calculated lateral distributions of iron showers us-ing the MC with QGSJET II-03. Figure 4 shows lateral distributions of the ratio of the data to the MCs for proton and iron. The average signal of the data is larger than the
Figure 4. Ratios of the signal size of the data to the MCs for proton and iron [29]. The red and blue points respectively repre-sent the ratios of the data to the MC for proton and that for iron. The vertical thin error bars and shaded thick error bars represent statistical errors and quadratic sums of statistical and systematic errors, respectively.
MC for iron forR2500 m. For the smaller distances, the
difference between the data and the MC for iron is smaller
than systematic errors.
Figure 5 shows the correlation between the muon pu-rity expected from the MC and the ratio of the signal size of the data to that of the MC. On the high muon purity
condition (30◦ < θ < 45◦,150◦ < |φ| < 180◦, 2000 m
<R<4000 m, magenta filled circle in Figure 5), the muon
purity and the ratio of the data to the MC are 65% and
1.88±0.08(stat.)±0.42(syst.), respectively. In the case of
the low muon purity condition (θ <30◦,|φ|<30◦,2000 m
< R <4000 m, black open circle in Figure 5), they are
28% and 1.30±0.06(stat.)±0.29(syst.), respectively. This
figure shows larger differences in signal sizes between the
data and the MC on higher muon purity conditions. One of the systematic uncertainties of this work is caused by the uncertainty of the TA FD energy measure-ment, which is 21% [16]. An air shower model predicts that the number of particles from the EM and muonic
com-ponents of the showers are proportional toE1.03andE0.85
respectively, where E is the primary cosmic ray energy
[28]. We assume the SD signal size is proportional to E
and apply the systematic uncertainty of±21% to the
ex-perimental data of signal sizes.
1 MIP signal size is determined by fitting a histogram of single atmospheric muons and searching for the peak position of the histogram. The systematic error from the
accuracy of this calibration method is±1.2% [29].
In the TA SD event reconstruction, we perform a cut on the SD signals not included in space-time clusters. This procedure reduces random atmospheric muon background in the dataset. We calculated the systematic error from
Figure 3. Lateral distributions of air showers of the data and the MCs for 30◦ < θ < 45◦,150◦ <|φ|<180◦, 1500 m<R<
4500 m [29]. (top) Lateral distributions of the average signal size assuming the histograms follow the Poisson distribution. The black, red, blue, green and yellow represent data, QGSJET II-03, QGSJET II-04, Epos 1.99 and Sibyll 2.1, respectively. To make error bars easy to see, the plots for the latter three models are shifted to the right. (bottom) The average ratio of the data to the MC.
interaction models; QGSJET II-03, QGSJET II-04, Epos 1.99 and Sibyll 2.1. The ratios of the data to the MC
with QGSJET II-03 are 1.72±0.10(stat.)±0.37(syst.) at
1910 m< R <2160 m and 3.14±0.36(stat.)±0.69(syst.) at
2760 m<R <3120 m. The observed lateral distribution
falls down slower than the MCs for all hadronic models used in the analysis. The data becomes closer to the MCs
atR 4000 m, since the atmospheric muon background
dominates the SD signals at the distance.
We calculated lateral distributions of iron showers us-ing the MC with QGSJET II-03. Figure 4 shows lateral distributions of the ratio of the data to the MCs for proton and iron. The average signal of the data is larger than the
Figure 4. Ratios of the signal size of the data to the MCs for proton and iron [29]. The red and blue points respectively repre-sent the ratios of the data to the MC for proton and that for iron. The vertical thin error bars and shaded thick error bars represent statistical errors and quadratic sums of statistical and systematic errors, respectively.
MC for iron forR2500 m. For the smaller distances, the
difference between the data and the MC for iron is smaller
than systematic errors.
Figure 5 shows the correlation between the muon pu-rity expected from the MC and the ratio of the signal size of the data to that of the MC. On the high muon purity
condition (30◦ < θ < 45◦,150◦ < |φ| < 180◦, 2000 m
<R<4000 m, magenta filled circle in Figure 5), the muon
purity and the ratio of the data to the MC are 65% and
1.88±0.08(stat.)±0.42(syst.), respectively. In the case of
the low muon purity condition (θ <30◦,|φ|<30◦,2000 m
< R <4000 m, black open circle in Figure 5), they are
28% and 1.30±0.06(stat.)±0.29(syst.), respectively. This
figure shows larger differences in signal sizes between the
data and the MC on higher muon purity conditions. One of the systematic uncertainties of this work is caused by the uncertainty of the TA FD energy measure-ment, which is 21% [16]. An air shower model predicts that the number of particles from the EM and muonic
com-ponents of the showers are proportional toE1.03andE0.85
respectively, where E is the primary cosmic ray energy
[28]. We assume the SD signal size is proportional to E
and apply the systematic uncertainty of±21% to the
ex-perimental data of signal sizes.
1 MIP signal size is determined by fitting a histogram of single atmospheric muons and searching for the peak position of the histogram. The systematic error from the
accuracy of this calibration method is±1.2% [29].
In the TA SD event reconstruction, we perform a cut on the SD signals not included in space-time clusters. This procedure reduces random atmospheric muon background in the dataset. We calculated the systematic error from
this procedure as the difference in the ratio of signals with
Figure 5. The correlation between the muon purity and the ratio of the signal size of the data to the MC with QGSJET II-03 for 2000 m < R <4000 m [29]. The black, red, green, blue, orange and magenta represent|φ|<30◦, 30◦ <|φ|<60◦,
60◦ < |φ| < 90◦, 90◦ < |φ| < 120◦, 120◦ < |φ| < 150◦ and
150◦ < |φ| <180◦, respectively. The open circle, filled circle
and cross representθ <30◦, 30◦ < θ <45◦and 45◦< θ < 55◦,
respectively. The vertical thin error bars and shaded thick error bars represent statistical errors and quadratic sums of statistical and systematic errors, respectively.
cut to that without cut between the data and the MC. The
calculated error is±1%.
In this analysis, we calculated the average signal from air showers with an assumption of the signal size distri-bution following a Poisson distridistri-bution. We calculate the systematic error from this assumption by comparing the ratio of observed signals to the MC using the Poisson
dis-tribution,N, with that using the simple averaged value,S.
The calculated values haveRdependence and are within
±4%.
The TA SD reconstruction procedure conducts the fit-ting of lateral distributions without separafit-ting the SDs by the azimuth angle. The signal size of air showers in the shower arrival direction is larger than that in the shower
forwarding direction compared to the same R. Thus the
core position reconstructed by the procedure has a system-atic shift on the side of the air shower arrival direction. We compared the signal size with reconstructed event
param-eters (E, θ, φand core position) and that with input ones,
using the MC. The bias of the signal size from the shift has
Rdependence and is in the range of 4-13%. We included
them in the systematic error.
The average duty cycle of the SD array is approxi-mately 95%, hence 5% of all the SDs in the dataset are possibly not working properly. The systematic uncertainty
from this effect hasRdependence and is within±1% [29].
The total systematic uncertainty is±(22−24%) on the
high muon purity condition (30◦ < θ <45◦,150◦ <|φ|<
180◦, 2000 m<R <4000 m). The error from the energy
determination dominates in this analysis.
5 Conclusion
We developed an analysis for muons from UHE air
show-ers with the TA scintillator SD. It uses θ, φ andR
con-ditions to determine events with a high muon purity. The results imply that part of the discrepancy in signal sizes be-tween the data and the MC is due to a muon excess in the data. The ratios of the signal size of the data to that of the
MC with QGSJET II-03 are 1.72±0.10(stat.)±0.37(syst.)
at 1910 m<R<2160 m and 3.14±0.36(stat.)±0.69(syst.)
at 2760 m<R<3120 m on the high muon purity
condi-tion (30◦ < θ < 45◦,150◦ < |φ| < 180◦, 2000 m< R <
4000 m) at 1018.8eV < E <1019.2 eV, The muon purity
expected from the MC is about 65% on that condition. The measurement presented here is qualitatively consis-tent with the result of the Auger experiment [4, 7], where
the threshold energy of air shower particles (∼10 MeV for
TA SD and 300 MeV for Auger SD) andRconditions are
different. We also found that the lateral distribution of the
data falls down slower than the MC on the high muon pu-rity condition, resulting in a larger ratio of the data to the
MC at largerRvalues. This result provides information to
improve reliability of hadronic interaction models.
Acknowledgments
The Telescope Array experiment is supported by the Japan Society for the Promotion of Science (JSPS) through Grants-in-Aid for Priority Area 431, for Specially Promoted Research JP21000002, for Sci-entific Research (S) JP19104006, for Specially Pro-moted Research JP15H05693, for Scientific Research (S) JP15H05741 and for Young Scientists (A) JPH26707011; by the joint research program of the Institute for Cosmic Ray Research (ICRR), The University of Tokyo; by the U.S. National Science Foundation awards PHY-0601915, PHY-1404495, PHY-1404502, and PHY-1607727; by the National Research Foundation of Korea (2017K1A4A3015188; 2016R1A2B4014967; 2017R1A2A1A05071429, 2016R1A5A1013277); by the Russian Academy of Sciences, RFBR grant 16-02-00962a (INR), IISN project No. 4.4502.13, and Belgian Science
Policy under IUAP VII/37 (ULB). The foundations of Dr.
Ezekiel R. and Edna Wattis Dumke, Willard L. Eccles, and George S. and Dolores Doré Eccles all helped with gener-ous donations. The State of Utah supported the project through its Economic Development Board, and the
Uni-versity of Utah through the Office of the Vice President
for Research. The experimental site became available through the cooperation of the Utah School and Institu-tional Trust Lands Administration (SITLA), U.S. Bureau of Land Management (BLM), and the U.S. Air Force. We appreciate the assistance of the State of Utah and Fillmore
offices of the BLM in crafting the Plan of Development
officials of Millard County, Utah have been a source of
steadfast and warm support for our work which we greatly appreciate. We are indebted to the Millard County Road
Department for their efforts to maintain and clear the roads
which get us to our sites. We gratefully acknowledge the
contribution from the technical staffs of our home
institu-tions. An allocation of computer time from the Center for High Performance Computing at the University of Utah is gratefully acknowledged.
References
[1] M. Fukushima, Prog. Theor. Phys. Suppl. 151, 206
(2003).
[2] T. Stromanet al., Proc. 34th ICRC, 361 (2015).
[3] T. Fujiiet al., Proc. 34th ICRC, 320 (2015).
[4] A. Aab et al. (Pierre Auger Collaboration), Phys.
Rev. D91, 032003 (2015); Erratum, Phys. Rev. D91,
059901 (2015).
[5] K. Werner, F. M. Liu, and T. Pierog, Phys. Rev. C74,
044902 (2006).
[6] S. Ostapchenko, Phys. Rev. D83, 014018 (2011).
[7] A. Aabet al.(Pierre Auger Collaboration), Phys. Rev.
Lett.117, 192001 (2016).
[8] T. Abu-zayyadet al., Nucl. Instrum. Methods. A689,
87 (2012).
[9] R. U. Abbasiet al., Astropart. Phys.80, 131 (2016).
[10] D. Ivanov, Ph.D. thesis, Rutgers-The State Univer-sity of New Jersey, Department of Physics and Astron-omy, Piscataway, New Jersey, USA (2012).
[11] M. Takedaet al., Phys. Rev. Lett.81, 1163 (1998).
[12] M. Takedaet al., Astropart. Phys.19, 447 (2003).
[13] D. Hecket al., Forschungszentrum Karlsruhe Report
FZKA, 6019 (1998).
[14] S. Ostapchenko, Nucl. Phys. B, Proc. Suppl. 151,
147 (2006).
[15] R. U. Abbasiet al., ApJ858, 76 (2018).
[16] T. Abu-Zayyadet al., Astropart. Phys.61, 93 (2015).
[17] R. U. Abbasiet al., Astropart. Phys.86, 21 (2017).
[18] A. Ferrariet al., Tech. Rep. 2005-010, CERN (2005).
[19] G. Battistoniet al., AIP Conf. Proc.896, 31 (2007).
[20] W. R. Nersonet al., Tech. Rep. 0265 SLAC (1985).
[21] M. Kobalet al., Astropart.Phys.15, 259 (2001).
[22] B. T. Stokeset al., Astropart.Phys.35, 759 (2012).
[23] J. Allison et al., IEEE Trans. Nucl. Sci. 53, 270
(2006).
[24] T. Abu-Zayyadet al., ApJ768, L1 (2013).
[25] R.U. Abbasiet al., Astropart. Phys.64, 49 (2015).
[26] T. Pierog and K. Werner, Nucl. Phys. Proc. Suppl.
196, 102 (2009).
[27] E. J. Ahnet al., Phys. Rev. D80, 094003 (2009).
[28] J. Matthews, Astropart. Phys.22, 387 (2005).
[29] R. U. Abbasiet al.(Telescope Array Collaboration),
![Figure 4.proton and iron [29]. The red and blue points respectively repre-](https://thumb-us.123doks.com/thumbv2/123dok_us/8008741.1331051/5.595.55.255.90.279/figure-proton-iron-red-blue-points-respectively-repre.webp)
