Level 5 32 Walker Street North Sydney NSW 2060
Tel +61 (0)2 8090 9100
au.milliman.com
Group of 100 Discount Rate
December 2020
Prepared by:
Craig McCulloch, FIAA FFA Victor Huang, FIAA
TABLE OF CONTENTS
1 BACKGROUND ... 1
OBJECTIVES AND SCOPE ... 1
RELIANCE AND LIMITATIONS ... 1
2 METHODOLOGY AND ASSUMPTIONS ... 2
SUMMARY OF THE ASSET CALIBRATION SET ... 2
INTERPOLATION METHODOLOGY ... 4
EXTRAPOLATION METHODOLOGY ... 4
Group of 100 Discount Rate 1 December 2020
1 Background
OBJECTIVES AND SCOPE
The Group of 100 has commissioned Milliman to generate a standardised set of discount rates to be made publicly available for the purpose of discounting employee benefit liabilities under Australian Accounting Standard 119 (AASB 119). The scope of the work is limited to Australian employee benefit schemes, and excludes any schemes of foreign subsidiaries of domestic entities which are denominated in foreign currency.
This report provides the Australian corporate bond discount rate curve as at the end of December 2020 produced under the methodology and assumptions described in the ‘Discount Rates for Australian Employee Benefit Liability Valuation’ report.
RELIANCE AND LIMITATIONS
In producing this report, we have relied upon the following information:
Capital market data as sourced from Bloomberg. Should this data be incorrect, it could materially affect the analysis and conclusions drawn from it.
Users of this report should also be aware that it is subject to the following limitations:
Current debt market conditions. Issuance of corporate bonds is subject to change over time, which may impact upon whether the accounting standard requirements of a deep market are met.
Current capital market conditions, in particular the liquidity and credit ratings of corporate bond markets, which can change rapidly. The asset calibration set could change very rapidly under stressed market conditions.
Reassessments of the suitability of the asset calibration set would be needed if the AAA and/or AA corporate bond market thins, which would require a prospective change to the assets selected for AASB 119 calibration purposes.
This report was prepared solely to provide assistance to the Group of 100 and the relevant Actuaries Institute of Australia subcommittee. Milliman does not intend to benefit and assumes no duty or liability to other parties who receive this report. Milliman recommends that any recipient of this report be aided by its own actuary or other qualified professional when reviewing the report. Milliman does not certify the information in this report, nor does it guarantee the accuracy, completeness, efficacy, or timeliness of such information. Use of such information is voluntary and should not be relied upon unless an independent review of its accuracy, completeness, efficacy, and timeliness has been performed. Materials may not be reproduced without the express consent of Milliman.
2 Methodology and Assumptions
SUMMARY OF THE ASSET CALIBRATION SET
The set of assets to be used to calibrate the discount rate curve is defined by those securities that meet the following conditions:
1. Individual bonds must have the following characteristics:
a. Physical bonds, with no embedded derivatives (e.g., callable, putable, convertible, extendible, variable/floating coupon, index-linked)
b. High-quality corporate bonds issued by both domestic and foreign entities c. Payments denominated in Australian dollars (AUD)
d. Pay fixed (or zero) coupons, non-inflation-linked
e. Maturity terms of greater than one month and less than 10 years f. Minimum amount outstanding on an individual security of $100 million g. Securitised bonds are included
2. A deep market for these bonds must exist, as characterised by the ready availability of observable prices and current trades.
What is meant by high quality?
Figure 1 defines the credit ratings by each agency that map to each of these broad categories. This forms the basis for the asset calibration set used in this report.
FIGURE 1: DEFINITION OF AAA AND AA CREDIT RATINGS BY AGENCY
CATEGORY AAA AA
S&P AAA AA+, AA, AA-
FITCH AAA AA+, AA, AA-
MOODY’S AAA AA1, AA2, AA3
Where there is disagreement between credit rating agencies on particular securities, we use the following conditions:
If a security has at least two AAA ratings, then it is classified as a AAA security
If a security has at least two AA ratings, then it is classified as a AA security
If a security has only been rated by two agencies with different ratings, then the lower rating is used
If a security has only been rated by one agency, then that rating becomes the sole reference
Hereafter, all references to credit ratings refer to those that meet the above conditions. For the purposes of this paper, we refer to this as the combined credit rating.
Group of 100 Discount Rate 3 December 2020 Corporate bond universe
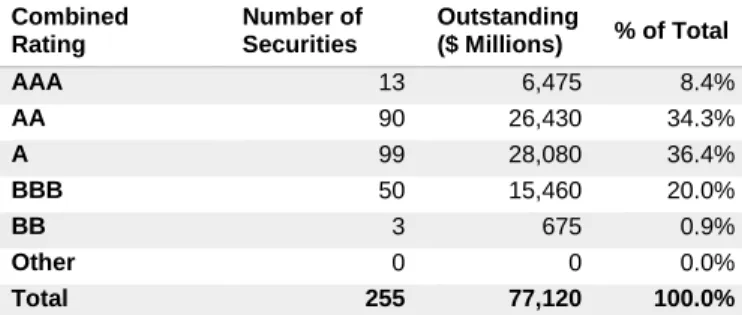
The table in Figure 2 shows the decomposition of the market by the combined credit rating satisfying all but the ‘high quality’ characteristic.
FIGURE 2: AUSTRALIAN CORPORATE BOND MARKET OUTSTANDING DEBT BY COMBINED CREDIT RATING ($ MILLIONS)
Combined Rating
Number of Securities
Outstanding
($ Millions) % of Total
AAA 13 6,475 8.4%
AA 90 26,430 34.3%
A 99 28,080 36.4%
BBB 50 15,460 20.0%
BB 3 675 0.9%
Other 0 0 0.0%
Total 255 77,120 100.0%
Source: Milliman analysis based upon Bloomberg data as at 31 December 2020.
The table in Figure 3 shows the universe of AAA and AA bonds used in the asset calibration set broken down into the composition of their respective S&P, Moody’s and Fitch ratings.
FIGURE 3: AUSTRALIAN AAA/AA CORPORATE BOND MARKET OUTSTANDING DEBT ($ MILLIONS)
Credit Rating Composition
Number of Securities
Outstanding
($ Millions) % of Total Combined Credit Rating of AAA
3 AAA ratings 0 0 0.0%
2 AAA ratings 12 6,200 95.8%
1 AAA rating 1 275 4.2%
Total Combined AAA 13 6,475 100.0%
Combined Credit Rating of AA
3 AA ratings 5 1,375 5.2%
2 AA ratings 72 21,975 83.1%
1 AA rating 13 3,080 11.7%
Total Combined AA 90 26,430 100.0%
INTERPOLATION METHODOLOGY
For fitting the discount curve to the asset calibration set, the Merrill Lynch Exponential Spline (MLES) method with nine exponential basis functions was used calibrated to yield data as at 31 December 2020, weighting each issue by the inverse duration of the issue. The results of the calibrated MLES parameters are shown in Figure 4.
FIGURE 4: MLES-CALIBRATED PARAMETERS AS AT 31 DECEMBER 2020
MLES Parameters
Long-Run b0 5.7%
Param1 λ1 165.4%
Param2 λ2 31.2%
Param3 λ3 -146.3%
Param4 λ4 39.3%
Param5 λ5 32.9%
Param6 λ6 9.6%
Param7 λ7 -73.2%
Param8 λ8 18.5%
Param9 λ9 22.5%
For the calibration of the MLES basis functions, an adjusted R-squared statistical goodness-of-fit measure was applied to the difference between modelled and actual bond prices.
An adjusted R-squared statistic value close to 100% indicates a very good fit, whilst lower values (closer to 0%) indicate poor fits. Figure 5 shows the results of the interpolation analysis used.
FIGURE 5: ADJUSTED R-SQUARED STATISTIC AS AT 31 DECEMBER 2020
Regression Statistic Adjusted R-Squared 98.2%
EXTRAPOLATION METHODOLOGY
For rates beyond 10-year maturities, the fitted yield curve has been extrapolated by assuming that 1-year forward rates remain constant for all subsequent maturities. This is based on the 1-year forward rate between 9- and 10-year maturities, based on the fitted MLES model.
Group of 100 Discount Rate 5 December 2020
3 Fitted Yield Curve
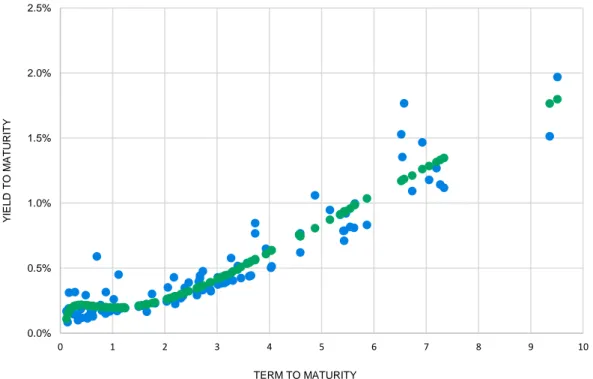
Figure 6 shows the modelled yield-to-maturity for each bond in the asset calibration set, compared with the actual yield-to-maturity, using the MLES method with inverse duration weightings. Note that these are the same bonds as those discussed and analysed in Section 2 above.
FIGURE 6: MODELLED VS. MARKET YIELDS TO MATURITY FOR ASSET CALIBRATION SET USING THE MLES METHOD WITH INVERSE DURATION WEIGHTINGS
0.0% 0.5% 1.0% 1.5% 2.0% 2.5%
0 1 2 3 4 5 6 7 8 9 10
Y
IE
L
D
T
O
M
A
T
UR
IT
Y
TERM TO MATURITY
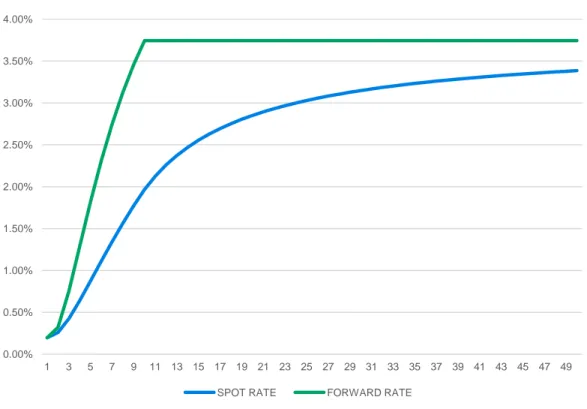
Figures 7 and 8 show the resulting spot and forward yield curves of one to 50 years for the calibration set using the MLES method and extrapolated with the constant forward rate extrapolation method. Spot rates shown are quoted as annually compounded rates on zero coupon bonds with maturities of the specified term, forward rates shown are 1-year forward rates ending at the specified term.
FIGURE 7: SPOT AND FORWARD RATE CURVES FOR ASSET CALIBRATION SET USING AN MLES INTERPOLATION AND CONSTANT FORWARD RATE EXTRAPOLATION METHOD
0.00% 0.50% 1.00% 1.50% 2.00% 2.50% 3.00% 3.50% 4.00%
1 3 5 7 9 11 13 15 17 19 21 23 25 27 29 31 33 35 37 39 41 43 45 47 49
ANNUALLY COMPOUNDED RATE
Group of 100 Discount Rate 7 December 2020
FIGURE 8: SPOT AND FORWARD RATE CURVES FOR ASSET CALIBRATION SET USING AN MLES INTERPOLATION AND CONSTANT FORWARD RATE EXTRAPOLATION METHOD
Term (Years) Spot Rate Discount Factor Term (Years) Spot Rate Discount Factor
1 0.20% 0.998027 26 3.06% 0.457029
2 0.26% 0.994816 27 3.08% 0.440532
3 0.42% 0.987404 28 3.11% 0.424630
4 0.64% 0.974899 29 3.13% 0.409302
5 0.87% 0.957518 30 3.15% 0.394528
6 1.11% 0.935931 31 3.17% 0.380287
7 1.34% 0.910945 32 3.19% 0.366560
8 1.56% 0.883344 33 3.20% 0.353328
9 1.77% 0.853833 34 3.22% 0.340575
10 1.97% 0.823012 35 3.23% 0.328281
11 2.13% 0.793305 36 3.25% 0.316431
12 2.26% 0.764669 37 3.26% 0.305009
13 2.37% 0.737067 38 3.27% 0.293999
14 2.47% 0.710462 39 3.29% 0.283387
15 2.56% 0.684817 40 3.30% 0.273158
16 2.63% 0.660097 41 3.31% 0.263298
17 2.70% 0.636270 42 3.32% 0.253794
18 2.75% 0.613303 43 3.33% 0.244633
19 2.81% 0.591165 44 3.34% 0.235802
20 2.85% 0.569826 45 3.35% 0.227291
21 2.89% 0.549257 46 3.36% 0.219086
22 2.93% 0.529431 47 3.36% 0.211178
23 2.97% 0.510320 48 3.37% 0.203555
24 3.00% 0.491900 49 3.38% 0.196208
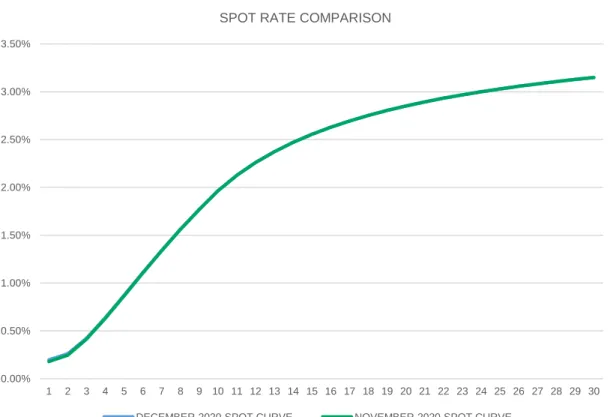
Figure 9 shows the resulting spot rate curve of one to 30 years relative to the prior period fitted curve.
FIGURE 9: SPOT RATE CURVES RELATIVE TO PRIOR PERIOD FITTED CURVE
0.00% 0.50% 1.00% 1.50% 2.00% 2.50% 3.00% 3.50%
1 2 3 4 5 6 7 8 9 10 11 12 13 14 15 16 17 18 19 20 21 22 23 24 25 26 27 28 29 30
SPOT RATE COMPARISON
Milliman is among the world’s largest providers of actuarial and related products and services. The firm has consulting practices in life insurance and financial services, property & casualty insurance, healthcare, and employee benefits. Founded in 1947, Milliman is an independent firm with offices in major cities around the globe.
milliman.com
CONTACT Craig McCulloch
Victor Huang
© 2020 Milliman, Inc. All Rights Reserved. The materials in this document represent the opinion of the authors and are not representative of the views of Milliman, Inc. Milliman does not certify the information, nor does it guarantee the accuracy and completeness of such information. Use of such information is voluntary and should not be relied upon unless an independent review of its accuracy and completeness has been performed. Materials may not be reproduced without the express consent of Milliman.