The Journal of Sri Krishna Research & Educational Consortium
I N T E R N A T I O N A L J O U R N A L O F
B U S I N E S S E C O N O M I C S A N D
M A N A G E M E N T R E S E A R C H
I n t e r n a t i o n a l l y I n d e x e d & L i s t e d R e f e r r e d e - J o u r n a l
A STUDY ON INVESTMENT PATTERNS
OF STOCK MARKET INVESTORS – A CASE STUDY WITH
REFERENCE TO ANANTAPUR DISTRICT IN A.P.
DR. P.BASAIAH*; K. TEJA PRIYANKA YADAV**
*Lecturer (A),
Department of Management Studies, J.N.T. University, Anantapur, A.P.
**BITS, Pilani, Dubai, UAE.
ABSTRACT
Stock markets play a crucial role in the acceleration of the pace of growth in a developing economy like India. Today the stock markets in India are scaling new and all-time highs. The Foreign Institutional Investors (FIIs) and the domestic investors, mainly the mutual funds, appear to have been showing their persistent faith and unshaken confidence in Indian stock markets. The investors’ confidence and faith in stock markets is an essential prerequisite for the smooth, steady and stimulating performance of the stock markets in any country. Moreover, the spread of investment culture among the small and retail investors, especially among the rural investors also goes a long-way in the sustained development of stock markets and helps in capital formation in the country.
Further with the advent of second phase of economic reforms, especially the reforms in the stock markets, the subject of ‘investor protection’ have been subjected too much debate and increased emphasis. Today, the small and rural investors are more exposed to investments risks because of insider trading, price rigging by organized brokers, manipulative and fraudulent practices of market intermediaries. It is in this context, the present work entitled “Investment Patterns of Stock Market investors”.
KEY WORDS: Investment Patterns, Stock Market investors, Investment Patterns
in Stock Markets, Investment Patterns of Stock Market investors, Investment Patterns of Stock Market investors in Anantapur.
___________________________________________________________________________
INTRODUCTION
Stock markets play a crucial role in the acceleration of the pace of growth in a developing economy like India. Today the stock markets in India are scaling new and all-time highs.
The Foreign Institutional Investors (FIIs) and the domestic investors, mainly the mutual funds, appear to have been showing their persistent faith and unshaken confidence in Indian stock markets. The investors’ confidence and faith in stock markets is an essential prerequisite for the smooth, steady and stimulating performance of the stock markets in any country. Moreover, the spread of investment culture among the small and retail investors, especially among the rural investors also goes a long-way in the sustained development of stock markets and helps in capital formation in the country.
Further with the advent of second phase of economic reforms, especially the reforms in the stock markets, the subject of ‘investor protection’ have been subjected too much debate and increased emphasis. Today, the small and rural investors are more exposed to investments risks because of insider trading, price rigging by organized brokers, manipulative and fraudulent practices of market intermediaries. It is in this context, the present work entitled “Investment Patterns of Stock Market investors” has been taken up.
REVIEW OF LITERATURE
It is extremely important for the policy makers and regulatory authorities to understand the investors’ perceptions, preferences and their concerns about the financial markets and specifically on the stock market. This has become necessary on account of dramatic withdrawal of small investors from the capital market and it resulted in a virtual collapse of the capital market as a source of corporate financing after the mid-1990s. Despite great technological strides in the market’s trading system, we have not yet truly recovered from this collapse.
Mitra declares that the asymmetric treatment given to the investors and the promoters for facilitating industrial growth in an otherwise contractual situation, the law now obligates itself to specially design the public law for investor’s protection. In public issues, people at large can participate simply based on a standard form offer document, which hides more than it discloses. The entire offer-acceptance based on the offer document has many obscure sides and moral hazards, which the public is quite unaware of.
Mishra opined that there are possibilities for increasing investment, if the small investors are made to understand the significance of corporate securities. Further, the middle-income group people can be drawn to strengthen the flow of savings into the corporate sector through the corporate securities market, in spite of their accessibility to the lucrative small savings schemes.
Prasanna Chandra stated in his article entitled, “Indian Capital Market - Pathways of Development’, that there is a need to expand the base of investor community and to spread the investment culture to semi-urban and rural areas by augmenting the supply of acceptable investment instruments, by educating the public about the opportunities for investment in corporate securities and by reserving a portion of the public issues of securities for the rural investors.
The SEBI has been promoting education and awareness among the countrywide investors about the legal provisions, administrative guidelines and remedies available for their grievances through the issue of press releases from time to time. The Institute of Company Secretaries of India in its Investor Education Series III entitled, ‘Investment Decision Making by a Lay Investor’ (1991) explained the pre-conditions for investment decision making, analysis and evaluating the risks. Sharma and Prashar in their empirical investigation enquired into the information needs of the investors for taking their investment decisions.
An overview of the above studies reveal that some of them are of research studies, while the rest belongs to general studies focusing on the Indian capital market scenario and the related issues taken place over period of time representing times of pre and post reform period. Though some of them had a focus on motives and preferences of investors in Indian capital market in general, the absence of studies in this regard at regional level with particular reference to Anantapur of Andhra Pradesh has been felt very much. Moreover, it is an undisputable fact to mention that the socio economic characteristic features of investors in terms of their Investment Patterns, motives and preferences definitely varies form region to region, necessitating to take up the study in this direction in the Anantapur District of Andhra Pradesh.
In view of the above and to identify the possible areas for future research, the present study is a modest attempt to study the investment patterns of stock market investors in Anantapur District of Andhra Pradesh.
NEED FOR THE STUDY
After thorough review of literature, there is a need to study the motives and perceptions of investors, a very crucial area in the formulation of policies and procedures for the orderly growth and development of securities markets in any nation. Most of the studies reviewed have mainly covered the aspects at macro level, like the ownership patterns in the capital market, occupation-wise break up of paid up value of share holdings of individuals, ownership pattern of shares/ debentures, geographical distribution of share ownership in India.
There are only a few studies covering the issue of investor motives and perceptions at district level. Especially in the context of decline in the participation of small and household investors in the primary market operations, withdrawal of investors from the capital market, diversion of household savings into other safer investment avenues, it becomes all the more important to study and analyze the investment patterns of stock market investors and investment avenues available to them in the securities markets.
STATEMENT OF THE PROBLEM
behaviour in respect of various investment avenues. The study also aims to study the needs, concerns, and problems of the small investors in the given socio-economic backdrop. The present research work also provides a foundation of facts relating investors’ behaviour towards various types of securities and assessment of investment risks.
Hence, the present study is an attempt to know the investment pattern of investors. The study is made to examine investment patterns of stock market investors and to analyse the investment objectives of investors and the evaluation of investment made by the investors.
OBJECTIVES OF THE STUDY
The basic objective of the present research work is to study the investment patterns of stock market investors. The specific objectives of the study are as follows:
1. To examine the socioeconomic profile of stock market investors in Anantapur District.
2. To find out the source of awareness for investors about stock market.
3. To identify whether the investors has invested in different avenues of stock market.
4. To study whether the investors has invested in different sectors of stock market.
5. To analyse the opinion of investors towards risk associated with investment made in different avenues and sectors of stock market.
6. To offer suitable suggestions for investors and policy makers.
METHODOLOGY OF THE STUDY
PRIMARY DATA: Primary data has been collected through structured questionnaire.
SECONDARY DATA: Data and information has been collected from Primary as well as Secondary sources. The secondary data has been collected from Books, Journals, Magazines, Business News papers, SEBI publications, BSE, NSE reports, RBI publications etc.
AREA SELECTION FOR PRIMARY DATA COLLECTION
SAMPLING DESIGN
As the universe of the study is entire Anantapur District. A sample of 175 respondents from each city/town has been collected for the purpose of the study. The total sample size is 525 respondents as given under:
S.No Name of the Town Sample Size
1 Anantapur 175
2 Dharmavaram 175
3 Hindupur 175
TOTAL: 525
After elimination of few partially filled questionnaires, the resultant sample size is 513.
HYPOTHESIS
HYPOTHESIS 1
H01 = Technology Sector is a highly secured for investment
H11 – Metal Sector is a highly secured for investment
HYPOTHESIS 2
H02 = Low Risk in Information Technology for investment
H12 = Low Risk in Public Sector undertaking for investment
HYPOTHESIS 3
H03 = Corporate Mismanagement and fraud are very common in India Stock Market
H13 = Corporate Mismanagement and fraud are not very common in India Stock Market
HYPOTHESIS 4
H04 = There is no significant differences between investment avenues
H14 = There is significant differences between investment avenues
TOOLS OF ANALYSIS
The statistical tools used to carry out the analysis are given below. The mean scores, frequencies, percentages for all the variables used in the study are calculated. The nature of distribution of the variables examined in the study could be assessed from mean scores and standard deviations of the same. For selected variables, based on the scores given by the sample respondents, ranks are also awarded in order to know their level of significance. Chi-Square analysis and ANOVA have been used.
SCOPE OF THE STUDY
The present study aims at analyzing the investment patterns of individual investors with special reference to Anantapur. Hence, the scope of the present study is confined to the study of motives and preferences of small and household investors of Anantapur district in the state of Andhra Pradesh. Three major towns of Anantapur district have been taken for study.
ANALYSIS AND INTERPRETATION
EDUCATION
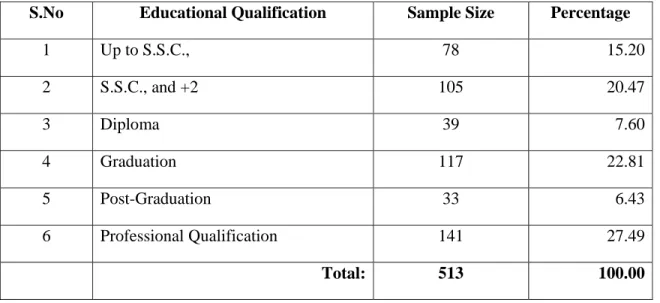
TABLE 1: EDUCATIONAL BACKGROUND OF RESPONDENTS
S.No Educational Qualification Sample Size Percentage
1 Up to S.S.C., 78 15.20
2 S.S.C., and +2 105 20.47
3 Diploma 39 7.60
4 Graduation 117 22.81
5 Post-Graduation 33 6.43
6 Professional Qualification 141 27.49
Total: 513 100.00
Source: Field Survey
INFERENCE: It can be interpreted from the above table that, a majority of the respondents (27.49 percent) are having professional qualification, followed by 22.81 percent are graduates, followed by 20.47 percent belong to S.S.C., and Intermediate group, followed by 15.20 percent up to S.S.C., followed by 7.60 percent belong to diploma level and 6.43 percent of the respondents are post-graduates.
OCCUPATION
Business, Professional, Agriculture, Students and others. An attempt has been made to know the relationship between occupation and investment behaviour.
TABLE 2: OCCUPATIONAL BACKGROUND OF RESPONDENTS
S.No Occupation Sample Size Percentage
1 Employee 153 29.82
2 Business 96 18.71
3 Professional 147 28.65
4 Agriculture 78 15.20
5 Student 15 3.51
6 Others 24 4.68
Total: 513 100.00
Source: Field Survey
INFERENCE: It can be inferred from the above table that, a majority of the respondents (29.82 percent) are employees, followed by 28.65 percent are professionals, followed by 18.71 percent belong to business group, followed by 15.20 percent belong to agriculture segment, followed by 4.68 percent belong to other occupations (house wives etc) and 3.51 percent of the respondents are students.
SIZE OF THE FAMILY
TABLE 3: FAMILY SIZE OF RESPONDENTS
S.No Number of Family Members Sample Size Percentage
1 Up to 3 69 13.45
2 Above 3 and up to 5 411 80.12
3 Above 5 33 6.43
Total: 513 100.00
Source: Field Survey
INCOME
TABLE 4: INCOME LEVEL OF RESPONDENTS
S.No Income per Month Sample Size Percentage
1 Up to Rs. 10,000/- 39 7.60
2 Above Rs. 10,000/- and up to Rs. 20,000/-
114 22.22
3 Above Rs. 20,000/- and up to Rs. 30,000/-
147 28.65
4 Above Rs. 30,000/- 213 41.52
Total: 513 100.00
Source: Field Survey
INFERENCE: It can be evident from the above table that, a majority of (41.52 percent) the respondents are having family monthly income above Rs. 30,000/-, followed by 28.65 percent of the respondents are having family monthly income above Rs. 20,000/- and below Rs. 30,000/-, followed by 22.22 percent of the respondents are having family monthly income above Rs. 10,000/- and below Rs. 20,000/-, and a small segment of respondents 7.60 percent are having family monthly income less than Rs. 10,000/-.
DURATION OF OPERATION
TABLE 5: DURATION OF OPERATION IN STOCK MARKET
S.No Particulars Sample Size Percentage
1 Less than 1 year 189 36.84
2 1 to 3 years 163 31.77
3 3 to 6 years 114 22.22
4 Above 6 years 47 9.16
TOTAL: 513 100 percent
Source: Field Survey
AWARENESS ABOUT STOCK MARKETS
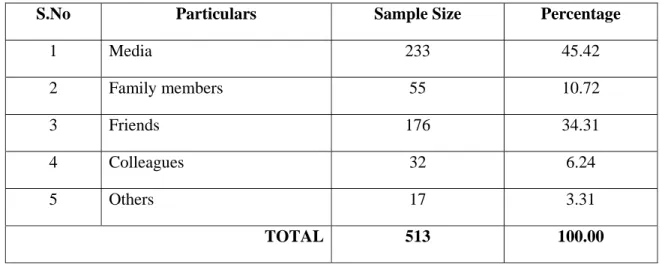
TABLE 6: AWARENESS ABOUT STOCK MARKETS
S.No Particulars Sample Size Percentage
1 Media 233 45.42
2 Family members 55 10.72
3 Friends 176 34.31
4 Colleagues 32 6.24
5 Others 17 3.31
TOTAL 513 100.00
Source: Field Survey
INFERENCE: It can be analyzed from the above table that, a majority of (45.42 percent) the respondents revealed that they came to know about the stock market through media. 34.31 percent of the respondents revealed that they came to know about the stock market through friends. 10.72 percent of the respondents revealed that they came to know about the stock market through family members. 6.24 percent of the respondents revealed that they came to know about the stock market through colleagues and 3.31 percent of the respondents revealed that they came to know about the stock market through other sources like dealers, brokers etc. It can be concluded from the above table that, mode of awareness is mainly by media and friends. Hence, it is suggested in view of the importance of media, more programmes on stock market operations should be carried out to increase awareness level of investors. The business newspapers and magazines should also give technical analysis and fundamental analysis about different companies and industries in all regional languages understandable to all the investors across India irrespective of their educational level.
Average number of companies in which the respondent and his family members own shares
TABLE 7: AVERAGE NUMBER OF COMPANIES IN WHICH THE RESPONDENT AND HIS FAMILY MEMBERS OWN SHARES
S.No Particulars Sample Size Percentage
1 1 to 5 companies 374 72.90
2 5 to 10 companies 69 13.45
3 10 to 15 companies 51 9.94
4 15 to 20 companies 17 3.31
5 Above 25 companies 5 0.97
TOTAL 513 100.00
INFERENCE: It can be seen from the above table that, a majority of (72.90 percent) the respondents revealed that they hold shares of 1 to 5 companies. 13.45 percent of the respondents revealed that they hold shares of 5 to 10 companies. 9.94 percent of the respondents revealed that they hold shares of 10 to 15 companies. 3.31 percent of the respondents revealed that they hold shares of 15 to 20 companies and a very small fraction of 0.97 percent of the respondents revealed that they hold shares of more than 25 companies. It can be concluded from the above table that, majority are small scale investors.
INVESTMENT WITH REGARD TO DIFFERENT AVENUES OF CAPITAL MARKETS
TABLE 8: INVESTMENT WITH REGARD TO DIFFERENT AVENUES OF CAPITAL MARKETS
S.No Particulars INVESTED NOT INVESTED
Sample Size Percentage Sample Size Percentage
1 Equity shares 427 83.24 86 16.76
2 Debentures 18 3.51 495 96.49
3 Mutual Funds 276 53.80 237 46.20
4 Unit Linked Plans 152 29.63 361 70.37
5 Gold Traded Funds 58 11.31 455 88.69
6 Futures & Options 96 18.71 417 81.29
7 Commodities 45 8.77 468 91.23
TOTAL 1072 29.85 2519 70.15
Source: Field Survey
INVESTMENTS WITH REGARD TO DIFFERENT SECTORS OF STOCKS IN STOCK MARKET
TABLE 9: INVESTMENT WITH REGARD TO DIFFERENT SECTORS OF STOCKS IN STOCK MARKET
S.No Particulars INVESTED NOT INVESTED
Sample Size
Percentage Sample Size
Percentage
1 Automobile sector 116 22.61 397 77.39
2 Banking sector 163 31.77 350 68.23
3 Consumer Durables sector
95 18.52 418 81.48
4 FMCG sector 187 36.45 326 63.55
5 Information Technology sector
151 29.43 362 70.57
6 Oil and Gas sector 78 15.20 435 84.80
7 Public Sector Undertakings sector
64 12.48 449 87.52
8 Realty sector 133 25.93 380 74.07
9 Health Care sector 99 19.30 414 80.70
10 Metals sector 134 26.12 379 73.88
11 Technology sector 118 23.00 395 77.00
12 Power sector 76 14.81 437 85.19
13 Electronic Goods sector
147 28.65 366 71.35
TOTAL 1561 23.41 5108 76.59
Source: Field Survey
invested in public sector undertakings sector. 25.93 percent of the respondents have invested in Realty sector. 19.30 percent of the respondents have invested in health care sector. 26.12 percent of the respondents have invested in metals sector. 23.00 percent of the respondents have invested in technology sector. 14.81 percent of the respondents have invested in power sector. 28.65 percent of the respondents have invested in electronic goods sector.
OPINION TOWARDS NATURE OF RISK ASSOCIATED WITH INVESTMENT OF EQUITY SHARES
TABLE 10: OPINION TOWARDS NATURE OF RISK ASSOCIATED WITH INVESTMENT IN EQUITY SHARES
S.No Particulars Sample Size Percentage
1 Absolutely safe 341 66.47
2 Reasonably safe 118 23.00
3 Unsafe 54 10.53
TOTAL 513 100.00
Source: Field Survey
INFERENCE: It can be analyzed from the above table that, majority of (66.47 percent) the respondents revealed that, equity shares are absolutely safe mode of investment in stock market. 23.00 percent of the respondents revealed that, equity shares are reasonably safe mode of investment in stock market and 10.53 percent revealed that, equity shares are unsafe mode of investment in stock market. It can be concluded from the above table that, for majority of the respondents equity shares are safe form of investment in stock market.
OPINION TOWARDS NATURE OF RISK ASSOCIATED WITH INVESTMENT IN DEBENTURES
TABLE 11: OPINION TOWARDS NATURE OF RISK ASSOCIATED WITH INVESTMENT IN DEBENTURES
S.No Particulars Sample Size Percentage
1 Absolutely safe 31 6.04
2 Reasonably safe 43 8.38
3 Unsafe 439 85.58
TOTAL 513 100.00
INFERENCE: It can be observed from the above table that, majority of (85.58 percent) the respondents revealed that, debentures are unsafe mode of investment in stock market. 8.38 percent of the respondents revealed that, debentures are reasonably safe mode of investment in stock market and 6.04 percent revealed that, debentures are absolutely safe mode of investment in stock market. It can be concluded from the above table that, for majority of the respondents debentures are unsafe form of investment in stock market.
OPINION TOWARDS NATURE OF RISK ASSOCIATED WITH INVESTMENT IN MUTUAL FUNDS
TABLE 12: OPINION TOWARDS NATURE OF RISK ASSOCIATED WITH INVESTMENT IN MUTUAL FUNDS
S.No Particulars Sample Size Percentage
1 Absolutely safe 245 47.76
2 Reasonably safe 192 37.43
3 Unsafe 76 14.81
TOTAL 513 100.00
Source: Field Survey
INFERENCE: It can be seen from the above table that, a majority of (47.76 percent) the respondents revealed that, mutual funds are absolutely safe mode of investment in stock market. 37.43 percent of the respondents revealed that, mutual funds are reasonably safe mode of investment in stock market and 14.81 percent revealed that, mutual funds are unsafe mode of investment in stock market. It can be concluded from the above table that, for majority of the respondents mutual funds are safe form of investment in stock market.
OPINION TOWARDS NATURE OF RISK ASSOCIATED WITH INVESTMENT IN UNIT LINKED PLANS
TABLE 13: OPINION TOWARDS NATURE OF RISK ASSOCIATED WITH INVESTMENT IN UNIT LINKED PLANS
S.No Particulars Sample Size Percentage
1 Absolutely safe 78 15.20
2 Reasonably safe 144 28.07
3 Unsafe 291 56.73
TOTAL 513 100.00
INFERENCE: It can be inferred from the above table that, majority of (56.73 percent) the respondents revealed that, unit linked plans are unsafe mode of investment in stock market. 28.07 percent of the respondents revealed that, unit linked plans are reasonably safe mode of investment in stock market and 15.20 percent revealed that, unit linked plans are absolutely safe mode of investment in stock market. It can be concluded from the above table that, for majority of the respondents unit linked plans are unsafe form of investment in stock market.
OPINION TOWARDS NATURE OF RISK ASSOCIATED WITH INVESTMENT IN GOLD TRADED FUNDS
TABLE 14: OPINION TOWARDS NATURE OF RISK ASSOCIATED WITH INVESTMENT IN GOLD TRADED FUNDS
S.No Particulars Sample Size Percentage
1 Absolutely safe 59 11.50
2 Reasonably safe 81 15.79
3 Unsafe 373 72.71
TOTAL 513 100.00
Source: Field Survey
INFERENCE: It can be inferred from the above table that, a majority of (72.71 percent) the respondents revealed that, gold traded funds are unsafe mode of investment in stock market. 15.79 percent of the respondents revealed that, gold traded funds are reasonably safe mode of investment in stock market and 11.50 percent revealed that, gold traded funds are absolutely safe mode of investment in stock market. It can be concluded from the above table that, for majority of the respondents gold traded funds are unsafe form of investment in stock market.
OPINION TOWARDS NATURE OF RISK ASSOCIATED WITH INVESTMENT IN FUTURES AND OPTIONS
TABLE 15: OPINION TOWARDS NATURE OF RISK ASSOCIATED WITH INVESTMENT IN FUTURES AND OPTIONS
S.No Particulars Sample Size Percentage
1 Absolutely safe 77 15.01
2 Reasonably safe 62 12.09
3 Unsafe 374 72.90
TOTAL 513 100.00
INFERENCE: It can be analyzed from the above table that, majority of (72.90 percent) the respondents revealed that, futures and options are unsafe mode of investment in stock market. 12.09 percent of the respondents revealed that, futures and options are reasonably safe mode of investment in stock market and 15.01 percent revealed that, futures and options are absolutely safe mode of investment in stock market. It can be concluded from the above table that, for majority of the respondents futures and options are unsafe form of investment in stock market.
OPINION TOWARDS NATURE OF RISK ASSOCIATED WITH INVESTMENT IN COMMODITIES
TABLE 16: OPINION TOWARDS NATURE OF RISK ASSOCIATED WITH INVESTMENT IN COMMODITIES
S.No Particulars Sample Size Percentage
1 Absolutely safe 36 7.02
2 Reasonably safe 68 13.26
3 Unsafe 409 79.73
TOTAL 513 100.00
Source: Field Survey
INFERENCE: It can be observed from the above table that, majority of (79.73 percent) the respondents revealed that, commodities are unsafe mode of investment in stock market. 13.26 percent of the respondents revealed that, commodities are reasonably safe mode of investment in stock market and 7.02 percent revealed that, commodities are absolutely safe mode of investment in stock market. It can be concluded from the above table that, for majority of the respondents commodities are unsafe form of investment in stock market.
OPINION TOWARDS NATURE OF RISK ASSOCIATED WITH INVESTMENT IN AUTOMOBILE SECTOR
TABLE 17: OPINION TOWARDS NATURE OF RISK ASSOCIATED WITH INVESTMENT IN AUTOMOBILE SECTOR
S.No Particulars Sample Size Percentage
1 Absolutely safe 256 49.90
2 Reasonably safe 159 30.99
3 Unsafe 98 19.10
TOTAL 513 100.00
INFERENCE: It can be seen from the above table that, a majority of (49.90 percent) the respondents revealed that, it is absolutely safe to invest in automobile sector. 30.99 percent of the respondents revealed that, it is reasonably safe to invest in automobile sector and 19.10 percent of the respondents revealed that, it is unsafe to invest in automobile sector. It can be concluded that, majority of the respondents opined that, it is absolutely safe to invest in automobile sector.
OPINION TOWARDS NATURE OF RISK ASSOCIATED WITH INVESTMENT IN BANKING SECTOR
TABLE 18: OPINION TOWARDS NATURE OF RISK ASSOCIATED WITH INVESTMENT IN BANKING SECTOR
S.No Particulars Sample Size Percentage
1 Absolutely safe 263 51.27
2 Reasonably safe 149 29.04
3 Unsafe 101 19.69
TOTAL 513 100.00
Source: Field Survey
INFERENCE: It can be inferred from the above table that, a majority of (51.27 percent) the respondents revealed that, it is absolutely safe to invest in banking sector. 29.04 percent of the respondents revealed that, it is reasonably safe to invest in banking sector and 19.69 percent of the respondents revealed that, it is unsafe to invest in banking sector. It can be concluded that, majority of the respondents opined that, it is absolutely safe to invest in banking sector.
OPINION TOWARDS NATURE OF RISK ASSOCIATED WITH INVESTMENT IN CONSUMER DURABLES SECTOR
TABLE 19: OPINION TOWARDS NATURE OF RISK ASSOCIATED WITH INVESTMENT IN CONSUMER DURABLES SECTOR
S.No Particulars Sample Size Percentage
1 Absolutely safe 213 41.52
2 Reasonably safe 139 27.10
3 Unsafe 161 31.38
TOTAL 513 100.00
INFERENCE: It can be inferred from the above table that, a majority of (41.52 percent) the respondents revealed that, it is absolutely safe to invest in consumer durables sector. 27.10 percent of the respondents revealed that, it is reasonably safe to invest in consumer durables sector and 31.38 percent of the respondents revealed that, it is unsafe to invest in consumer durables sector. It can be concluded that, among the respondents, large section opined that, it is absolutely safe to invest in consumer durables sector.
OPINION TOWARDS NATURE OF RISK ASSOCIATED WITH INVESTMENT IN FMCG SECTOR
TABLE 20: OPINION TOWARDS NATURE OF RISK ASSOCIATED WITH INVESTMENT IN FMCG SECTOR
S.No Particulars Sample Size Percentage
1 Absolutely safe 284 55.36
2 Reasonably safe 151 29.43
3 Unsafe 78 15.20
TOTAL 513 100.00
Source: Field Survey
INFERENCE: It can be analyzed from the above table that, a majority of (55.36 percent) of the respondents revealed that, it is absolutely safe to invest in FMCG sector. 29.43 percent of the respondents revealed that, it is reasonably safe to invest in FMCG sector and 15.20 percent of the respondents revealed that, it is unsafe to invest in FMCG sector. It can be concluded that, among the respondents, majority opined that, it is absolutely safe to invest in FMCG sector.
OPINION TOWARDS NATURE OF RISK ASSOCIATED WITH INVESTMENT IN INFORMATION TECHNOLOGY SECTOR
TABLE 21: OPINION TOWARDS NATURE OF RISK ASSOCIATED WITH INVESTMENT IN INFORMATION TECHNOLOGY SECTOR
S.No Particulars Sample Size Percentage
1 Absolutely safe 121 23.59
2 Reasonably safe 117 22.81
3 Unsafe 275 53.61
TOTAL 513 100.00
INFERENCE: It can be observed from the above table that, a majority of (55.61 percent) the respondents revealed that, it is unsafe to invest in information technology sector. 22.81 percent of the respondents revealed that, it is reasonably safe to invest in information technology sector and 23.59 percent of the respondents revealed that, it is absolutely safe to invest in information technology sector. It can be concluded that, among the respondents, majority opined that, it is unsafe to invest in information technology sector.
OPINION TOWARDS NATURE OF RISK ASSOCIATED WITH INVESTMENT IN OIL AND GAS SECTOR
TABLE 22: OPINION TOWARDS NATURE OF RISK ASSOCIATED WITH INVESTMENT IN OIL AND GAS SECTOR
S.No Particulars Sample Size Percentage
1 Absolutely safe 185 36.06
2 Reasonably safe 149 29.04
3 Unsafe 178 34.70
TOTAL 513 100.00
Source: Field Survey
INFERENCE: It can be seen from the above table that, a majority of (36.06 percent) of the respondents revealed that, it is absolutely safe to invest in oil and gas sector. 29.04 percent of the respondents revealed that, it is reasonably safe to invest in oil and gas sector and 34.70 percent of the respondents revealed that, it is unsafe to invest in oil and gas sector. It can be concluded that, among the respondents, almost more than one third opined that, it is unsafe to invest in oil and gas sector.
OPINION TOWARDS NATURE OF RISK ASSOCIATED WITH INVESTMENT IN PUBLIC SECTOR UNDERTAKING SECTOR
TABLE 23: OPINION TOWARDS NATURE OF RISK ASSOCIATED WITH INVESTMENT IN PUBLIC SECTOR UNDERTAKING SECTOR
S.No Particulars Sample Size Percentage
1 Absolutely safe 118 23.00
2 Reasonably safe 272 53.02
3 Unsafe 123 23.98
TOTAL 513 100.00
INFERENCE: It can be inferred from the above table that, a majority of (53.02 percent) the respondents revealed that, it is reasonably safe to invest in public sector undertakings sector. 23.98 percent of the respondents revealed that, it is unsafe to invest in public sector undertakings sector and 23.00 percent of the respondents revealed that, it is absolutely safe to invest in public sector undertakings sector. It can be concluded that, among the respondents, majority opined that, it is reasonably safe to invest in public sector undertakings sector.
OPINION TOWARDS NATURE OF RISK ASSOCIATED WITH INVESTMENT IN REALTY SECTOR
TABLE 24: OPINION TOWARDS NATURE OF RISK ASSOCIATED WITH INVESTMENT IN REALTY SECTOR
S.No Particulars Sample Size Percentage
1 Absolutely safe 173 33.72
2 Reasonably safe 129 25.15
3 Unsafe 211 41.13
TOTAL 513 100.00
Source: Field Survey
INFERENCE: It can be inferred from the above table that, a majority of (41.13 percent) the respondents revealed that, it is unsafe to invest in Realty sector. 33.72 percent of the respondents revealed that, it is absolutely safe to invest in Realty sector and 25.15 percent of the respondents revealed that, it is reasonably safe to invest in Realty sector. It can be concluded that, among the respondents, only one third has opined that, it is absolutely safe to invest in Realty sector.
OPINION TOWARDS NATURE OF RISK ASSOCIATED WITH INVESTMENT IN HEALTH CARE SECTOR
TABLE 25: OPINION TOWARDS NATURE OF RISK ASSOCIATED WITH INVESTMENT IN HEALTH CARE SECTOR
S.No Particulars Sample Size Percentage
1 Absolutely safe 196 38.21
2 Reasonably safe 154 30.02
3 Unsafe 163 31.77
TOTAL 513 100.00
INFERENCE: It can be analyzed from the above table that, a majority of (38.21 percent) the respondents revealed that, it is absolutely safe to invest in health care sector. 31.77 percent of the respondents revealed that, it is unsafe to invest in health care sector and 30.02 percent of the respondents revealed that, it is reasonably safe to invest in health care sector. It can be concluded that, among the respondents, only little more than one third has opined that, it is absolutely safe to invest in health care sector.
OPINION TOWARDS NATURE OF RISK ASSOCIATED WITH INVESTMENT IN METALS SECTOR
TABLE 26: OPINION TOWARDS NATURE OF RISK ASSOCIATED WITH INVESTMENT IN METALS SECTOR
S.No Particulars Sample Size Percentage
1 Absolutely safe 288 56.14
2 Reasonably safe 175 34.11
3 Unsafe 50 9.75
TOTAL 513 100.00
Source: Field Survey
INFERENCE: It can be observed from the above table that, a majority of (56.14 percent) the respondents revealed that, it is absolutely safe to invest in metals sector. 34.11 percent of the respondents revealed that, it is reasonably safe to invest in metals sector and 9.75 percent of the respondents revealed that, it is unsafe to invest in metals sector. It can be concluded that, among the respondents, majority has opined that, it is absolutely safe to invest in metals sector.
OPINION TOWARDS NATURE OF RISK ASSOCIATED WITH INVESTMENT IN TECHNOLOGY SECTOR
TABLE 27: OPINION TOWARDS NATURE OF RISK ASSOCIATED WITH INVESTMENT IN TECHNOLOGY SECTOR
S.No Particulars Sample Size Percentage
1 Absolutely safe 214 41.72
2 Reasonably safe 107 20.86
3 Unsafe 192 37.43
TOTAL 513 100.00
INFERENCE: It can be seen from the above table that, a majority of (41.72 percent) the respondents revealed that, it is absolutely safe to invest in technology sector. 37.43 percent of the respondents revealed that, it is unsafe to invest in technology sector and 20.86 percent of the respondents revealed that, it is reasonably safe to invest in technology sector. It can be concluded that, among the respondents, there is a conflict of opinion that almost same number opined that, it is absolutely safe and unsafe to invest in technology sector.
OPINION TOWARDS NATURE OF RISK ASSOCIATED WITH INVESTMENT IN POWER SECTOR
TABLE 28: OPINION TOWARDS NATURE OF RISK ASSOCIATED WITH INVESTMENT IN POWER SECTOR
S.No Particulars Sample Size Percentage
1 Absolutely safe 225 43.86
2 Reasonably safe 141 27.49
3 Unsafe 147 28.65
TOTAL 513 100.00
Source: Field Survey
INFERENCE: It can be inferred from the above table that, a majority of (43.86 percent) of the respondents revealed that, it is absolutely safe to invest in power sector. 28.65 percent of the respondents revealed that, it is unsafe to invest in power sector and 27.49 percent of the respondents revealed that, it is reasonably safe to invest in power sector. It can be concluded that, among the respondents, a large section opined that, it is absolutely safe to invest in power sector.
OPINION TOWARDS NATURE OF RISK ASSOCIATED WITH INVESTMENT IN ELECTRONIC GOODS SECTOR
TABLE 29: OPINION TOWARDS NATURE OF RISK ASSOCIATED WITH INVESTMENT IN ELECTRONIC GOODS SECTOR
S.No Particulars Sample Size Percentage
1 Absolutely safe 216 42.11
2 Reasonably safe 159 30.99
3 Unsafe 138 26.90
TOTAL 513 100.00
INFERENCE: It can be inferred from the above table that, a majority of (42.11 percent) of the respondents revealed that, it is absolutely safe to invest in electronic goods sector. 26.90 percent of the respondents revealed that, it is unsafe to invest in electronic goods sector and 30.99 percent of the respondents revealed that, it is reasonably safe to invest in electronic goods sector. It can be concluded that, among the respondents, a large section opined that, it is absolutely safe to invest in electronic goods sector.
WORRIES ABOUT STOCK MARKET – TOO MUCH VOLATILITY AND PRICE FLUCTUATION
TABLE 30: WORRIES ABOUT STOCK MARKET- TOO MUCH VOLATILITY AND PRICE FLUCTUATION
S.No Particulars Sample Size Percentage
1 1st reason to worry 152 29.63
2 2nd reason to worry 157 30.60
3 3rd reason to worry 204 39.77
TOTAL 513 100.00
Source: Field Survey
INFERENCE: It can be analyzed from the above table that, a majority of (39.77 percent) of the respondents revealed that, it is too much volatility and price fluctuation is the third reason to worry about the stock markets. 30.60 percent of the respondents revealed that, it is too much volatility and price fluctuation is the second reason to worry about the stock markets and 29.63 percent of the respondents revealed that, it is too much volatility and price fluctuation is the first reason to worry about the stock markets. It can be concluded that, among the respondents a large section has opined that too much volatility and price fluctuation is the third reason to worry about the stock markets.
WORRIES ABOUT STOCK MARKET – CORPORATE MISMANAGEMENT AND FRAUD
TABLE 31: WORRIES ABOUT STOCK MARKET- CORPORATE MISMANAGEMENT AND FRAUD
S.No Particulars Sample Size Percentage
1 1st reason to worry 184 35.87
2 2nd reason to worry 171 33.33
3 3rd reason to worry 158 30.80
TOTAL 513 100.00
INFERENCE: It can be observed from the above table that, a majority of (35.87 percent) of the respondents revealed that, it is corporate mismanagement and fraud is the first reason to worry about the stock markets. 33.33 percent of the respondents revealed that, it is corporate mismanagement and fraud is the second reason to worry about the stock markets and 30.80 percent of the respondents revealed that, it is corporate mismanagement and fraud is the third reason to worry about the stock markets. It can be concluded that, among the respondents a large section has opined that corporate mismanagement and fraud is the first reason to worry about the stock markets. Hence, it is suggested that the companies should practice good corporate governance by disclosing true accounting and financial position. The indulgence in unethical and unscrupulous activities will erode the investor confidence in the companies. The balance sheet should be transparent and reflect the true financial position of the company.
WORRIES ABOUT STOCK MARKET – UNFAIR PRACTICES OF BROKERS
TABLE 32: WORRIES ABOUT STOCK MARKET- UNFAIR PRACTICES OF BROKERS
S.No Particulars Sample Size Percentage
1 1st reason to worry 177 34.50
2 2nd reason to worry 185 36.06
3 3rd reason to worry 151 29.43
TOTAL 513 100.00
Source: Field Survey
BEST METHOD OF INVESTMENT IN SHARES
TABLE 33: BEST METHOD OF INVESTMENT IN SHARES
S.No Particulars Sample Size Percentage
1 Buying through IPO 211 41.13
2 Buying through stock exchange 259 50.49
3 Can’t say 43 8.38
TOTAL 513 100.00
Source: Field Survey
INFERENCE: It can be inferred from the above table that, majority of (50.49 percent) of the respondents opined that it is best to buy shares through stock exchange i.e., secondary market. 41.13 percent of the respondents opined that it is best to buy shares through IPO i.e., primary market and 8.38 percent of the respondents can’t say any opinion. It can be concluded that majority of the respondents opined that it is best to buy shares through stock exchange i.e., secondary market.
USUAL POLICY OR STRATEGY OF INVESTING IN EQUITY SHARES
TABLE 34: USUAL POLICY OR STRATEGY OF INVESTING IN EQUITY SHARES
S.No Particulars Sample Size Percentage
1 Mostly sell the shares in days or weeks
252 49.12
2 Mostly hold and sell the shares in months
197 38.40
3 Mostly hold and sell the shares in years
64 12.48
TOTAL 513 100.00
Source: Field Survey
MONITORING OF SHARE PRICE MOVEMENTS IN MEDIA
TABLE 35: MONITORING OF SHARE PRICE MOVEMENTS IN MEDIA
S.No Particulars Sample Size Percentage
1 Daily and continuously 316 61.60
2 Irregularly 169 32.94
3 Very rarely 28 5.46
TOTAL 513 100.00
Source: Field Survey
INFERENCE: It can be analyzed from the above table that, a majority of (61.60 percent) of the respondents monitor share prices in media daily and continuously. 32.94 percent of the respondents monitor share prices in media irregularly and 5.46 percent of the respondents monitor share prices in media very rarely. It can be concluded that, majority of respondents monitor share prices in media daily and continuously. Hence it is suggested that the media should guide the investors properly in investing their hard earned money. The media should invite stock market experts to give valuable tips to the potential investors through their programmes. The media should also conduct programmes to create awareness about investment in stock market operations. They should also educate the uneducated investors about technical analysis and fundamental analysis and intricacies involved in stock market trading.
ROLE OF SEBI IN REGULATING THE MARKET
TABLE 36: ROLE OF SEBI IN REGULATING THE MARKET
S.No Particulars Sample Size Percentage
1 Active role 229 44.64
2 Not so active 253 49.32
3 Can’t say 31 6.04
TOTAL 513 100.00
Source: Field Survey
irregularities, corporate mis-governance, insider trading and price rigging of companies. The SEBI should be given proper teeth to check and to regulate the activities of companies.
OVERALL SATISFACTION TOWARDS REGULATION OF STOCK MARKET
TABLE 37: OVERALL SATISFACTION TOWARDS REGULATION OF STOCK MARKET
S.No Particulars Sample Size Percentage
1 Highly Satisfied 53 10.33
2 Moderately Satisfied 217 42.30
3 Dissatisfied 293 57.12
TOTAL 513 100.00
Source: Field Survey
INFERENCE: It can be seen from the above table that, a majority of (57.12 percent) the respondents expressed their opinion as dissatisfaction, 42.30 percent are moderately satisfied and 10.33 percent are highly satisfied. It can be concluded that there is lot of dissatisfaction with regard to overall satisfaction towards regulation of stock markets.
TESTING OF HYPOTHESIS
HYPOTHESIS TO TEST WHETHER RISK IS ASSOCIATED WITH INVESTMENT IN METALS SECTOR AND TECHNOLOGY SECTOR
1. STATEMENT OF THE PROBLEM: Whether there is any secured investment in Metal Sector or Technology sector.
2. HYPOTHESIS 1
H0 = Technology Sector is a highly secured for investment
H1 – Metal Sector is a highly secured for investment
3. STATE THE DECISION RULE: Accept the null hypothesis H03 if the calculated value of χ2
is less than or equal to the table value. Reject H03 if the calculated value of χ2
Particulars Technology
(Actual)
Metal (Actual)
Tech
(Expected)
Metal (Expected )
Absolutely safe 214 288 251 251
Reasonably safe 107 175 141 141
Unsafe 192 50 121 121
The χ2
statistic for the above data = 9.49
4. TABLE VALUE
d.f (c-1) (r-1) = (2-1) (3-1) = 2.
For 2 d.f the table value χ2
at 5% LOS = 5.99.
5. MAKE DECISION: Since the calculated value of χ2 (=9.49) is greater than the table value of χ2
(= 5.99) at 0.05%, as per decision rule reject the H03 i.e., accept H13. That means Technology sector is an unsecured for investment and Metal sector is highly secured and absolutely safe for investment.
HYPOTHESIS TO TEST WHETHER RISK IS ASSOCIATED WITH INFORMATION TECHNOLOGY AND PUBLIC SECTOR
1. STATEMENT OF THE PROBLEM: Whether the investment in Information
Technology and Public sectors undertaking are too risky for investment.
2. HYPOTHESIS 2
H0 = Low Risk in Information Technology for investment
H1 = Low Risk in Public Sector undertaking for investment
3. STATE THE DECISION RULE: Accept the null hypothesis H04 if the calculated value of χ2
is less than or equal to the table value. Reject H04 if the calculated value of χ2
is more than the table value.
Particulars IT
(Actual)
Public Sector (Actual)
IT
(Expected)
Public Sector (Expected )
Absolutely safe 121 118 119.5 119.5
Reasonably safe
117 272
194.5 194.5
The χ2
statistic for the above data = 9.44
4. TABLE VALUE
d.f (c-1) (r-1) = (2-1) (3-1) = 2.
For 2 d.f the table value χ2 at 5% LOS = 5.99.
5. MAKE DECISION: Since the calculated value of χ2 (= 9.44) is greater than the table value of χ2
(= 5.99) at 0.05%, as per decision rule reject the H04 i.e., accept H14. That means Public Sector Undertaking is a Low risk and absolutely safe for investment and Information Technology sector is highly risk for investment.
HYPOTHESIS TO TEST WHETHER THE OPINION THAT CORPORATE MISMANAGEMENT AND FRAUD IS VERY COMMON IN INDIA STOCK MARKET
1. STATEMENT OF THE PROBLEM: Whether the investment in Information
Technology and Public sectors undertaking are too risky for investment.
2. HYPOTHESIS 3
H0 = There is a Corporate Mismanagement and fraud is very common in India Stock Market
H1 = There is no Corporate Mismanagement and fraud is very common in India Stock Market
3. STATE THE DECISION RULE: Accept the null hypothesis H05 if the calculated value of χ2 is less than or equal to the table value. Reject H05 if the calculated value of χ2
is more than the table value.
Particulars IT
(Actual)
Not invested (Expected )
Absolutely safe 184 0.988
Reasonably safe 171 0
Unsafe 158 0.988
The χ2
statistic for the above data = 1.976
4. TABLE VALUE
d.f (c-1) (r-1) = (2-1) (3-1) = 2.
5. MAKE DECISION: Since the calculated value of χ2 (= 1.976) is less than the table value of χ2
(= 5.99) at 0.05%, as per decision rule accept the H05. That means reasonably safe in Corporate Mismanagement and fraud is very common in India Stock Market.
ANALYSIS OF VARIANCE
1. STATEMENT OF THE PROBLEM: Whether the opinion towards nature of risk
associated with different investment avenues of capital markets
2. HYPOTHESIS 4
H0 = There is no significant differences between investment avenues
H1 = There is a significant differences between investment avenues
S.No Particulars IT O&G PSU Metal EG
1 Absolutely safe 121 185 118 288 216
2 Reasonably safe 117 149 272 175 159
3 Unsafe 275 178 123 50 138
ANOVA: Single Factor
Groups Count Sum Average Variance
Row 1 5 928 185.6 5038.3
Row 2 5 872 174.4 3425.8
Row 3 5 764 152.8 6810.7
ANOVA TABLE
Source of Variation SS df MS Computed F P-value F crit
Between Groups 2779.733 2 1389.867 0.272972 0.765715 3.885294
Within Groups 61099.2 12 5091.6
Total 63878.93 14
value (3.88), we reject H1 and accept H0 and concluded that there is no significant difference in the investment avenues. Hence all investments avenues are reasonable safe for investment.
SUGGESTIONS
1. It is suggested in view of the importance of media, more programmes on stock market operations should be carried out to increase awareness level of investors. The business newspapers and magazines should also give technical analysis and fundamental analysis about different companies and industries in such a language understandable to all the investors across India irrespective of their educational level.
2. It is suggested that a great deal of awareness about futures and options must be created among potential investors in view of the importance of futures and options trade. The awareness level is very low. As such SEBI and other government agencies have to undertake adequate measures to create awareness.
3. It is suggested that a great deal of awareness about commodities trading must be created among potential investors in view of the importance of commodities trade. The awareness level is very low. As such SEBI and other government agencies have to undertake adequate measures to create awareness.
4. It is suggested that the companies should practice good corporate governance by disclosing true accounting and financial position. The indulgence in unethical and unscrupulous activities will erode the investor confidence in the companies. The balance sheet should be transparent and reflect the true financial position of the company.
5. It is suggested that the media should guide the investors properly in investing their hard earned money. The media should invite stock market experts to give valuable tips to the potential investors through their programmes. The media should also conduct programmes to create awareness about investment in stock market operations. They should also educate the uneducated investors about technical analysis and fundamental analysis and intricacies involved in stock market trading.
6. It is suggested that SEBI has to play very active role in protecting the interest of the investors by regulating the companies. They should check the irregularities, corporate mis-governance, insider trading and price rigging of companies. The SEBI should be given proper teeth to check and to regulate the activities of companies.
7. It is suggested that awareness levels of potential investors towards debentures should be increased in view of the safety and security of debentures.
8. It is suggested that awareness levels about unit linked plans should be increased as they serve the dual purpose – investment and insurance.
9. It is suggested that measures must be taken to create awareness about gold traded funds so as to avoid the possibility of wear and tear and depreciation associated with custody of gold.
that measures should be taken to develop confidence among investors about mutual funds.
LIMITATIONS OF THE STUDY
In a study of this magnitude though, meticulous care has been taken in each and every aspect of study. Certain limitations are likely to be there in the study.
1. Since the study is a sample based and undertaken in Anantapur District, Andhra Pradesh, the findings of the study may have the limitation of generalization to the entire population.
2. Despite the care taken to understand the feelings and opinions of the respondents, some articulation error may have crept into the study.
3. Some respondents may not be aware of certain latest procedures and aspects of stock market.
4. A few respondents were hesitant to give details.
5. There might be a sense of bias crept in answers given by the respondents.
6. The conclusion may or may not be generalized since the study is confined to Anantapur District of Andhra Pradesh only.
REFERENCES
1. Grewal S.S., (1983), Making Money on the Stock Market – A Practical Hand Book, Vision Books, New Delhi, P. VI.
2. Roshni Jayakar, BSE: Then And Now, Business Today, January, 20, 2002, P. 63.
3. Preethi Singh , 2000, Investment Management- Security Analysis and Portfolio Management , Himalaya Publishing House, Mumbai, P. 25.
4. Mitra N.L., “ Report on Investor Protection”., Centre for Business Law Studies, Bangalore, 2001.
5. Mishra A. K., “Marketing of Financial Services of Corporate Security Market- The Indian Journal of Commerce, December 1992, Vol. No. XLV Part-IV, No. 173.
6. Prasanna Chandra “Investment in Corporate Securities- A Study of Small Investors in Andhra Pradesh”, Un-published Ph.D thesis, Kakatiya University, Warangal, Andhra Pradesh. p.13.
7. Laxman Swaroop., “Towards a Vibrant Capital Market”., The Journal of Commerce, September 1991, Vol. XLIV, Part-III, No.168. P.85.