Selection and evaluation of potential reference genes
for gene expression analysis in
Avena fatua
Junjie Liu
†, Peng Li
†, Liuyang Lu, Lanfen Xie, Xiling Chen*, Baizhong Zhang*
College of Resources and Environment, Henan Institute of Science and Technology,Xinxiang, P.R. China
*Corresponding authors: [email protected]; [email protected]
Citation: Liu J., Li P., Lu L., Xie L., Chen X., Zhang B. (2019): Selection and evaluation of potential reference genes for gene expression analysis in Avena fatua. Plant Protect. Sci., 55: 61–71.
Abstract: Eight commonly used candidate reference genes, 18S ribosomal RNA (rRNA) (18S), 28S rRNA (28S), actin (ACT), glyceraldehyde-3-phosphate dehydrogenase (GAPDH), elongation factor 1 alpha (EF1α), ribosomal protein L7 (RPL7), Alpha-tubulin (α-TUB), and TATA box binding protein-associated factor (TBP), were evalu-ated under various experimental conditions to assess their suitability in different developmental stages, tissues and herbicide treatments in Avena fatua. The results indicated the most suitable reference genes for the different experimental conditions. For developmental stages, 28S and EF1α were the optimal reference genes, both EF1α and 28S were suitable for experiments of different tissues, whereas for herbicide treatments, GAPDH and ACT were suitable for normalizations of expression data. In addition, GAPDH and EF1α were the suitable reference genes. Keywords: wild oat; expression; herbicide
The internal control of target gene measurement refers to the use of reference gene expression varia-tion and is the currently preferred method for nor-malising quantitative real-time reverse transcription polymerase chain reaction (qPCR) data because reference genes can capture all nonbiological varia-tions (Logan et al. 2009). Although no gene exhibits constant expression under all experimental condi-tions, studies of validating reference genes have been driven by several algorithms and freely available software – geNorm (Vandesompele et al. 2002), BestKeeper (Pfaffl et al. 2004), and NormFinder (Andersen et al. 2004).
qPCR is generally characterise as an effective, sensitive, and economical methods, it has already widely applied to analyse gene expression in
bio-logical research (Overbergh 2003; Luet al. 2013; Lianget al. 2014). However, there remain a number of problems have not yet been settled. One of the biggest challenges in qPCR analysis is normalisation of the variations arise from some mistakes in RNA extraction and purification, reverse transcription, efficiency of PCR amplification, etc. (Bustinet al.
2009). Several strategies have been processed to normalise these variations in qPCR analysis; these include normalisation of sample size, ensuring the quality and quantity of RNA, and removing DNA con-tamination (Huggettet al. 2005). Of such strategies, the most widely used is the selection of appropriate reference gene to normalise nonspecific variation or errors (Lianget al. 2014). The expression of several conventional reference genes, including 18S RNA,
†These authors contributed equally to this study.
ACT, and GAPDH has been demonstrated to change broadly under particular experimental conditions or in response to external stimuli (Glareet al. 2002; Ma
et al. 2016). Clearly, for given a set of experimental
biological samples, selecting suitable reference genes for use in the normalisation of qPCR data is quite urgent as several conventional reference genes are not always stable under all conditions.
Wild oat (Avena fatua L.) is a typical annual weeds of temperate agricultural regions in the world (Holm
et al. 1977). At the same time, it is also a malignant
weed that harms wheat, oilseed rape, and other crops in China and has developed serious resistance to herbicides all over the world (Cavan et al. 2001). In recent years, qPCR has been widely used to quantify gene expression levels in diverse studies of A. fatua, such as studies of herbicide resistance and ecologi-cal adaption (Li et al. 2009; Cruzhipolitoet al.
2011; Keithet al. 2015). Some studies have shown that at least two or three reference genes should be used to achieve accurate normalisation (Thellin
et al. 1999; Vandesompeleet al. 2002). However,
in the aforementioned studies, the researchers used only one reference gene (18S, GAPDH, or ACT) to normalise the variation in mRNA levels of genes of interest for all of the diverse experimental conditions. These less than ideal experimental practices likely resulted from a lack of empirical data about which reference genes in A. fatua are most appropriate for qPCR gene expression analysis. It is clear that several reference genes should ensure a more stable expression analysis. However, if only one suitable reference gene could be identified, this may be the case in a particular case. Much more important in such situations are the experimental conditions, the variations in the data and their interpretations.
The reference gene has seldom been verified sys-tematically in weeds. A reference gene checking is quite urgent to ensure proper normalisation in
A. fatua. These less than ideal experimental
prac-tices likely resulted from a lack of empirical data about which reference genes in A. fatua are most appropriate for qPCR gene expression analysis. We conducted the present study to ameliorate this situa-tion and to enable the empirically informed selecsitua-tion of suitable reference genes for future studies with
A. fatua. Eight commonly used normalisation genes
(18S, 28S, ACT, GAPDH, EF1α, RPL7, α-TUB, and
TBP) were selected for analysis of their performance under several different experimental conditions in
A. fatua. After this analysis, two target genes, HSP70
and AfatCYP71D7were selected and used to validate the performance of the reference genes. Our results may offer some suggestion for the selection of suit-able, reliable reference genes in modern molecular genetic analyses in A. fatua.
MATERIAL AND METHODS
Seeds of A. fatua.Seeds of A. fatua used in this research were harvested in 2010 from wheat fields in Xinxiang of Henan Province, China, and had been stored for more than 7 years.
Cultivation of seedlings. The greenhouse potting methods of (Li et al. 2010) were adopted. The seeds
of A. fatua were sown into pots with a surface area
of 75 cm2. The soil surface with the unused
herbi-cide was mixed with a proportion of grass biochar, sifted and cultured in the greenhouse. Rearing con-ditions were 20°C in the daytime and 15°C at night, 75 ± 5% relative humidity, and a 12 : 12 h light/dark photoperiod.
Biotic factors.To compare developmental stages, foliar parts from the 1-leaf, 2-leaf, and 3-leaf stage were collected in RNase-free tubes for each replica-tion. The samples were collected in triplicate and then snap frozen in liquid nitrogen before being stored at –80°C for RNA extraction. Each experiment was completed using five plants (i.e., at least three biological replicates).
To compare different tissues, the roots, stems, and leaves from the 3-leaf stage were collected in RNase-free tubes for each replication. The samples were collected in triplicate and then snap frozen in liquid nitrogen before being stored at –80°C for RNA extraction. Each experiment was completed using five plants (i.e., at least three biological replicates).
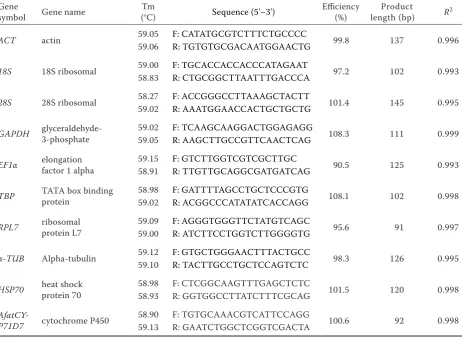
Reference gene selection and primer design. Eight commonly used reference genes were selected, in-cluding 18S ribosomal RNA (rRNA) (18S), 28S rRNA (28S), actin (ACT), glyceraldehy3-phosphate de-hydrogenase (GAPDH), elongation factor 1 alpha (EF1α), ribosomal protein L7 (RPL7), Alpha-tubulin (α-TUB), and TATA box binding protein-associated factor (TBP). Primer Premier 3.0 software was used to design the primers. Details on the primers used in this study are listed in Table 1.
RNA extraction and cDNA synthesis. To synthe-sise cDNA, RNA was isolated using TRIzol reagent (Invitrogen, Carlsbad, USA) according to the manu-facturer’s instructions. Total RNA was (1 µg) was reverse transcribed into First-strand complementary DNA using a PrimeScript RT reagent kit with gDNA Eraser (Takara, Dalian, China) according to the manu-facturer’s instructions and stored at –20°C until use. Quantitative real-time PCR (qPCR). ROX’s Plati-num SYBR Green qPCR SuperMix-UDG kit (Invit-rogen) was used for qPCR and implementing on an
Applied Biosystems 7500 Real-Time PCR system (Applied Biosystems, Foster City, USA). The reac-tions were performed in a 20 µl volume of a mixture containing 1 µl of cDNA template, 10 µl of SYBR Green qPCR SuperMix-UDG, 0.3 µl of each primer, and 8.7 µl of nuclease-free water. The thermocycling program was as follows: 50°C for 2 min, 95°C for 2 min, and 40 cycles of 95°C for 15 s, and 55°C for 30 seconds. To acquire a high specificity amplifica-tion, a melting curve analysis between 65°C to 95°C, was constructed at the end of each PCR run. And it based on a 2-fold dilution series of cDNA (1 : 5, 1 : 10, 1 : 10, 1 : 10, 1 : 20, and 1 : 40). The corresponding qPCR efficiencies (E) were calculated refer to the formula E = 10–1/slope – 1 (Pfaffl 2001; Tellinghuisen 2014; Spiess et al. 2015, 2016). Each sample was prepared as two biological replicates, and each reaction was analysed with three technical replications.
[image:3.595.66.529.402.741.2]Analysis of the stability of reference gene expres-sion. The expression stability of the eight selected reference genes was evaluated with the delta cycle
Table 1. Primers used in the study
Gene
symbol Gene name (°C)Tm Sequence (5'–3') Efficiency (%) length (bp)Product R2
ACT actin 59.0559.06 F:R:CATATGCGTCTTTCTGCCCCTGTGTGCGACAATGGAACTG 99.8 137 0.996
18S 18S ribosomal 59.0058.83 F:R:TGCACCACCACCCATAGAATCTGCGGCTTAATTTGACCCA 97.2 102 0.993
28S 28S ribosomal 58.27 F:ACCGGGCCTTAAAGCTACTT 101.4 145 0.995
59.02 R:AAATGGAACCACTGCTGCTG
GAPDH glyceraldehyde-3-phosphate 59.02 F:TCAAGCAAGGACTGGAGAGG 108.3 111 0.999
59.05 R:AAGCTTGCCGTTCAACTCAG
EF1α elongation factor 1 alpha 59.15 F:GTCTTGGTCGTCGCTTGC 90.5 125 0.993
58.91 R:TTGTTGCAGGCGATGATCAG
TBP TATA box binding protein 58.9859.02 F:R:GATTTTAGCCTGCTCCCGTGACGGCCCATATATCACCAGG 108.1 102 0.998
RPL7 ribosomal protein L7 59.09 F:AGGGTGGGTTCTATGTCAGC 95.6 91 0.997
59.00 R:ATCTTCCTGGTCTTGGGGTG
α-TUB Alpha-tubulin 59.12 F:GTGCTGGGAACTTTACTGCC 98.3 126 0.995
59.10 R:TACTTGCCTGCTCCAGTCTC
HSP70 heat shock protein 70 58.98 F: CTCGGCAAGTTTGAGCTCTC 101.5 120 0.998
58.93 R: GGTGGCCTTATCTTTCGCAG
AfatCY-P71D7 cytochrome P450 58.9059.13 F: TGTGCAAACGTCATTCCAGGR: GAATCTGGCTCGGTCGACTA 100.6 92 0.998
threshold (Ct) method (ΔCt method) and three com-monly used software tools: geNorm v3.5 (
Vandesom-peleet al. 2002), Normfinder v0.953 (Andersen et
al. 2004), and BestKeeper (Pfaffl et al. 2004). The geNorm software initially calculates the value of gene expression stability (M) and generates a stabil-ity ranking; genes with the lowest M value have the most stable expression. Accurate normalisation of two sequential factors is essential, which is generated by calculates pairwise variation Vn/n+1 through geNorm. A Vn/n+1 ratio below 0.15 suggest that the use of an additional reference gene would not significantly improve normalisation. NormFinder software is a model-based approach to identifying suitable refer-ence genes for use in normalisation (Andersenet al.
2004). The candidate gene with the lowest value is considered to be the most stable. The MS Excel-based software BestKeeper and ΔCt method were also used to select optimal reference genes. A user-friendly web based comprehensive tool, RefFinder online (http://150.216.56.64/referencegene.php) to evalu-ate and select reference genes. RefFinder combines the aforementioned major computational programs (ΔCt method, geNorm, Normfinder, and BestKeeper) to compare and rank the tested candidate reference genes. And it also assigns an appropriate weight to each gene and calculates the geometric mean of the weights for the final ranking.
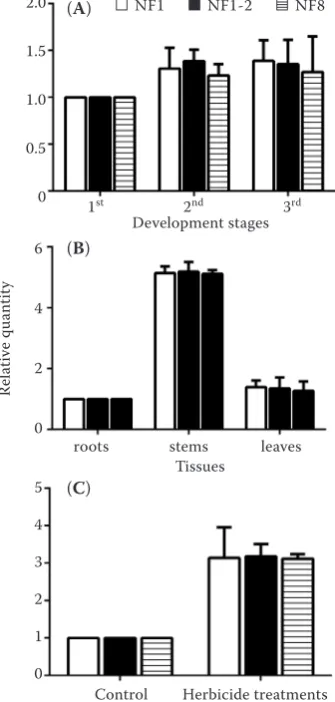
Validation of reference gene selection. To evalu-ate the validity of the optimised selection of reference genes, expression levels of the heat shock protein 70 gene (HSP70) and AfatCYP71D7were analysed under different experimental conditions (different tissues, developmental stages and herbicide treatments). For each experimental condition, the expression profiles of the gene HSP70 and AfatCYP71D7were normalised using only one reference gene (the most stable reference gene [NF1] and the least stable reference gene [NF8]) and several stable reference genes (NF(1-n)) recom-mended by RefFinder. The relative expression levels
of HSP70 andAfatCYP71D7in different samples were
calculated following the 2–ΔΔCt method (Pfaffl 2001).
Statistical analysis. Data statistics and bioassay analysis were performed on MS Excel (2010) and Polo (Probit and Logit Analysis) (LeOra Software Company, Petaluma, USA). The target gene expres-sion normalised by the least stable reference gene, and the recommended combination of reference genes were calculated by one-way ANOVA using the software InStat v3.0 (GraphPad Software, San Diego, USA) with a significance level set at P < 0.05.
RESULTS
PCR amplification efficiencies and expression levels of candidate reference genes
Traditional PCR was used to evaluate the primer specificity of the eight reference genes and the one target gene of interest used. Melting curve analysis showed that there were single peaks for each primer pair, which further demonstrated that each primer pair amplified a unique product. A standard curve was generated for each gene using five-fold serial dilutions of cDNA. The amplification efficiencies of all the primer pairs were between 90.5% and 108.1%, and the coefficient of determination (R2) ranged from
0.993 to 0.999 (Table 1).
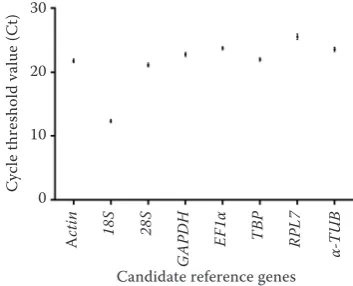
The Ct values have been created to compare the transcript abundance of the selected genes in differ-ent samples. The mean Ct values of the eight refer-ence genes varied significantly. The means of the Ct values ranged from 12.35 to 25.52, with the lowest and highest Ct values obtained from 18S (12.35) and
RPL7 (25.52). RPL7 (25.52 ± 0.43) had the highest
mean expression levels, followed by EF1α (23.76 ± 0.25), α-TUB(23.54 ± 0.35), GAPDH (22.76 ± 0.31),
TBP (21.97 ± 0.27), ACT (21.75 ± 0.30), 28S (21.11 ± 0.30), and 18S (12.35 ± 0.26) (Figure 1).
Expression stability of the candidate reference genes
[image:4.595.312.489.586.729.2]Developmental stages. The overall expression stability rankings produced by the two methods (△Ct method and NormFinder) were almost identical, the top two stable reference genes were 28S and EF1α. Interestingly, EF1α was identified by BestKeeper as
Figure 1. Expression levels of candidate reference genes of A. fatua
Candidate reference genes
A
cti
n
18S 28S
G
A
PD
H
EF1α TBP RPL
7
α-T
U
B
C
yc
le t
hr
es
hold v
alue (C
t) 30
20
10
the less unstably expressed reference gene, RPL7
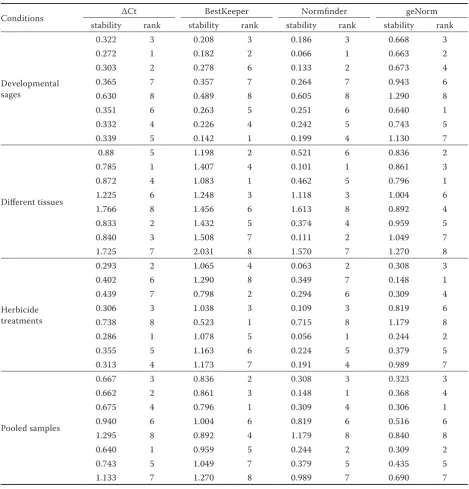
and 28S was identified by BestKeeper as the most stably expressed reference genes. The geNorm ranked GAPDHand 28Sas the top two stable reference genes (Table 2). According to the RefFinder method, the stability rankings from the most stable to the least stable across different developmental stages were as follows: 28S, EF1α, RPL7, TBP, α-TUB, GAPDH, ACT,
and 18S (Figure 2A). For geNorm analysis, all of the Vn/n+1 values were below the threshold of P < 0.15 (Figure 3), indicating that the two most stable genes
are required for normalisation. Therefore, for the developmental stage experiments, 28S and EF1α
were appropriate to normalisation.
Different tissues. The stability rankings produced by BestKeeper, and geNorm were similar, that EF1α and TBP were confirmed as the two most stably expressed reference genes. However, △Ct method and NormFinder analysis indicated EF1α and TBP
[image:5.595.63.533.110.600.2]were less unstably expressed reference genes. ΔCt method identified 28S and GAPDH, and NormFinder identified 28S and α-TUB as the most stably expressed Table 2. Expression stability of the candidate reference genes under different experimental conditions
Conditions ΔCt BestKeeper Normfinder geNorm
stability rank stability rank stability rank stability rank
Developmental sages
0.322 3 0.208 3 0.186 3 0.668 3
0.272 1 0.182 2 0.066 1 0.663 2
0.303 2 0.278 6 0.133 2 0.673 4
0.365 7 0.357 7 0.264 7 0.943 6
0.630 8 0.489 8 0.605 8 1.290 8
0.351 6 0.263 5 0.251 6 0.640 1
0.332 4 0.226 4 0.242 5 0.743 5
0.339 5 0.142 1 0.199 4 1.130 7
Different tissues
0.88 5 1.198 2 0.521 6 0.836 2
0.785 1 1.407 4 0.101 1 0.861 3
0.872 4 1.083 1 0.462 5 0.796 1
1.225 6 1.248 3 1.118 3 1.004 6
1.766 8 1.456 6 1.613 8 0.892 4
0.833 2 1.432 5 0.374 4 0.959 5
0.840 3 1.508 7 0.111 2 1.049 7
1.725 7 2.031 8 1.570 7 1.270 8
Herbicide treatments
0.293 2 1.065 4 0.063 2 0.308 3
0.402 6 1.290 8 0.349 7 0.148 1
0.439 7 0.798 2 0.294 6 0.309 4
0.306 3 1.038 3 0.109 3 0.819 6
0.738 8 0.523 1 0.715 8 1.179 8
0.286 1 1.078 5 0.056 1 0.244 2
0.355 5 1.163 6 0.224 5 0.379 5
0.313 4 1.173 7 0.191 4 0.989 7
Pooled samples
0.667 3 0.836 2 0.308 3 0.323 3
0.662 2 0.861 3 0.148 1 0.368 4
0.675 4 0.796 1 0.309 4 0.306 1
0.940 6 1.004 6 0.819 6 0.516 6
1.295 8 0.892 4 1.179 8 0.840 8
0.640 1 0.959 5 0.244 2 0.309 2
0.743 5 1.049 7 0.379 5 0.435 5
reference genes (Table 2). According to the RefFinder method, the stability rankings from the most stable to the least stable across different developmental stages were as follows: EF1α, 28S, TBP, GAPDH,
α-TUB, ACT, RPL7, and 18S (Figure 2B). For geNorm
analysis, the V2/3 was below the threshold of P < 0.15 (Figure 3). Thus, two reference genes were enough to normalise the gene expression levels in qPCR analy-ses. Therefore, EF1α and 28S were the most suitable for normalising qPCR data in the different tissues.
Herbicide treatments. ΔCt method and Norm- Finder identified GAPDH and TBP as the most stably expressed reference genes, 18S was identified as the least stably expressed reference gene. However, Best-Keeper identified 18S and EF1α, and geNorm identi-fied 28S and GAPDHas the most stably expressed reference genes (Table 2). According to the RefFinder method, the stability rankings from the most stable to the least stable across herbicide treatments were as follows: GAPDH, ACT, TBP, RPL7, 18S, EF1α, α-TUB, and 28S (Figure 2C). For geNorm analysis, all of the Vn/n+1 values were below the 0.15 cut-off value following geNorm analysis (Figure 3). GAPDH
andACT were suggested for normalising the qPCR data in theherbicide treatments.
Pooled data of various conditions. The stability rankings produced by Ct methods and NormFinder were similar, that 28S and GAPDH were confirmed as the two most stably expressed reference genes. However, BestKeeper identified EF1α and TBP, and geNorm identified EF1α and GAPDH as the most stably expressed reference genes (Table 2). According to the RefFinder method, the stability rankings from the most stable to the least stable across pooled data of various conditions were as follows: GAPDH, EF1α,
28S, TBP, α-TUB, ACT, 18S, and RPL7 (Figure 2D). For
geNorm analysis, all of the Vn/n+1 values were below the 0.15 cut-off value following geNorm analysis (Fig-ure 3). GAPDHand EF1α was suggested for normalising the qPCR data in pooled data of various conditions.
Validation of reference gene selection
To distinguish the performance of selected refer-ence genes, the expression level of HSP70 and Afat-Figure 2. Expression stability of the candidate reference genes under different experimental conditions: (A) develop-ment stage, (B) tissues, (C) herbicide treatments, and (D) all samples
Candidate reference genes
G
eome
an of rank
ing v
alue
EF1α 28S TBP
G
A
PD
H
α-T
U
B
Acti
n
RPL
7
18S
8
6
4
2
0 10
8
6
4
2
0
18S EF1α RPL7 TBP
α-T
U
B
G
A
PD
H
Acti
n
28S
G
A
PD
H
Acti
n
TBP RPL7 18S EF1α
α-T
U
B
28S
8
6
4
2
0
G
A
PD
H
EF1α 28S TBP α-TU
B
Acti
n
18S RPL7
8
6
4
2
0
(A) (B)
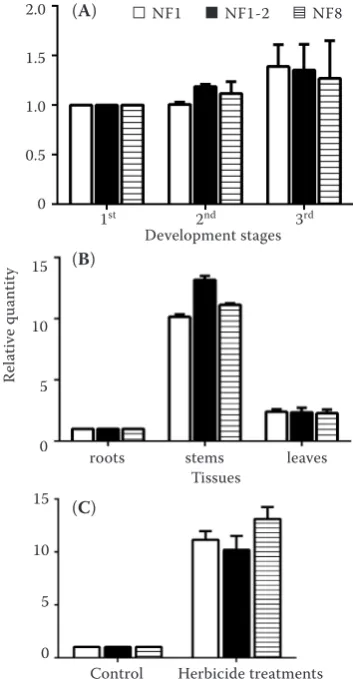
CYP71D7was analysed in the same experimental conditions used to compare the expression stability of the reference genes. Similar expression levels were obtained in the developmental stage experiments when normalised using the most stable reference gene (28S) and the combination of the two most stable reference genes (28S and EF1α), and HSP70
transcript levels were higher in 3-leaf stage compared with both 1-leaf stage and 2-leaf stage. In addition, when normalised with the least stable reference gene (18S), the HSP70 transcript levels were also higher in 3-leaf stage compared with both 1-leaf stage and 2-leaf stage (Figure 4A). For the experiments with different tissues, the HSP70 transcript level was higher in the stems than in the other two tissues, no matter whether it was normalised by the most stable reference gene (EF1α), the combination of the two most stable reference genes (EF1αand 28S), or the least stable reference gene (18S). However, the
HSP70 transcript level was significantly higher when
normalised by the least stable reference gene (18S) than by the most suitable reference gene (EF1α) and the combination of recommended reference genes (EF1αand 28S) in the stems. The expression levels
of HSP70 normalised using the most stable
refer-ence gene were not different from those using the combination of recommended reference genes and the least stable reference gene in the tissues of leaves (Figure 4B). The expression profiles of HSP70 were not significantly different in the herbicide treatments, no matter whether the most stable reference gene
(GAPDH), the combination of the two most stable
reference genes (GAPDH and ACT) or the least stable reference gene (28S) was used for the normalisa-tion. The HSP70 expression levels were higher in the treatment groups than the control groups and
were significantly higher when normalised by the least stable reference gene (28S) than by the most suitable reference gene (GAPDH) and the combina-tion of recommended reference genes (GAPDH and ACT) (Figure 4C).
[image:7.595.69.291.95.251.2]Another gene, AfatCYP71D7, which transcript level was lowest in 1-leaf stage while it was the high-est in 3-leaf stage among all developmental stages, and no evident difference was observed among all developmental stages. Furthermore, the expression level of AfatCYP71D7 normalised by the most stable reference gene (28S) or the combination of the two best reference genes (28S and EF1α) was not signifi-cantly different fromthe expression level calculated using the least suitable reference gene (18S) in each developmental stage (P < 0.05) (Figure 5A). Across different tissues, which transcript level was lowest in the roots while it was the highest in the stems among all the tissues, and no evident difference of AfatCYP71D7 transcript levels was observed in the Figure 3. Optimal number of reference genes for
[image:7.595.329.506.97.437.2]norma-lisation in A. fatua
Figure 4. Relative expression levels of a target gene of interest (HSP70) were calculated using different sets of reference genes
V1/3 V3/4 V4/5 V5/6 V6/7 V7/8 Number
0.20
0.15
0.10
0.05
0
Pair
w
is
e v
ar
ia
tion
Developmental stage Herbicide treatment
Different tissue All samples □ NF1 ■ NF1-2 ▤ NF8
1st 2nd 3rd
Development stages 2.0
1.5
1.0
0.5
0
Re
la
tive qu
an
tity
roots stems leaves Tissues
15
10
5
0
Control Herbicide treatments 15
10
5
0
(A)
(B)
leaves no matter whether it was normalised by the most stable reference gene (EF1α), the combination of the two most stable reference genes (EF1αand 28S), or the least stable reference gene (18S). However, the expression level of HSP70 normalised by the most stable reference gene (EF1α), the combination of the two most stable reference genes EF1αand 28S) was markedly different fromthe expression level calcu-lated using the least stable reference gene (18S) in the stems (Figure 5B). Across herbicide treatments, AfatCYP71D7 transcript levels increased significantly in herbicide treatments compared with controls no matter whether it was normalised by the most stable reference gene (GAPDH), the combination of the two most stable reference genes (GAPDHand ACT), or the least stable reference gene (28S). Furthermore, the expression level of AfatCYP71D7normalised by the most stable reference gene or the combination of the two best reference genes was not markedly
different fromthe expression level calculated using the least suitable reference gene in treatments (P < 0.05) (Figure 5C).
DISCUSSION
To our knowledge, this is first systematic study to validate a set of candidate reference genes for qPCR in A. fatua. Our results indicated that GAPDH and
EF1α were the best reference genes according to the average expression stability (M) or stability values acquired by ΔCt method, geNorm, BestKeeper, Norm- finder and RefFinder. There were some differences in developmental stages, tissues and herbicide treat-ments when the outcomes of the five methods were compared. Considering the developmental stages, the most stable genes were 28S and EF1α(ΔCt method, NormFinder and RefFinder), RPL7 and 28S (Best-keeper), GAPDHand 28S(geNormal), respectively. Among different tissues, the most stable genes were
EF1α and TBP(BestKeeper and geNorm), 28S and
GAPDH (ΔCt method), 28S and α-TUB (NormFinder),
and EF1α and 28S (RefFinder), respectively. For her-bicide treatments, the most stable genes were GAPDH
and TBP(ΔCt methods and NormFinder),18Sand
[image:8.595.79.247.99.451.2]EF1α (BestKeeper), 28S and GAPDH(geNorm), and GAPDH and ACT(RefFinder), respectively. Based on the rankings from RefFinder, which integrates outcomes of the four major statistic algorithms (ΔCt methods, geNorm, Normfinder, and Bestkeeper), and it also assigns an appropriate weight to an individual gene and calculates the geometric mean of their weight, GAPDHand EF1α had a good performance under specific conditions. Of these reference genes tested (GAPDH, EF1α, 18S, 28S, and ACT) in A. fatua varied greatly, GAPDHand EF1α wererecommended as the most suitable reference genes while 18S was ranked as the less suitable reference genes under the majority of the experimental conditions in our results, which was consistent with the other studies examining reference gene expression (Petit et al. 2012; Duhoux & Délye 2013). However, some reports indicated 18S was recommended to validate gene expression data in Solanum melongena L. or Oryza sativa L. (Kim et al. 2003; Gantasala et al. 2013). GAPDH was one of the most stably expressed genes in our results consistent with the previous results in A. fatua (Wrzesińska et al. 2016)as well as other weed species, such as Alo-pecurus myosuroides Huds and Lolium sp. (Duhoux & Délye 2013). However, GAPDH was not stable in Figure 5. Relative expression levels of a target gene of
interest (AfatCYP71D7) were calculated using different sets of reference genes
□ NF1 ■ NF1-2 ▤ NF8
1st 2nd 3rd
Development stages 2.0
1.5
1.0
0.5
0
Re
la
tive qu
an
tity
roots stems leaves Tissues
6
4
2
0
Control Herbicide treatments 5
4
3
2
1
0
(A)
(B)
Petunia x hybrida during leaf and flower development (Mallona et al. 2010). EF1αwas also recommended as one of the most stable reference gene to validate gene expression data in this study, the similar results were obtained in other researches (Hornáková et al. 2010; Zhang et al. 2015).
The suitability rankings of the reference genes were different with the different programs as the stability of the expression of eight candidate reference genes was evaluated via five commonly used programs (RefFinder, geNorm, NormFinder, BestKeeper, and ΔCt method) for data generated in different experi-mental conditions. Thus, 28S, TBP, ACT and so on in specific conditions were also recommended as suitable for reference genes. This was somewhat consistent with the previous results 18S or 28S is an ideal reference gene for normalisation of qPCR data (Bagnall & Kotze 2010). TBP is as one of the most stably expressed genes in previous study of A. fatua (Wrzesińska et al. 2016) as well as the research in Solanum lycopersicum and Lolium multiflorum L. (Expósito-Rodríguez et al. 2008; Wang et al. 2015). ACT as traditional reference genes is not always stable in different experimental conditions, which was somewhat in accordance with several studies demonstrating ACT as an unsuitable internal control for RT-PCR in other cell types or species (Lord et al. 2010). Recent studies have shown that
ACTexpression can change in response to a variety of conditions (Ruan & Lai 2007; Zarivi et al. 2015; Wrzesińska et al. 2016). Thus, these traditionally used reference genes are not persistently and stably expressed in many species or different experimental treatments (Chandna 2012; Cheng et al. 2013; Ma et al. 2016), which emphasised the need to evaluate reference genes in A. fatua.
To validate whether these selected reference genes are reliable in the conditions tested in this study, the expression levels of HSP70, an important stress-inducible heat shock protein gene (Bettencourt et al. 2007) and AfatCYP71D7, a P450 gene that could be induced significantly by herbicides in our previous results, were analysed in different devel-opmental stages, tissues, and herbicide treatments, demonstrating that the use of unsuitable reference gene for normalisation might lead to deviated results. Therefore, it has proved that choosing appropriate reference genes for normalisation is a key precondi-tion for the accurate estimaprecondi-tion of target gene ex-pression though only two target genes were chosen to validate these selected reference genes.
In summary, eight genes were tested via five popu-larly applied programs and confirmed that GAPDH and EF1αwere the most suitable reference genes for explore gene expression profiles of different devel-opmental stages, tissues, and herbicide treatments. This study not only provides useful reference to Northern blot and reverse transcription PCR tech-niques that require a reference gene for normalisa-tion, but also identifies several potential reference genes to accurately evaluate target gene expression profiles in A. fatua.
References
Andersen C.L., Jensen J.L., Ørntoft T.F. (2004): Normaliza-tion of real-time quantitative reverse transcripNormaliza-tion-PCR data: a model-based variance estimation approach to iden-tify genes suited for normalization, applied to bladder and colon cancer data sets. Cancer Research, 64: 5245–5250. Bagnall N.H., Kotze A.C. (2010): Evaluation of reference
genes for real-time PCR quantification of gene expression in the Australian sheep blowfly, Lucilia cuprina. Medical & Veterinary Entomology, 24: 176–181.
Bettencourt B.R., Hogan C.C., Nimali M. (2007): Poly-glutamine expansion in Drosophila: thermal stress and Hsp70 as selective agents. Journal of Biosciences 32: 537–547.
Bustin S.A., Benes V., Garson J.A., Hellemans J., Huggett J., Kubista M., Mueller R., Nolan T., Pfaffl M.W., Shipley G.L.(2009):The MIQE guidelines: minimum information for publication of quantitative real-time PCR experi-ments. Clinical Chemistry, 55: 611–622.
Cavan G., Cussans J., Moss S. (2001):Managing the risks of herbicide resistance in wild oat. Weed Science, 49: 236–240.
Chandna R., Augustine R., Bisht N.C.(2012):Evaluation of candidate reference genes for gene expression nor-malization in Brassica juncea using real time quantitative RT-PCR. PloS ONE 7(5): e36918. doi: 10.1371/journal. pone.0036918
Cheng D., Zhang Z., He X., Liang G. (2013): Validation of reference genes in Solenopsis invicta in different develop-mental stages, castes and tissues. PloS ONE 8(2): e57718. doi: 10.1371/journal.pone.0057718
Cruzhipolito H., Osuna M.D., Domínguezvalenzuela J.A., Espinoza N., De Prado R. (2011):Mechanism of resist-ance to accase-inhibiting herbicides in wild oat (Avena fatua) from Latin America. Journal of Agricultural & Food Chemistry, 59: 7261–7267.
P450 genes in plants resistant to acetolactate-synthase inhibitors. PLoS ONE, 8(5): e63576. doi: 10.1371/journal. pone.0063576
Expósito-Rodríguez M., Borges A.A., Borges-Pérez A., Perez J.A. (2008): Selection of internal control genes for quantitative real-time RT-PCR studies during tomato development process. BMC Plant Biology, 8: 131. doi:
10.1186/1471-2229-8-131
Gantasala N.P., Papolu P.K., Thakur P.K., Kamaraju D., Sreevathsa R., Rao U. (2013): Selection and validation of reference genes for quantitative gene expression studies by real-time PCR in eggplant (Solanum melongena L). BMC Research Notes, 6: 1–11.
Glare E.M., Divjak M., Bailey M.J., Walters E.H. (2002):
β-Actin and GAPDH housekeeping gene expression in asthmatic airways is variable and not suitable for normalising mRNA levels. Thorax, 57: 765-770. Holm L.G., Plucknett D.L., Pancho J.V., Herberger K.P. (1977):
The World’s Worst Weeds. Distribution and Biology. Hono-lulu, East-West Center by the University Press of Havaii. Hornáková D., Matousková P., Kindl J., Valterová I., Pichová
I.(2010): Selection of reference genes for real-time poly-merase chain reaction analysis in tissues from Bombus terrestris and Bombus lucorum of different ages. Analyti-cal Biochemistry, 397: 118–120.
Huggett J., Dheda K., Bustin S., Zumla A. (2005): Real-time RT-PCR normalisation; strategies and considerations. Genes & Immunity, 6: 279.
Keith B.K., Lehnhoff E.A., Burns E.E., Menalled F.D., Dyer W.E. (2015): Characterisation of Avena fatua populations with resistance to multiple herbicides. Weed Research, 55: 621–630.
Kim B.R., Nam H.Y., Kim S.U., Kim S.I., Chang Y.J. (2003): Normalization of reverse transcription quantitative-PCR with reference genes in rice. Biotechnology Letters, 25: 1869–1872.
Li R., Wang S., Duan L., Li Z.H., Christoffers M.J., Mengistu L.W. (2009): Genetic diversity of wild oat (Avena fatua) populations from china and the united states. Weed Sci-ence, 55: 95–101.
Li R., Zhang J., Chen G. (2010): Advance of study on iden-tification of weed herbicide resistance. Chinese Agricul-tural Science Bulletin, 26: 289–292.
Liang P., Guo Y., Zhou X., Gao X.W. (2014): Expression profiling in, Bemisia tabaci, under insecticide treat-ment: indicating the necessity for custom reference gene selection. PloS ONE, 9(1): e87514. doi: 10.1371/journal. pone.0087514
Logan J., Edwards K., Saunders N. (eds) (2009): Real-Time PCR: Current Technology and Applications. Norfolk, Caister Academic Press.
Lord J.C., Hartzer K., Toutges M., Oppert B. (2010): Evalua-tion of quantitative PCR reference genes for gene expres-sion studies in Tribolium castaneum after fungal challenge. Journal of Microbiological Methods, 80: 219–221. Lu Y., Yuan M., Gao X., Kang T.H, Zhan S., Wan H., Li J.H.
(2013): Identification and validation of reference genes for gene expression analysis using quantitative PCR in Spodoptera litura (Lepidoptera: Noctuidae). PloS ONE, 8(7): e68059.doi: 10.1371/journal.pone.0068059 Ma K.S., Li F., Liang P.Z., Chen X.W., Liu Y., Gao X.W.
(2016): Identification and validation of reference genes for the normalization of gene expression data in qRT-PCR qPCR analysis in Aphis gossypii (Hemiptera: Aphididae). Journal of Insect Science, 16: 1–9.
Mallona I., Lischewski S., Weiss J., Hause B., Egea-Cortines M.(2010): Validation of reference genes for quantitative real-time PCR during leaf and flower development in Petunia hybrida. BMC Plant Biology, 10: 4.
Overbergh L., Giulietti A., Valckx D., Decallonne B., Bouillon R., Mathieu C. (2003): The use of real-time reverse tran-scriptase PCR for the quantification of cytokine gene expres-sion. Journal of Biomolecular Techniques: JBT, 14: 33–43. Petit C., Pernin F., Heydel J.M., Delye C. (2012): Validation
of a set of reference genes to study response to herbicide stress in grasses. BMC Research Notes, 5: 1–10. Pfaffl M.W. (2001): A new mathematical model for
rela-tive quantification in real-time RT-PCR. Nucleic Acids Research, 29(9): e45.doi: 10.1093/nar/29.9.e45
Pfaffl M.W., Tichopad A., Prgomet C., Neuvians T.P. (2004): Determination of stable reference genes, differentially regulated target genes and sample integrity: BestKeeper-Excel-based tool using pair-wise correlations. Biotechnol-ogy Letters, 26: 509–515.
Ryan G.F. (1970): Resistance of common groundsel to sima-zine and atrasima-zine. Weed Science, 18: 614–616.
Ruan W., Lai M. (2007): Actin, a reliable marker of internal control? Clinica Chimica Acta, 385: 1–5.
Spiess A.N., Deutschmann C., Burdukiewicz M., Himmel-reich R., Klat K., Schierack P., Rödiger S. (2015): Impact of smoothing on parameter estimation in quantitative DNA amplification experiments. Clinical Chemistry, 61: 379–388.
Spiess A.N., Rödiger S., Burdukiewicz M., Volksdorf T., Tellinghuisen J. (2016) System-specific periodicity in quantitative real-time polymerase chain reaction data questions threshold-based quantitation. Scientific Re-ports, 6, Article number: 38951. doi: 10.1038/srep38951 Tellinghuisen J., Spiess A.N. (2014): Comparing real-time
Thellin O., Zorzi W., Lakaye B., De Borman B., Coumans B., Hennen G., Grisar T., Igout A., Heinen E. (1999): Refer-ence genes as internal standards: use and limits. Journal of Biotechnology, 75: 291–295.
Vandesompele J., de Preter K., Pattyn F., Poppe B., Van Roy N., De Paepe A., Speleman F. (2002): Accurate normaliza-tion of real-time quantitative RT-PCR data by geometric averaging of multiple internal control genes. Genome Biology, 3: research 0034.1. doi:10.1186/gb-2002-3-7-research0034
Wang X., Ma X., Huang L., Zhang X. (2015): Identification of the valid reference genes for quantitative RT-PCR in annual ryegrass (Lolium multiflorum) under salt stress. Molecules, 20: 4833–4847.
Wrzesińska B., Kierzek R., Obrępalska-Stęplowska A.
(2016): Evaluation of six commonly used reference genes
for gene expression studies in herbicid-resistant Avena fatua biotypes. Weed Research, 56: 284–292.
Zarivi O., Cesare P., Ragnelli A.M., Aimola P., Leonardi M., Bonfigli A., Colafarina S., Poma A.M., Miranda M., Pacioni G. (2015): Validation of reference genes for quan-titative real-time PCR in Perigord black truffle (Tuber melanosporum) developmental stages. Phytochemistry, 116: 78–86.
Zhang S., An S., Li Z., Wu F., Yang Q., Liu Y., Cao J., Zhang H., Zhang Q., Liu X. (2015): Identification and validation of reference genes for normalization of gene expression analysis using qRT-PCR in Helicoverpa armigera (Lepi-doptera: Noctuidae). Gene, 555: 393–402.